Pine Trees MT5
- Indikatoren
- Version: 7.4
- Aktualisiert: 19 November 2021
- Aktivierungen: 5

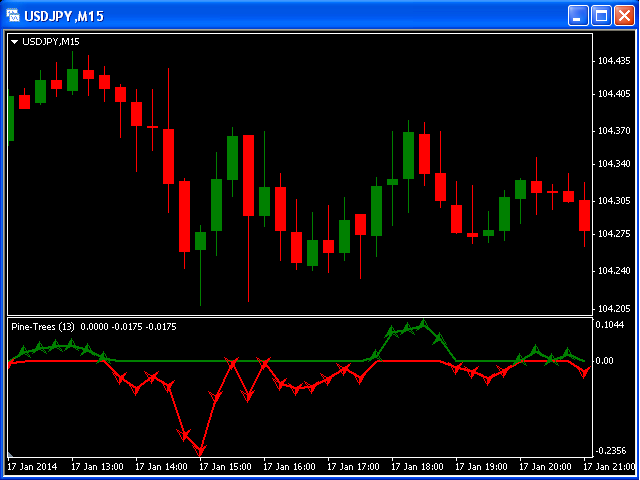
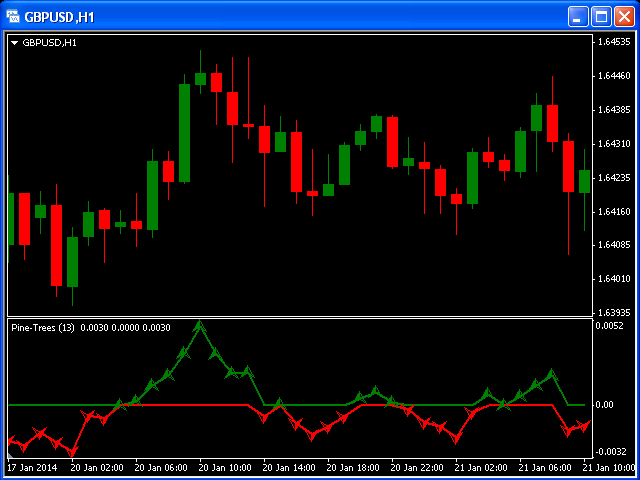
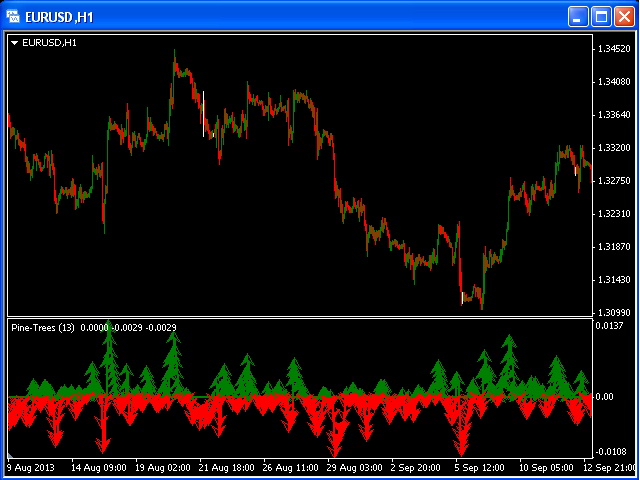
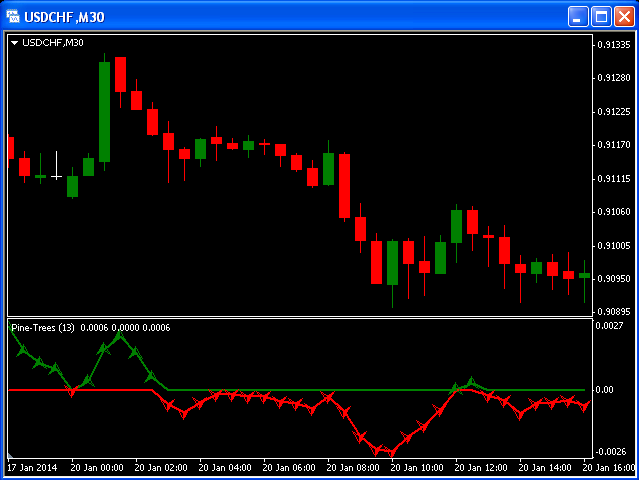
Der Trend istdie Richtung, in die sich die Preise bewegen, ausgehend davon, wo sie sich in der Vergangenheit befunden haben. Trends setzen sich aus Höchst- und Tiefstständen zusammen. Es ist die Richtung dieser Höchst- und Tiefststände, die den Trend eines Marktes ausmacht. Ob sich diese Höchst- und Tiefststände nach oben, unten oder seitwärts bewegen, zeigt die Richtung des Trends an.
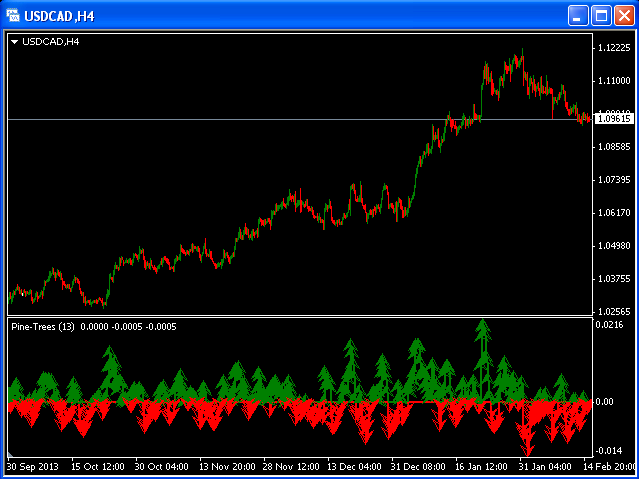
Der Indikator PineTrees ist empfindlich genug (man muss den Eingabeparameter nPeriod verwenden), um Aufwärts- (grüne Linie) und Abwärtstrends (rote Linie) anzuzeigen.