Quantum Currency Heatmap Indicator for MT5
- Indicadores
- Versión: 2.0
- Actualizado: 6 enero 2025
- Activaciones: 5

Operar en los mercados de divisas es un negocio complejo, sobre todo porque se trata de pares de divisas y, por inferencia, de pares de economías. Todas las economías del mundo están interrelacionadas, lo que se refleja en el constante flujo y reflujo de la fortaleza y debilidad de las divisas. El problema para nosotros, como operadores, es supervisar tantos pares simultáneamente, ya que cada par no se mueve de forma independiente, sino que refleja la naturaleza interrelacionada de este mercado.
El Quantum Currency Heatmap le ofrece la información que necesita para basar sus decisiones de trading en los datos de todo un espectro de pares de divisas derivados de las 8 divisas principales. A saber, USD, EUR, GBP, CHF, JPY, CAD, AUD y, por último, NZD. En una tabla clara, sencilla e intuitiva, podrá ver al instante todo el peso del sentimiento del mercado en los 28 pares y en todos los plazos.
Una visión global del riesgo y el sentimiento en un gráfico en dos dimensiones. Verticalmente en la tabla de clasificación y horizontalmente en el horizonte temporal. Instantáneo, sencillo y potente.
Sin varios monitores, sin varios ordenadores, sin pantallas abarrotadas, sin ir de un marco temporal a otro y viceversa. Todo está aquí para permitirle tomar decisiones instantáneas en cuestión de segundos.
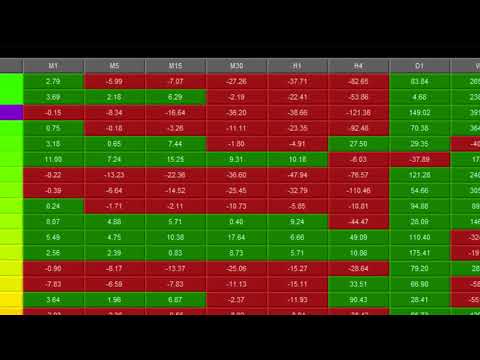
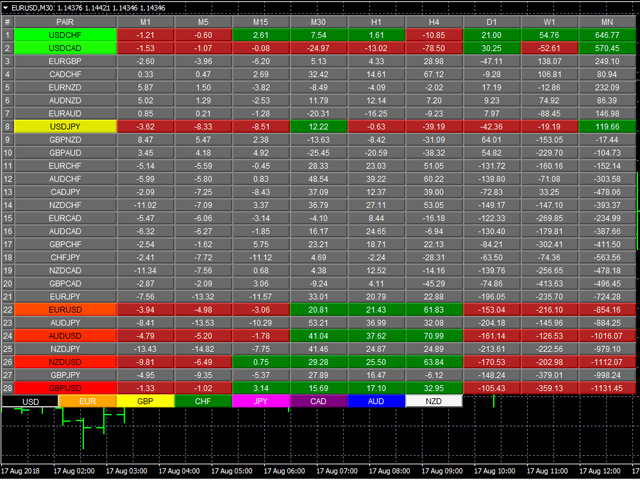
El Quantum Currency Heatmap muestra al instante las zonas "más calientes" y "más frías" del panorama de divisas. Verticalmente, se enumeran 28 pares de divisas que se clasifican desde el par más alcista (arriba) hasta el par más bajista (abajo) y que extraen los datos de la Matriz de Divisas Quantum. Y aquí es donde se pone interesante: horizontalmente, las puntuaciones de rendimiento de cada par de divisas se muestran en 9 marcos temporales que son 1 minuto, 5 minutos, 15 minutos, 30 minutos, cada hora, 4 horas, diario, semanal y mensual.
Cada celda del Quantum Currency Heatmap está codificada por colores, lo que permite interpretarla al instante con sólo un vistazo, como si se tratara de un sofisticado escáner de imágenes térmicas, pero para el mercado de divisas. Si echa un vistazo al indicador, verá lo fácil e intuitivo que es el diseño, pero vamos a ampliarlo aquí.
Empecemos por la puntuación del rendimiento. Este es el valor que el indicador asigna a cada par de divisas que representa cuán positiva o negativamente se movió su precio durante un cierto período. Puede ser de cualquiera de los dos colores dependiendo de su valor, y este es el código de colores utilizado cuando se ven los pares de divisas A TRAVÉS del horizonte de tiempo - ¡el horizontal!
- Verde: si la puntuación del rendimiento del par de divisas es positiva.
- Rojo: si la puntuación del par de divisas es negativa.
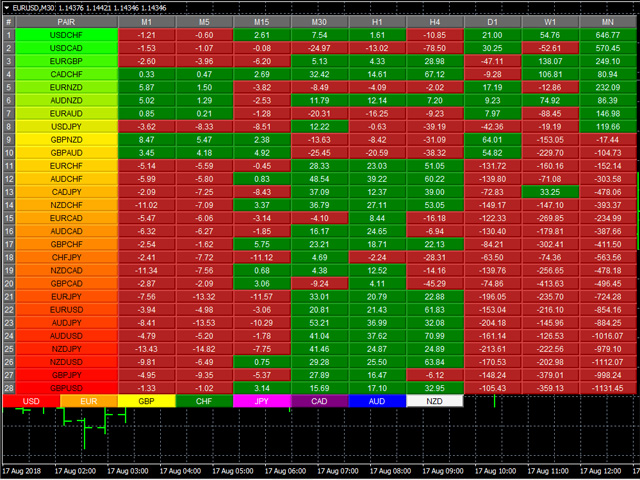
Sin embargo, los pares se clasifican VERTICALMENTE utilizando un código de colores dinámico, pasando del verde al amarillo y al rojo en ese orden. Se suman las puntuaciones de rendimiento de los pares de divisas en 9 plazos. A continuación, los pares de divisas se clasifican por su suma, del más positivo al más negativo, y se codifican por colores de la siguiente manera:
- Tonos verdes: la suma de las puntuaciones de rendimiento del par de divisas en 9 plazos, y ponderada en consecuencia, está muy por encima del punto de equilibrio de cero.
- Tonos amarillos - la suma de las puntuaciones de rendimiento del par de divisas en 9 plazos, y ponderada en consecuencia, es relativamente plana y alrededor del punto de apoyo de 0. Puede ser positiva o negativa, pero sigue los números más cercanos a 0.
- Tonos rojos: la suma de las puntuaciones de rendimiento del par de divisas en 9 marcos temporales, y ponderada en consecuencia, está muy por debajo del punto de equilibrio de cero.
La gradación del color es dinámica. Por lo tanto, la transición de colores dependerá enteramente de la suma de las puntuaciones de rendimiento del par de divisas en los 9 plazos, como se explicó anteriormente. Al igual que el resto de nuestros indicadores, éste es dinámico y cambia constantemente en tiempo real para reflejar el flujo y reflujo del sentimiento a lo largo de los plazos.
El indicador aplica una ponderación en la escala de clasificación para reflejar el hecho de que una tendencia en un marco temporal más lento tiene mayor importancia que una tendencia en un marco temporal más rápido.
Un paso atrás, los colores cambiantes ofrecen un mapa térmico que refleja el rendimiento relativo de los 28 pares de divisas en TODOS los plazos en tiempo real. Esto proporciona un análisis horizontal de los pares de divisas a lo largo del tiempo. Esto es inmensamente poderoso y le permite, como trader, tomar decisiones claras, lógicas y rápidas. El mapa de calor hace que el complejo mundo de las divisas sea simple y claro. Un espacio de trabajo que proporciona información de 252 gráficos.