Trend Sync MT5
- Indikatoren
-
Pavel Verveyko
 Writing scripts, indicators, EAs on MQL5 and MQL4.
Fast, Reliable, And High-Quality.
For all questions, please contact personal messages. - Version: 1.5
- Aktualisiert: 26 Mai 2022
- Aktivierungen: 5
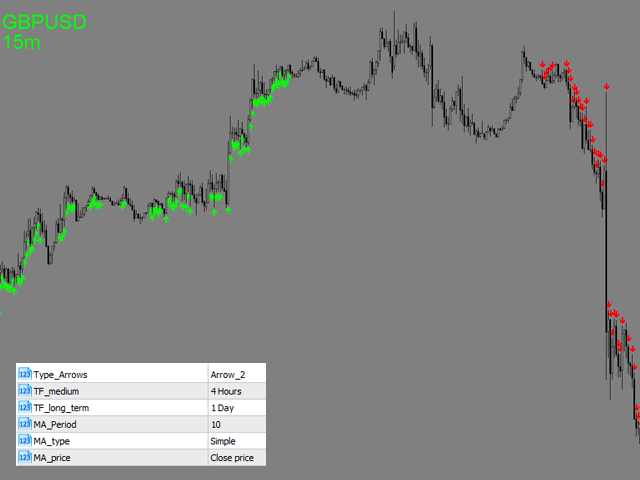
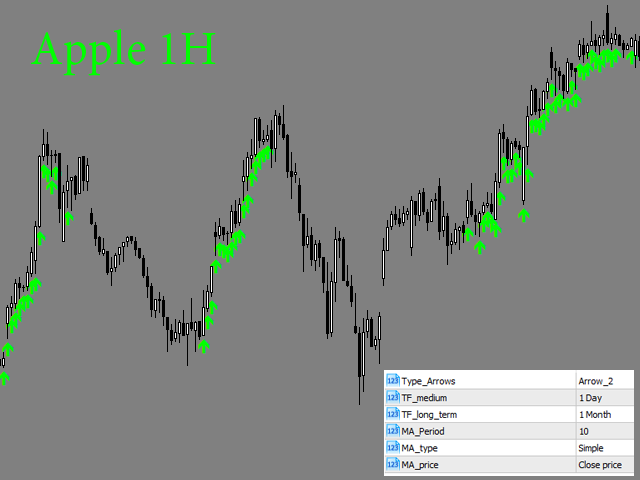
Der Indikator zeigt den Trend von 3 Zeitrahmen an:
- höherer Zeitrahmen;
- mittlerer Zeitrahmen;
- kleinerer (aktueller) Zeitrahmen, in dem der Indikator läuft.
Der Indikator sollte auf einem Chart gestartet werden, dessen Zeitrahmen kleiner ist als der obere und der mittlere Zeitrahmen.
Die Idee ist, die Trendstärke bei der Eröffnung von Positionen zu nutzen. Die Kombination von 3 Zeitrahmen (kleinerer, mittlerer, höherer) ermöglicht es, den Trend auf allen Ebenen des Instruments zu verfolgen.
Die höheren Zeitrahmen werden für Berechnungen verwendet. Daher können plötzliche Marktveränderungen dazu führen, dass sich das Signal bei der Aktualisierung des Charts ändert, wenn die Kerzen der höheren Zeitrahmen noch nicht geschlossen sind. Dadurch ist der Indikator jedoch in der Lage, mit aktuell offenen Positionen zu interagieren (er analysiert die relevanteste und aktuellste Situation auf dem Markt).
Der Indikator informiert über die synchrone Bewegung von Trends in den in den Einstellungen gewählten Zeiträumen und über die Desynchronisation von Trends.
Einstellungen
- Type_Arrows - Art der Pfeile.
- TF_medium - mittelfristiger Zeitrahmen.
- TF_long_term - langfristiger Zeitrahmen.
- MA_Period - Periode des gleitenden Durchschnitts für die Trendbestimmung.
- MA_type - Typ des gleitenden Durchschnitts für die Bestimmung von Trends.
- MA_price - Preistyp, der für die Berechnung des gleitenden Durchschnitts verwendet wird.
- only_sound - Tonalarm aktivieren / deaktivieren.
- alert - Aktivieren / Deaktivieren des Alarms (Ton+Dialog).
- send_mail - Aktivieren / Deaktivieren von E-Mail-Warnungen.
- send_notification - Aktivieren / Deaktivieren von Benachrichtigungen auf dem mobilen Endgerät.