Short term extremum
- Indikatoren
-
Gennadiy Stanilevych
 Developments in the field of the "Trading Chaos" strategy involve the use of big data processing technology to generate trading signals and automate order placement based on those signals. All my software products are available on the "Market" page, which can be found at
 - Version: 7.9
- Aktualisiert: 16 September 2024
- Aktivierungen: 13
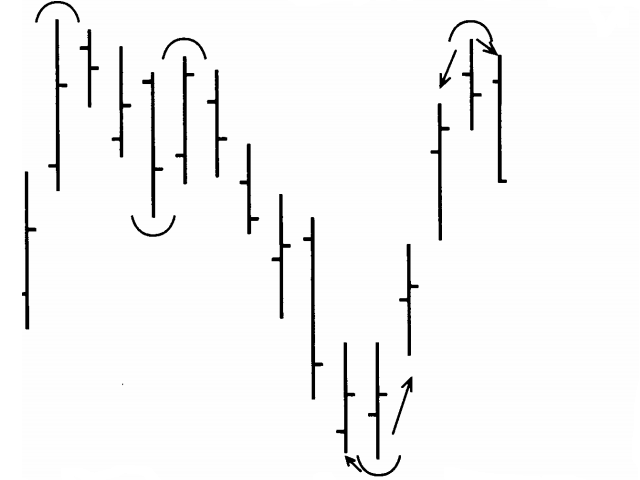
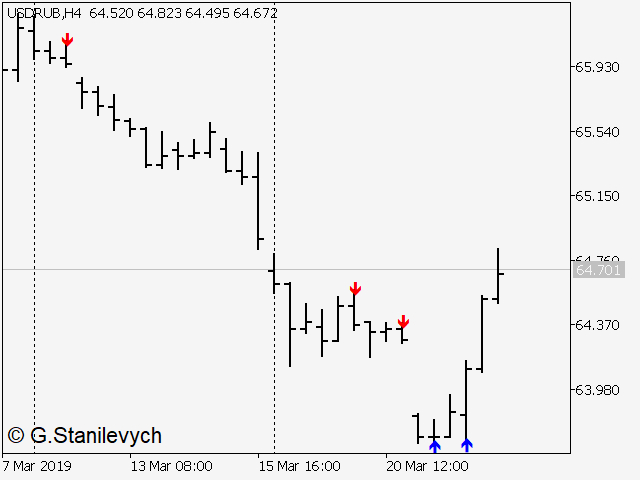
Der Indikator bestimmt und markiert die kurzfristigen Tiefs und Hochs des Marktes auf dem Chart gemäß Larry Williams' Buch "Long-term secrets to short-term trading".
"Any time there is a daily low with higher lows on both sides of it, that low will be a short-term low. We know this because a study of market action will show that prices descended in the low day, then failed to make a new low, and thus turned up, marking that ultimate low as a short-term point. A short-term market high is just the opposite. Here we will see a high with lower highs on both sides of it. What this says is that prices rallied up to the zenith of that middle day, then began to move back down, and in the process formed a short-term high. For our purposes in identifying short-term swing points, we will simply ignore inside days and the possible short-term points they produce."
Beim Auftreten eines kurzfristigen Hochs zeigt der Indikator den roten Abwärtspfeil über dem Niveau des zentralen Balkens an, der einen Pivot-Punkt bildet. Der grüne Aufwärtspfeil erscheint unter dem Niveau des Pivotpunkts. Es wird davon ausgegangen, dass das Signal nach dem Schluss des letzten Balkens auf dem Diagramm gebildet wird.
Larry Williams empfiehlt, einen Vermögenswert zum Eröffnungskurs des nächsten Balkens nach der Signalbildung zu kaufen oder zu verkaufen. Der Stop-Loss sollte über (unter) dem lokalen Hoch (Tief) platziert werden.
Swing-Points-Signale sind gute Filter und Verstärker für andere Handelsstrategien.
Parameter
- Draw uncompleted signals - true - aktiviert das Zeichnen von Pfeilen auf dem Chart, die die vorläufigen Handelssignale bei unvollständigen Bars anzeigen. false - die vorläufigen Handelssignale sind bei unvollständigen Bars deaktiviert.
- MA Periode - Periode des gleitenden Durchschnitts für die Bildung von Handelssignalen bei lokalen Extremwerten
- MA Methode - Auswahl des Typs des gleitenden Durchschnitts


good indicator