R2 oscilator
- Indikatoren
-
Jose Miguel Soriano
 Financial Manager (real estate sector)
Management Computing degree (University of Almeria) - Version: 2.10
- Aktualisiert: 23 Januar 2022
- Aktivierungen: 5
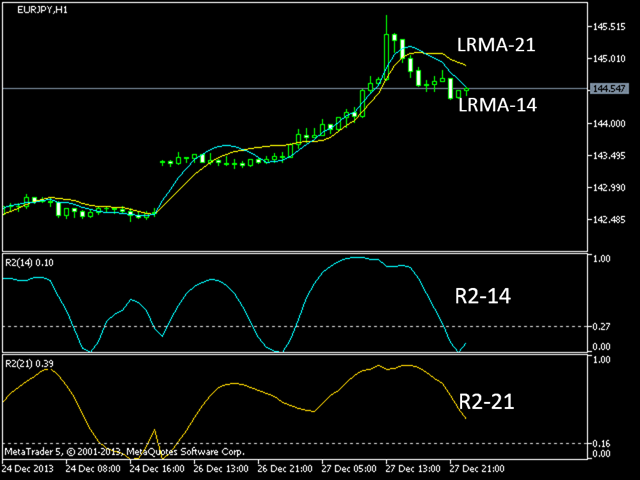
R2 (R-Quadrat) ist das Quadrat des Korrelationskoeffizienten zwischen den aktuellen Preisen und den aus der linearen Regression abgeleiteten Preisen. Er ist das statistische Maß dafür, wie gut die Regressionslinie an die tatsächlichen Daten angepasst ist , und misst daher die Stärke des vorherrschenden Trends, ohne zwischen einem aufsteigenden und einem absteigenden Trend zu unterscheiden.
Der R2-Wert schwankt zwischen 0 und 1 und ist daher ein Oszillator für Bänder, die Anzeichen von Sättigung (überkauft/überverkauft) aufweisen können. Je mehr sich der Wert der Null nähert, desto schwächer ist der Trend, und umgekehrt ist der Trend umso stärker, je näher er an 1 herankommt.
Ein R2 von 0,7, berechnet über einen Zeitraum von 5 Tagen, bedeutet beispielsweise, dass 70 % der Kursbewegungen in diesem Intervall durch die Regressionslinie erklärt werden und die restlichen 30 % unerklärtes Rauschen sind.
Berechnung
p= price; t= period
Das Vertrauen in die Vorhersagen der Stärke von R2 hängt vom Zeitraum seiner Berechnung ab. Statistisch gesehen sind ihre kritischen Werte für das 95%ige Vertrauen:
       period   R2 value (95% confidence)
         5        0.77
         10       0.40
         14       0.27
         20       0.20
         25       0.16
         30       0.13
         50       0.08
         60       0.06
         120      0.03
Die Nützlichkeit dieses Indikators erhöht sich, wenn er zusammen mit dem Indikator für die Steigung der linearen Regression verwendet wird, der die Richtung des Trends angibt, während R2 uns über die Stärke des Trends informiert.