R2 oscilator
- Indicadores
-
Jose Miguel Soriano
 Ingeniero Técnico en Informática de Gestión (Universidad de Almería)
 - Versión: 2.10
- Actualizado: 23 enero 2022
- Activaciones: 5
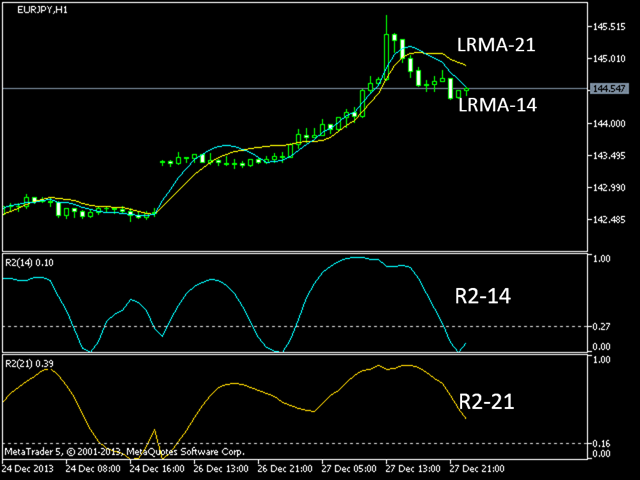
R2 (R-cuadrado) representa el cuadrado del coeficiente de correlación entre los precios actuales y los deducidos de la regresión lineal. Es la medida estadística de lo bien que se ajusta la línea de regresión a los datos reales, por lo que mide la fuerza de la tendencia predominante sin distinguir entre ascendente y descendente.
El valor R2 varía entre 0 y 1, por lo que es un oscilador de bandas que puede mostrar signos de saturación (sobrecompra / sobreventa). Cuanto más se acerque el valor a cero, más débil será la tendencia y, por el contrario, cuanto más se acerque a 1, más fuerte será la tendencia.
Por ejemplo, un R2 de 0,7 calculado sobre un periodo de 5 días significa que el 70% de los movimientos del precio en ese intervalo se explican por la línea de regresión y el 30% restante es ruido no explicado.
Cálculo
p= price; t= period
La confianza de las predicciones de la fuerza de R2 depende del periodo de su cálculo. Estadísticamente sus valores críticos para el 95% de confianza son:
       period   R2 value (95% confidence)
         5        0.77
         10       0.40
         14       0.27
         20       0.20
         25       0.16
         30       0.13
         50       0.08
         60       0.06
         120      0.03
La utilidad de este indicador aumenta cuando se utiliza con el indicador de pendiente de regresión lineal que informa de la dirección de la tendencia, mientras que R2 nos informa de la fuerza de la tendencia.