Normalized OBV
- Indikatoren
-
Jose Miguel Soriano
 Financial Manager (real estate sector)
Management Computing degree (University of Almeria) - Version: 2.10
- Aktualisiert: 23 Januar 2022
- Aktivierungen: 5
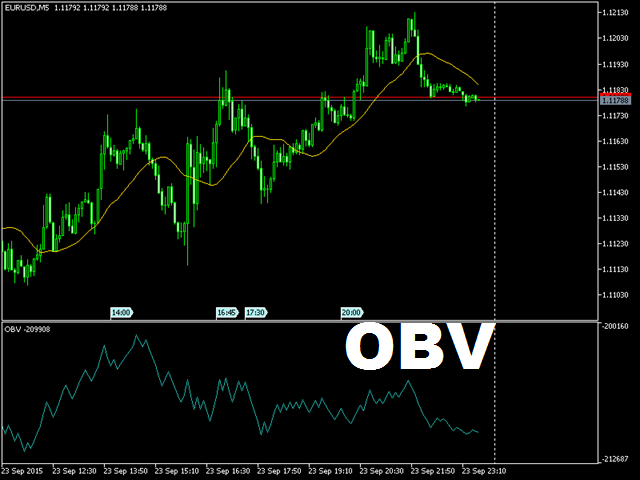
Wenn man sich die Informationen des On Balance Volume Indikators ansieht, stellt sich die Frage, ob es sich um eine starke oder schwache Bewegung handelt. Sollte sie mit den vorangegangenen Tagen verglichen werden? Diese Daten sollten normalisiert werden, um immer eine Referenz zu haben.
Dieser Indikator weist folgende Parameter auf:
- Normalisierungszeitraum (Max-Mins absolut)
- Glättungszeitraum (-1 off)
- Tick/Reales Volumen
- Maximale Anzahl der zu berechnenden Balken (-1 off)
- Normalisierung des oberen Wertes
- Normierung des unteren Wertes
Berechnung: normOBV = (Wert - absMin) * (relMax - relMin) / (absMax - absMin) + relMin