• Übersicht
  • Bewertungen
  • Diskussion (4)
  • Neue Funktionen

Normalized Volumes Indicator

When looking at the volume information that moves the market, a question arises: is it a strong or weak movement? Should it be compared with previous days? These data should be normalized to always have a reference.

This indicator reports the market volume normalized between 0-100 values.

  • It has a line that smoothes the main signal (EMA).
  • The normalization of values occurs within an interval defined by user (21 bars on default).
  • User can also define any relative maximum, timeframe and number of bars to calculate.

Calculation: volNorm = (volReal - absMin) * (relMax - relMin) / (absMax - absMin) + relMin
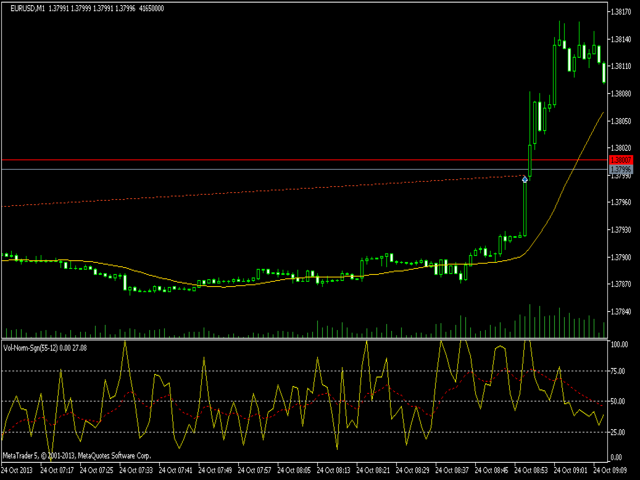
Pay attention to the signal line on the chart (M1, period 55, signal 12): the price increase is preceded by a phase, in which the volumes are below 50 and the price increase is preceded by an increase in volumes in zone 75.

Empfohlene Produkte
Normalized OBV
Jose Miguel Soriano
When looking at the information of On Balance Volume indicator, a question arises: is it a strong or weak movement? Should it be compared with previous days? These data should be normalized to always have a reference. This indicator presents the followings parameters: Normalization period (Max-Mins absolute) Smoothing period (-1 off) Tick/Real Volume Maximum number of bars to calculate (-1 off) Upper value normalization Lower value normalization Calculation: normOBV = (value - absMin) * (relMa
The Effort and Result indicator is based on the work of Karthik Marar; a volume spread analysis trader. It compares a price change (Result) to the volume size (Effort) for a certain period.  By comparing the effort and result, we can get more information about the future price movement. Both values are normalized and converted to a scale of 0 - 100 % based on a selectable look-back period. This indicator is also known as the Effort Index. The law of effort and result The law of effort vs. r
KT Volume Profile MT5
KEENBASE SOFTWARE SOLUTIONS
5 (1)
KT Volume Profile shows the volume accumulation data as a histogram on the y-axis providing an ability to find out the trading activity over specified time periods and price levels. Point of Control (POC) in a Volume Profile POC represents a price level that coincides with the highest traded volume within the whole volume profile histogram. POC is mostly used as a support/resistance or as an essential price level where market retest before going in a specific direction. Features Very easy
UPD1 Profile Levels MT5
Vitaliy Kuznetsov
5 (3)
Der Indikator findet die Niveaus des maximalen und minimalen Preisvolumens (Marktprofil) auf dem Arbeitsbalkendiagramm für die angegebene Anzahl von Balken.   Verbundprofil. Die Höhe des Histogramms ist vollautomatisch und passt sich an jedes Werkzeug und jeden Zeitrahmen an. Der Algorithmus des Autors wird verwendet und wiederholt bekannte Analoga nicht. Die Höhe der beiden Histogramme ist ungefähr gleich der durchschnittlichen Höhe der Kerze. Smart Alert (Smart alert) hilft Ihnen, den Preis in
One of the Best Volume Indicators, with the addition of a Moving Average for weighting volume over time average. If the "Current Candle" Volume is X% greater than the Moving Average value, we will have a sign of increasing volume. It can be a sign of Beginning, Continuity, Reversal or Exhaustion of the Movement. Fully configurable and all options open, you can color and set ALL values as you see fit. The 'Volume Break' shows volume bars in the same color as the candlestick, in addition
The indicator measures and displays the difference in the number of "Bid" and "Ask"  prices changes in the form of digital, analog and graphic indicators. Designed for market research and for determine the moments of position closing during scalping trade with H1 or less timeframe. Use with bigger timeframe is not prohibited, but it is not informative because of a large number of accumulated values. Theory "Bid" and "Ask" prices do not change simultaneously for most symbols. Often you can see h
Fixed Range Volume Profile MT5
Abdelkhabir Yassine Alaoui
2 (1)
Auto Fixed Range Volume Profile mit Warnungen für MT5 Dieser Indikator zeigt, wo der Preis mehr Zeit verbracht hat, und hebt wichtige Niveaus hervor, die beim Handel verwendet werden können. und kann die Preisdichte im Laufe der Zeit anzeigen und die wichtigsten Preisniveaus, den Wertbereich und den Kontrollwert einer bestimmten Handelssitzung umreißen. Dieser Indikator kann an Zeitrahmen zwischen M1 und D1 angehängt werden und zeigt das Marktprofil für tägliche, wöchentliche, monatliche od
Do you use volume in your reading of the market? Certainly many traders use it, and do not imagine operating without it. The Color Histogram Volume Set indicator allows the user to choose the value that he considers interesting to monitor. When you pass this you will have visual confirmation and if you want you will also have the audible alert that is given by the indicator. Of course, there are other ways to try to find a high volume, such as assessing whether the volume
No Demand No Supply MT5
Trade The Volume Waves Single Member P.C.
No Demand No Supply   This indicator identifies   No Demand –No Supply candles  to your chart and plots volume bars colored according to the signal. It can be applied to all timeframes or to a specific one only. It can also be used as regular volume indicator  with exceptional future of WEIGHTED VOLUME. Furthermore is has an alert notification, sound and email when a signals occurs. The indicator does not repaint but the alert will come on two candles back due to the definition of No Demand No S
Wapv Price and volume
Eduardo Da Costa Custodio Santos
Der WAPV Price and Volume Indicator for MT5 ist Teil des Toolsets (Wyckoff Academy Wave Market) und (Wyckoff Academy Price and Volume). Der WAPV-Preis- und Volumenindikator für MT5 wurde entwickelt, um die Volumenbewegung auf dem Chart auf intuitive Weise einfach zu visualisieren. Damit können Sie die Momente des Spitzenvolumens und Momente beobachten, in denen der Markt kein professionelles Interesse hat Identifizieren Sie Momente, in denen sich der Markt durch Trägheit bewegt und nicht durch d
Let us introduce you to a new era of neural indicators for financial markets! Intelligent Moving is a unique indicator that trains its neural network in real time! You no longer need to look for the optimal indicator parameters for each specific situation. No more late signals. The artificial intelligence is able to adapt itself and predict any market movements. Visually, the indicator is drawn as a main solid moving average line, two dotted lines of standard deviations and signal arrows. For
BoxChart MT5
Evgeny Shevtsov
5 (7)
The market is unfair if only because 10% of participants manage 90% of funds. An ordinary trader has slim changes to stand against these "vultures". This problem can be solved. You just need to be among these 10%, learn to predict their intentions and move with them. Volume is the only preemptive factor that faultlessly works on any timeframe and symbol. First, the volume appears and is accumulated, and only then the price moves. The price moves from one volume to another. Areas of volume accumu
The Volume by Price Indicator for MetaTrader 5 features Volume Profile and Market Profile TPO (Time Price Opportunity). Get valuable insights out of currencies, equities and commodities data. Gain an edge trading financial markets. Volume and TPO histogram bar and line charts. Volume Footprint charts. TPO letter and block marker charts including split structures. Versatile segmentation and compositing methods. Static, dynamic and flexible ranges with relative and/or absolute visualizations. Lay
TD Combo MS
Masashi Shimamoto
5 (2)
This indicator's formula is quoted from that [NEW MARKET TIMING TECHNIQUES] by Thomas R. DeMark It consists of setup phase & countdown phase. But not Intersection & TDST. Countdown starts from the first of setup bar. It shows setup count number under the price & countdown number above the price on charts. SETUP: For buy first of setup bar; Close(4 bars ago)> Close(current)&Close(4 bars ago)< Close(previous bar). For sell first of setup bar follows opposite process. From the second bar; Close(4 b
FREE
An ICT fair value gap is a trading concept that identifies market imbalances based on a three-candle sequence. The middle candle has a large body while the adjacent candles have upper and lower wicks that do not overlap with the middle candle. This formation suggests that there is an imbalance where buying and selling powers are not equal. Settings Minimum size of FVG (pips) -> FVGs less than the indicated pips will be not be drawn Show touched FVGs Normal FVG color -> color of FVG that hasn't
FREE
Was: $249  Now: $99   Market Profile defines a number of day types that can help the trader to determine market behaviour. A key feature is the Value Area, representing the range of price action where 70% of trading took place. Understanding the Value Area can give traders valuable insight into market direction and establish the higher odds trade. It is an excellent addition to any system you may be using. Inspired by Jim Dalton’s book “Mind Over Markets”, this indicator is designed to suit the
The balance of supply and demand is a simple and effective market analysis method. The supply and demand diagram can show you in advance, even before the trend reversal, where the supply ends and the demand is already emerging, where the demand ends and the supply is emerging, while substantially increasing the probability of making a deal in the right direction and with a high profit factor. Indicator signals The indicator uses the price/volume values to generate signals: ED – excess demand.
BBands PMO
Norio Takahashi
The indicator allows you to simplify the interpretation of signals produced by the classical MACD indicator.  It is based on the double-smoothed rate of change (ROC).  Bollinger Bands is made from EMA line.  The indicator is a logical continuation of the series of indicators using this classical and efficient technical indicator. The strength of the trend is determined by Bands and main line. If the bands width are smaller than the specified value, judge it as suqueeze and do not recommen
The   Supply and Demand Zones indicator   is one of the best tools we have ever made. This great tool automatically draws supply and demand zones, the best places for opening and closing positions. It has many advanced features such as multi timeframe zones support, displaying the width of zones, alert notifications for retouched zones, and much more. Because of market fractality, this indicator can be used for any kind of trading. Whether you are a positional, swing, or intraday trader does no
A "Volume Profile" is an advanced charting indicator that displays total volume traded at every price level over a user specified time period. The main components of the volume profile are POC ( Point Of Control - the price level, at which the maximum number of contracts were executed during a selected period), VAH ( Value Area High - the highest price in the Value Area) and VAL ( Value Area Low - the lowest price in the Value Area). When we settled on the original indicator, we spent a lot o
Blahtech Supply Demand MT5
Blahtech Limited
4.57 (14)
Was: $299  Now: $99   Supply Demand uses previous price action to identify potential imbalances between buyers and sellers. The key is to identify the better odds zones, not just the untouched ones. Blahtech Supply Demand indicator delivers functionality previously unavailable on any trading platform. This 4-in-1 indicator not only highlights the higher probability zones using a multi-criteria strength engine, but also combines it with multi-timeframe trend analysis, previously confirmed swings
This indicator allows you to enjoy the two most popular products for analyzing request volumes and market deals at a favorable price: Actual Depth of Market Chart Actual Tick Footprint Volume Chart This product combines the power of both indicators and is provided as a single file. The functionality of Actual COMBO Depth of Market AND Tick Volume Chart is fully identical to the original indicators. You will enjoy the power of these two products combined into the single super-indicator! Below is
Each bar graph is a brick, take buy a bill now as an example, the brick that is in lowest position at the moment, go to the left, when the brick with the 3rd highest is in existence, take the height of this brick as a benchmark, when the price exceeds the height of this brick, can establish buy a bill, when appear opposite circumstance closes a position, establish empty order at the same time. This is a simple rule, need each friend grope by oneself.
The VWAP indicator is our version of the popular Volume-Weighted Average Price indicator. The VWAP is the ratio between the value traded (price multiplied by the number of volume traded) and the total volume traded over a specific time period. As a result, it measures the average price of the instrument much better than the simple moving average. Although there are many ways to use the VWAP, most investors use it to calculate the daily average.  The indicator works in five modes: Moving  - In
Description The indicator uses market profile theory to show the most relevant trading zones, on a daily basis. The zones to be shown are LVN (low volume nodes) and POC (point of control). An LVN zone is one which represents price areas with the least time or volume throughout the day. Typically, these areas indicate a supply or demand initiative, and in the future, they can turn into important breakout or retracement zones. A POC zone is one which represents price areas with the most time or vo
This indicator provides an original mix of WPR, VSA, and volume delta. It shows ratio of buy/sell volumes scaled on 100% range based on total volume change for a selected period. The convetional VSA (Volume Spread Analysis) studies interconnections of price action and volume change in absolute values, whereas WPR (Williams Percent Range) offers a convenient approach of price moves normalization into the fixed percentage metric: 0 - 100%. Hence overbough and oversold states are easily spotted. N
IceFX VelocityMeter Mini is a very unique indicator on MetaTrader 4 platform which measures the speed of the Forex market . It is not a normal volume or other measurement indicator because IceFX VelocityMeter Mini is capable to understand market speed movements which are hidden in ticks and those valuable information cannot be read in an ordinary way from the candles. The software monitors the received ticks (frequency, magnitude of change) within a specified time range, analyzes these info and
Weis Wave Result MT5
Sant Clear Ali Costa
Features 3 types of waves: bullish, bearish and unknown. The unknown tower comes when prices move in opposite the direction of the current tower. Label that shows the percentage remaining for the next tower. Allows you set the type of volume that will be accumulated in the towers, either real or tick volumes. Thus, the indicator works in any market, for example: stocks, futures, forex, commodities, etc. Allows you to set the required score for the tower exchange. Allows you to set the font size
Dieser Indikator verwendet die sogenannten "bösen" Zahlen als Gewichtskoeffizienten. Ihr Gegenteil sind "abscheuliche" Zahlen, die auch in diesem Indikator dargestellt werden. Die Unterteilung von Zahlen in diese beiden Klassen ist mit dem Hamming-Gewicht verbunden, das durch die Anzahl der Einheiten in der binären Schreibweise einer bestimmten Zahl bestimmt wird. Die Verwendung dieser Zahlen als Gewichtungsfaktoren ergibt einen Trendfolgeindikator. Darüber hinaus geben abscheuliche Zahlen eine
Volumengewichteter MACD Der volumengewichtete MACD (VW-MACD) wurde von Buff Dormeier erstellt und in seinem Buch Investieren mit Volumenanalyse beschrieben. Er repräsentiert die Konvergenz und Divergenz volumengewichteter Preistrends. Durch die Einbeziehung des Volumens ist der VW-MACD im Allgemeinen reaktionsschneller und zuverlässiger als der traditionelle MACD.   Was ist MACD (Moving Average Convergence Divergence)? Moving Average Convergence Divergence wurde 1979 von Gerald Appel en
Käufer dieses Produkts erwarben auch
Atomic Analyst MT5
Issam Kassas
3.64 (11)
Zunächst einmal ist es erwähnenswert, dass dieser Handelsindikator nicht neu malt, nicht neu zeichnet und keine Verzögerung aufweist, was ihn sowohl für manuellen als auch für Roboterhandel ideal macht. Der Atom-Analyst ist ein PA-Preisaktionsindikator, der die Stärke und das Momentum des Preises nutzt, um einen besseren Vorteil auf dem Markt zu finden. Ausgestattet mit fortschrittlichen Filtern, die helfen, Rauschen und falsche Signale zu entfernen, und das Handelspotenzial zu erhöhen. Durch
Zunächst einmal ist es wichtig zu betonen, dass dieses Handelssystem ein Nicht-Repainting-, Nicht-Redrawing- und Nicht-Verzögerungsindikator ist, was es sowohl für manuelles als auch für automatisches Trading ideal macht. Das "Smart Trend Trading System MT5" ist eine umfassende Handelslösung, die für neue und erfahrene Trader maßgeschneidert ist. Es kombiniert über 10 Premium-Indikatoren und bietet mehr als 7 robuste Handelsstrategien, was es zu einer vielseitigen Wahl für verschiedene Marktbe
Quantum Trend Sniper
Bogdan Ion Puscasu
5 (37)
Wir stellen vor       Quantum Trend Sniper Indicator   , der bahnbrechende MQL5-Indikator, der die Art und Weise, wie Sie Trendumkehrungen erkennen und handeln, verändert! Entwickelt von einem Team erfahrener Händler mit über 13 Jahren Handelserfahrung,       Quantum Trend Sniper-Indikator       wurde entwickelt, um Ihre Trading-Reise mit seiner innovativen Methode zur Identifizierung von Trendumkehrungen mit extrem hoher Genauigkeit auf ein neues Niveau zu heben. ***Kaufe Quantum Trend Snipe
Trend Screener Pro MT5
STE S.S.COMPANY
4.89 (61)
Nutzen Sie die Macht des Trendhandels mit Trend Screener Indicator: Ihrer ultimativen Trendhandelslösung, die auf Fuzzy-Logik und einem System mit mehreren Währungen basiert! Steigern Sie Ihren Trendhandel mit Trend Screener, dem revolutionären Trendindikator mit Fuzzy-Logik. Es handelt sich um einen leistungsstarken Trendfolgeindikator, der über 13 Premium-Tools und -Funktionen sowie 3 Handelsstrategien kombiniert und ihn zu einer vielseitigen Wahl macht, um Ihren Metatrader in einen Trendanaly
RelicusRoad Pro MT5
Relicus LLC
4.81 (21)
Jetzt 147 US -Dollar (nach ein paar Aktualisierungen auf 499 US -Dollar) - Unbegrenzte Konten (PCs oder MACs) RelicusRoad Benutzerhandbuch + Schulungsvideos + Zugang zur privaten Discord-Gruppe + VIP-Status EINE NEUE ART, DEN MARKT ZU BETRACHTEN RelicusRoad ist der weltweit leistungsstärkste Handelsindikator für Forex, Futures, Kryptowährungen, Aktien und Indizes und gibt Händlern alle Informationen und Tools, die sie benötigen, um profitabel zu bleiben. Wir bieten technische Analysen un
FX Volume MT5
Daniel Stein
4.94 (17)
Erhalten Sie Ihr tägliches Marktupdate mit Details und Screenshots über unser Morning Briefing hier auf mql5 und auf Telegram ! FX Volume ist der ERSTE und EINZIGE Volumenindikator, der einen ECHTEN Einblick in die Marktstimmung aus Sicht eines Brokers bietet. Es bietet fantastische Einblicke in die Positionierung von institutionellen Marktteilnehmern, wie z.B. Brokern, auf dem Forex-Markt, viel schneller als COT-Berichte. Diese Informationen direkt auf Ihrem Chart zu sehen, ist der wahre Game
FX Power MT5 NG
Daniel Stein
5 (4)
Erhalten Sie Ihr tägliches Marktupdate mit Details und Screenshots über unser Morning Briefing hier auf mql5 und auf Telegram ! FX Power MT5 NG ist die nächste Generation unseres langjährig sehr beliebten Währungsstärkemessers FX Power. Und was bietet dieser Stärkezähler der nächsten Generation? Alles, was Sie am ursprünglichen FX Power geliebt haben PLUS GOLD/XAU-Stärkeanalyse Noch präzisere Berechnungsergebnisse Individuell konfigurierbare Analysezeiträume Anpassbares Berechnungslimit für noc
Zunächst einmal ist es wichtig zu betonen, dass dieses Handelstool ein Nicht-Repaint-, Nicht-Redraw- und Nicht-Verzögerungsindikator ist, was es ideal für professionelles Trading macht. Der Smart Price Action Concepts Indikator ist ein sehr leistungsstarkes Werkzeug sowohl für neue als auch erfahrene Händler. Er vereint mehr als 20 nützliche Indikatoren in einem und kombiniert fortgeschrittene Handelsideen wie die Analyse des Inner Circle Traders und Strategien des Smart Money Concepts. Diese
Advanced Supply Demand MT5
Bernhard Schweigert
4.53 (15)
Derzeit 33% Rabatt! Die beste Lösung für jeden Anfänger oder erfahrenen Händler! Dieser Indikator ist ein einzigartiges, qualitativ hochwertiges und erschwingliches Trading-Tool, da wir eine Reihe von proprietären Funktionen und eine neue Formel integriert haben. Mit diesem Update werden Sie in der Lage sein, doppelte Zeitrahmenzonen anzuzeigen. Sie können nicht nur einen höheren TF (Zeitrahmen) anzeigen, sondern sowohl den Chart-TF als auch den höheren TF: SHOWING NESTED ZONES. Alle Supply Dema
XQ Indicator MetaTrader 5
Marzena Maria Szmit
5 (1)
Step into the realm of Forex trading with confidence and precision using XQ, a cutting-edge Forex indicator designed to elevate your trading game to unprecedented heights. Whether you're a seasoned trader or just stepping into the world of currency exchange, XQ Forex Indicator empowers you with the insights and signals needed to make informed trading decisions. The signal conditions are a combination of three indicators, and XQ Forex Indicator only display  medium and long-term trends . The ind
AW Trend Predictor MT5
AW Trading Software Limited
4.76 (54)
Die Kombination von Trend- und Aufschlüsselungsebenen in einem System. Ein fortschrittlicher Indikatoralgorithmus filtert Marktrauschen, bestimmt den Trend, Einstiegspunkte sowie mögliche Ausstiegsniveaus. Indikatorsignale werden in einem Statistikmodul aufgezeichnet, das es Ihnen ermöglicht, die am besten geeigneten Tools auszuwählen, die die Wirksamkeit der Signalhistorie zeigen. Der Indikator berechnet Take-Profit- und Stop-Loss-Marken. Handbuch und Anleitung ->   HIER   / MT4-Version ->   H
Dies ist ein Indikator für MT5, der genaue Signale für den Einstieg in einen Handel ohne Repainting (Neuzeichnen) liefert. Er kann auf alle Finanzwerte angewendet werden: Forex, Kryptowährungen, Metalle, Aktien, Indizes. Er liefert ziemlich genaue Schätzungen und sagt Ihnen, wann es am besten ist, eine Position zu eröffnen und zu schließen. Sehen Sie sich das Video (6:22) mit einem Beispiel für die Verarbeitung nur eines Signals an, das sich für den Indikator gelohnt hat! Die meisten Händler ver
Wir stellen vor       Quantum Breakout PRO   , der bahnbrechende MQL5-Indikator, der die Art und Weise, wie Sie mit Breakout-Zonen handeln, verändert! Entwickelt von einem Team erfahrener Händler mit über 13 Jahren Handelserfahrung,       Quantum Breakout PRO       ist darauf ausgelegt, Ihre Handelsreise mit seiner innovativen und dynamischen Breakout-Zone-Strategie auf ein neues Niveau zu heben. Der Quantum Breakout Indicator zeigt Ihnen Signalpfeile auf Breakout-Zonen mit 5 Gewinnzielzone
ICT, SMC, SMART MONEY CONCEPTS, SMART MONEY, Smart Money Concept, Support and Resistance, Trend Analysis, Price Action, Market Structure, Order Blocks, BOS/CHoCH,   Breaker Blocks ,  Momentum Shift,   Supply&Demand Zone/Order Blocks , Strong Imbalance,   HH/LL/HL/LH,    Fair Value Gap, FVG,  Premium  &   Discount   Zones, Fibonacci Retracement, OTE, Buy Side Liquidity, Sell Side Liquidity, BSL/SSL Taken, Equal Highs & Lows, MTF Dashboard, Multiple Time Frame, BigBar, HTF OB, HTF Market Structure
Auto Order Block with break of structure based on ICT and Smart Money Concepts Futures Break of Structure ( BoS )             Order block ( OB )            Higher time frame Order block / Point of Interest ( POI )    shown on current chart           Fair value Gap ( FVG ) / Imbalance   ,  MTF      ( Multi Time Frame )    Volume Imbalance     ,  MTF          vIMB Gap’s Equal High / Low’s     ,  MTF             EQH / EQL Liquidity               Current Day High / Low           HOD /
Werden Sie Breaker Trader und profitieren Sie von Änderungen der Marktstruktur, wenn sich der Preis umkehrt. Der Order Block Breaker Indikator zeigt an, wann sich eine Trend- oder Preisbewegung der Erschöpfung nähert und bereit ist, sich umzukehren. Es weist Sie auf Änderungen in der Marktstruktur hin, die normalerweise auftreten, wenn eine Umkehrung oder ein größerer Rückzug bevorsteht. Der Indikator verwendet eine proprietäre Berechnung, die Ausbrüche und Preisdynamik identifiziert. Jedes
TPSpro TRENDPRO  - is a trend indicator that automatically analyzes the market and provides information about the trend and each of its changes, as well as giving signals for entering trades without redrawing! The indicator uses each candle, analyzing them separately. referring to different impulses - up or down impulse. Exact entry points into transactions for currencies, crypto, metals, stocks, indices!  -  Version MT4                  DETAILED DESCRIPTION        /       TRADING SETUPS       
TrendMaestro5
Stefano Frisetti
note: this indicator is for METATRADER4, if you want the version for METATRADER5 this is the link:  https://www.mql5.com/it/market/product/108106 TRENDMAESTRO recognizes a new TREND in the bud, he never makes mistakes. The certainty of identifying a new TREND is priceless. DESCRIPTION TRENDMAESTRO identifies a new TREND in the bud, this indicator examines the volatility, volumes and momentum to identify the moment in which there is an explosion of one or more of these data and therefore the mome
Owl Smart Levels MT5
Sergey Ermolov
4.47 (36)
MT4-Version  |  FAQ Der Owl Smart Levels Indikator ist ein komplettes Handelssystem innerhalb eines Indikators, der so beliebte Marktanalysetools wie die fortschrittlichen Fraktale von Bill Williams , Valable ZigZag, das die richtige Wellenstruktur des Marktes aufbaut, und Fibonacci-Levels , die die genauen Einstiegslevels markieren, enthält in den Markt und Orte, um Gewinne mitzunehmen. Detaillierte Strategiebeschreibung Anleitung zur Verwendung des Indikators Berater-Assistent im Handel Owl H
Quantum Heiken Ashi PRO MT5
Bogdan Ion Puscasu
4.5 (8)
Wir stellen den   Quantum Heiken Ashi PRO   vor Die Heiken-Ashi-Kerzen wurden entwickelt, um klare Einblicke in Markttrends zu geben und sind bekannt für ihre Fähigkeit, Rauschen herauszufiltern und falsche Signale zu eliminieren. Verabschieden Sie sich von verwirrenden Preisschwankungen und begrüßen Sie eine glattere, zuverlässigere Diagrammdarstellung. Was den Quantum Heiken Ashi PRO wirklich einzigartig macht, ist seine innovative Formel, die traditionelle Candlestick-Daten in leicht lesbare
IX Power MT5
Daniel Stein
5 (2)
IX Power   bringt die unschlagbare Präzision von FX Power endlich auch zu Nicht-Forex-Symbolen. Es bestimmt präzise die Intensität von kurz-, mittel- und langfristigen Trends in Ihren Lieblingsindizes, Aktien, Rohstoffen, ETFs und sogar Kryptowährungen. Sie können   alles analysieren, was   Ihr Terminal zu bieten hat. Probieren Sie es aus und erleben Sie, wie   sich Ihr Timing   beim Handel   deutlich verbessert . IX Power Hauptmerkmale 100% präzise, nicht nachpinselnde Berechnungsergebni
TrendDecoder Premium MT5
Christophe, Pa Trouillas
5 (1)
Top bewertet auf anderem MarketPlace -  Jetzt verfügbar auf METATRADER Identifizieren Sie Bereiche und die nächsten wahrscheinlichen Bewegungen     |    Erhalten Sie früheste Signale und die Stärke von Trends     |    Klare Ausstiegssignale vor Umkehrung     |    Erkennen Sie die Fibo-Levels, die der Kurs testen wird    |  Indikator, der nicht zurückverfolgt, nicht verzögert - ideal für den manuellen und automatisierten Trading - geeignet für alle Vermögenswerte und Zeiteinheiten - 50% Rabatt  
Gartley Hunter Multi
Siarhei Vashchylka
5 (5)
Gartley Hunter Multi - An indicator for searching for harmonic patterns simultaneously on dozens of trading instruments and on all classic timeframes: (m1, m5, m15, m30, H1, H4, D1, Wk, Mn). Manual (Be sure to read before purchasing) | Version for MT4 Advantages 1. Patterns: Gartley, Butterfly, Shark, Crab. Bat, Alternate Bat, Deep Crab, Cypher 2. Simultaneous search for patterns on dozens of trading instruments and on all classic timeframes 3. Search for patterns of all possible sizes. Fr
TrendLine PRO MT5
Evgenii Aksenov
4.78 (49)
The Trend Line PRO indicator is an independent trading strategy. It shows the trend change, the entry point to the transaction, as well as automatically calculates three levels of Take Profit and Stop Loss protection Trend Line PRO is perfect for all Meta Trader symbols: currencies, metals, cryptocurrencies, stocks and indices Advantages of Trend Line PRO Never redraws its signals The possibility of using it as an independent strategy It has three automatic levels Take Profit and Stop Loss lev
Golden Spikes Detector
Batsirayi L Marango
5 (1)
Golden Spikes Detector This indicator is based on an advanced strategy primarily for trading spikes on Boom and Crash Indices. Complex algorithms were implemented to detect high probability entries only. It alerts on potential Buy and Sell entries. To trade spikes on the Deriv or Binary broker, only take Buy Boom and Sell Cash alerts. It was optimised to be loaded on 5-minute timeframe although multiple timeframe analysis is done in the background. Features ·             Desktop pop up and sound
Matrix Arrow Indicator MT5
Juvenille Emperor Limited
5 (14)
Matrix Arrow Indicator MT5   ist ein einzigartiger 10-in-1-Trend, der zu   100 % nicht neu gezeichnet   werden kann. Multi-Timeframe-Indikator, der für alle Symbole/Instrumente verwendet werden kann:   Forex ,   Rohstoffe ,   Kryptowährungen ,   Indizes ,   Aktien .  Der  Matrix Arrow Indicator MT5  wird den aktuellen Trend in seinen frühen Stadien bestimmen und Informationen und Daten von bis zu 10 Standardindikatoren sammeln, die sind: Durchschnittlicher Richtungsbewegungsindex (ADX) Rohstoff
Dark Power MT5
Marco Solito
4.84 (56)
Dark Power  is an Indicator for intraday trading. This Indicator is based on   Trend Following  strategy, also adopting the use of an histogram to determine the right power . We can enter in good price with this Indicator, in order to follow the   strong trend   on the current instrument. The histogram is calculated based on the size of the bars and two moving averages calculated on the histogram determine the direction of the signal Key benefits Easily visible take profit/stop loss lines Int
** All Symbols x All Timeframes scan just by pressing scanner button ** ***Contact me after purchase to send you instructions and add you in "123 scanner group" for sharing or seeing experiences with other users. After 15 years of experience in the markets and 3 years of programming, Winner indicator is ready. I would like to share with you! Introduction The 123 Pattern Scanner indicator with a special enhanced algorithm is a very repetitive common pattern finder with a high success rate . Inte
The Smart Liquidity Profile is color-coded based on the importance of the traded activity at specific price levels, allowing traders to identify significant price levels such as support and resistance levels, supply and demand zones, liquidity gaps, consolidation zones, Buy-Side/Sell-Side Liquidity and so on.  Smart Liquidity Profile allows users to choose from a number of different time periods including 'Auto,' 'Fixed Range,' 'Swing High,' 'Swing Low,' 'Session,' 'Day,' 'Week,' 'Month,' 'Quart
Golden Gate Algo MT5
James David Lane
4 (6)
40% RABATT ZU WEIHNACHTEN! PREISERHÖHUNG AUF $250 AM 1. JANUAR! Vorstellung von GoldenGate Entries: Eine hochmoderne Handelslösung! Entdecken Sie einen revolutionären Ansatz zum Handel mit GoldenGate Entries (GGE), einem fortschrittlichen Indikator, der entwickelt wurde, um Ihr Handelserlebnis zu verbessern. GGE bietet eine umfassende Palette von Funktionen, um Benutzer mit Präzision und Vertrauen in ihren Handelsentscheidungen auszustatten. Paare: Beliebig (FX - Rohstoffe - Aktien - Akti
Weitere Produkte dieses Autors
"All MAs-13 jm" is a tool that allows accessing from a single control box 13 different types of MAs: 9 standard MAs in MetaTrader 5 (SMA, EMA, SMMA, LWMA, DEMA, TEMA, Frama, VIDYA, AMA ) and 4 non-standard (LRMA, HMA, JMA, SAYS) copyrights to which belong to Nikolay Kositsin (Godzilla), they can be found on the web (e.g. LRMA ). General Parameters Period MA: the number of bars to calculate the moving average. MA Method: select the type of moving average to show in the current graph. Applied Pric
Is the market volatile today? More than yesterday? EURUSD is volatile? More than GBPUSD? We need an indicator that allows us to these responses and make comparisons between pairs or between different timeframes. This indicator facilitates this task. Reports the normalized ATR as three modes; It has a line that smooths the main signal; The normalization of values occurs within a defined interval by user (34 default bars); The user can also define any symbol and timeframe to calculate and to make
"MA Angle 13 types" is an indicator that   informs of the inclination angle of the moving average curve that is displayed on the screen. It allows selecting the MA method to use. You can also select the period, the price and the number of bars the angle is calculated for. In addition, "factorVisual" parameter adjusts the information about the MA curve angle displayed on this screen. The angle is calculated from your tangent (price change per minute). You can select up to 13 types of MA, 9 standa
Chaikin Money Flow
Jose Miguel Soriano
This indicator incorporates the volume to inform the market trend. A warning system (chart, SMS and e-mail) is incorporated for warning when a certain level is exceeded. Developed by Marc Chaikin, Chaikin Money Flow (CMF) measures the amount of Money Flow Volume (MFV) over a specific period. Money Flow Volume forms the basis for the Accumulation Distribution Line. Instead of a cumulative total of Money Flow Volume, Chaikin Money Flow simply sums Money Flow Volume for a specific look-back period.
CCI normalized
Jose Miguel Soriano
Commodity Channel Index Technical Indicator (CCI) measures the deviation of the commodity price from its average statistical price. High values of the index point out that the price is unusually high being compared with the average one, and low values show that the price is too low. In spite of its name, the Commodity Channel Index can be applied for any financial instrument, and not only for the wares. There are two basic techniques of using Commodity Channel Index: Finding the divergences. Th
R2 oscilator
Jose Miguel Soriano
R2 (R-squared) represents the square of the correlation coefficient between current prices and deducted from the linear regression. It is the statistical measure of how well the regression line is  adjusted to the actual data, and therefore it measures the strength of the prevailing trend without distinguishing between ascending and descending one. The R2 value varies between 0 and 1, therefore it is an oscillator of bands that can show signs of saturation (overbought / oversold). The more the v
If instead of giving the regression value indicator end of the regression line (LRMA), we give the value of its slope, we obtain LRS or Linear Regression Slope Indicator. Since the slope is positive when prices rise, zero when they are in range and negative when they are lowered, LRS provides us the data on the price trend. Calculation                       sum(XY, n) - avg(Y, n)*sum(X, n)   Y= a + mX;      m=  --------------------------------        a= avg(Y, n) - m*avg(X, n)                   
"ATR channel all MAs jm" is a indicator that allows displaying on a chart the ATR channel calculated according to the moving average selected. You can select 9 standard MAs available in MetaTrader 5 - SMA, EMA, SMMA, LWMA, DEMA, TEMA, Frama, VIDYA, AMA, TRIX, and 4 non-standard - LRMA, HMA, JMA, AFIRMA. General Parameters: Channel type - true: channel ATR, false: channel price. Method MA - select the type of moving average to show in the current graph. Period MA - the number of bars to calcula
"Bollinger Bands all MAs" is an indicator that allows drawing Bollinger Bands calculated according to the selected moving average. You can select 9 standard MAs available in MetaTrader 5 - SMA, EMA, SMMA, LWMA, DEMA, TEMA, Frama, VIDYA, AMA, TRIX, and 4 non-standard ones - LRMA, HMA, JMA, AFIRMA. General Parameters Method MA - select the type of moving average to be displayed in the current graph. Period MA - the number of bars to calculate the MA. Width bands - the width of the bands expresse
Normalized OBV
Jose Miguel Soriano
When looking at the information of On Balance Volume indicator, a question arises: is it a strong or weak movement? Should it be compared with previous days? These data should be normalized to always have a reference. This indicator presents the followings parameters: Normalization period (Max-Mins absolute) Smoothing period (-1 off) Tick/Real Volume Maximum number of bars to calculate (-1 off) Upper value normalization Lower value normalization Calculation: normOBV = (value - absMin) * (relMa
Auswahl:
Keine Bewertungen
Antwort auf eine Rezension
Version 2.10 2022.01.23
version 5 build 3146
13-ene-2022