CCI normalized
- Indikatoren
-
Jose Miguel Soriano
 Financial Manager (real estate sector)
Management Computing degree (University of Almeria) - Version: 2.10
- Aktualisiert: 23 Januar 2022
- Aktivierungen: 5
Der technische Indikator Commodity Channel Index (CCI) misst die Abweichung des Rohstoffpreises von seinem statistischen Durchschnittspreis. Hohe Werte des Index weisen darauf hin, dass der Preis im Vergleich zum Durchschnittspreis ungewöhnlich hoch ist, und niedrige Werte zeigen, dass der Preis zu niedrig ist. Trotz seines Namens kann der Commodity Channel Index für jedes Finanzinstrument angewendet werden, nicht nur für Waren.
Es gibt zwei grundlegende Techniken zur Verwendung des Commodity Channel Index:
- Das Auffinden der Divergenzen.
Die Divergenz tritt auf, wenn der Preis ein neues Maximum erreicht und der Commodity Channel Index nicht über die vorherigen Maxima hinauswachsen kann. Auf diese klassische Divergenz folgt normalerweise eine Kurskorrektur. - Als Indikator für Überkäufe/Überverkäufe.
Der Commodity Channel Index schwankt in der Regel in einem Bereich von ±100. Werte über +100 informieren über den Zustand der Überkäufe (und über die Wahrscheinlichkeit eines korrigierenden Rückgangs), und die Werte unter 100 informieren über den Zustand der Überverkäufe (und über die Wahrscheinlichkeit eines korrigierenden Anstiegs).
Berechnung
D = Price - SMA (TP, N)
SMA (D, N) = SUM (D, N) / N Simple Moving Average
M = SMA (D, N) * 0,015
CCI = M / D
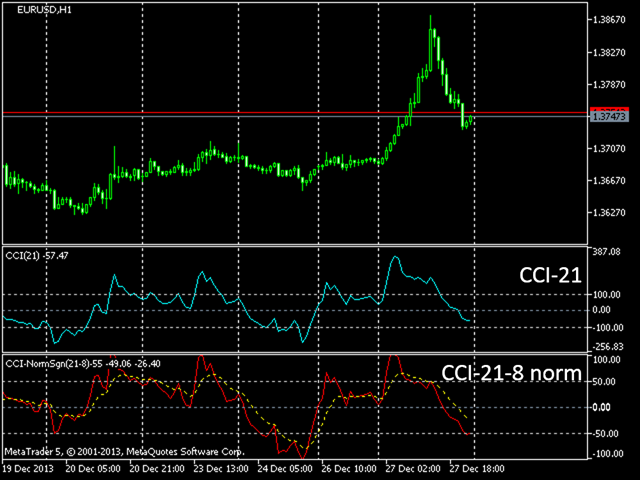
Der CCI ist kein Indikator, der sich zwischen festen Werten bewegt, was den Vergleich zwischen verschiedenen Märkten oder Zeiträumen erschwert.
Um dieses Problem zu lösen, normalisieren wir die Werte innerhalb eines bestimmten Intervalls.
CCInorm= (CCIreal-CCImin)*(relMax-relMin)/(CCImax-CCImin) + relMin
Allgemeine Parameter
- Symbol: Legen Sie ein anderes grafisches Symbol fest, um z. B. das Korrelationsverhalten zu untersuchen.
- CCI-Zeitraum: Die Anzahl der Balken zur Berechnung des CCI.
- Normalisierungszeitraum: Zeitintervall, über das die Normalisierungswerte berechnet werden.
- Periodenglättung: Zeitraum zur Berechnung der Signallinie (EMA).
- Zeitrahmen: Bietet die Darstellung der ATR in verschiedenen Rahmen des Diagramms.
- Maximales Niveau: Maximales Niveau des normalisierten CCI (standardmäßig 100).
Vorteile
- Zeigt das Niveau der Volatilität relativ an: mehr als gestern, weniger als vor einem Monat usw.
- Erleichtert die Untersuchung der Volatilität im Vergleich zwischen verschiedenen Paaren.
- Zeigt den Grad der Korrelation zwischen verschiedenen Paaren visuell an.