ATR channel all MAs
- Indikatoren
-
Jose Miguel Soriano
 Financial Manager (real estate sector)
Management Computing degree (University of Almeria) - Version: 2.10
- Aktualisiert: 22 Januar 2022
- Aktivierungen: 5
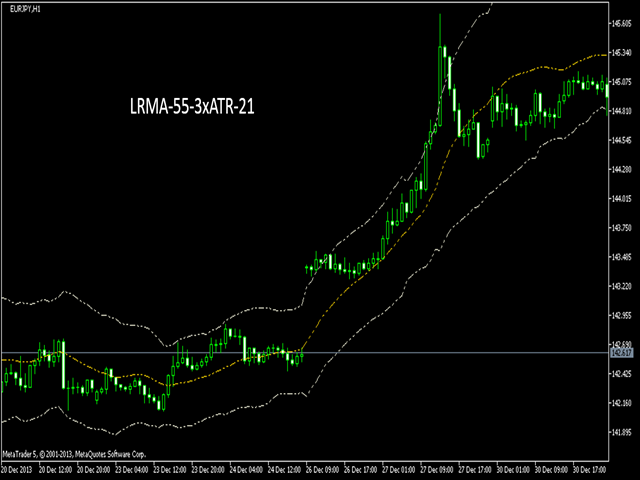
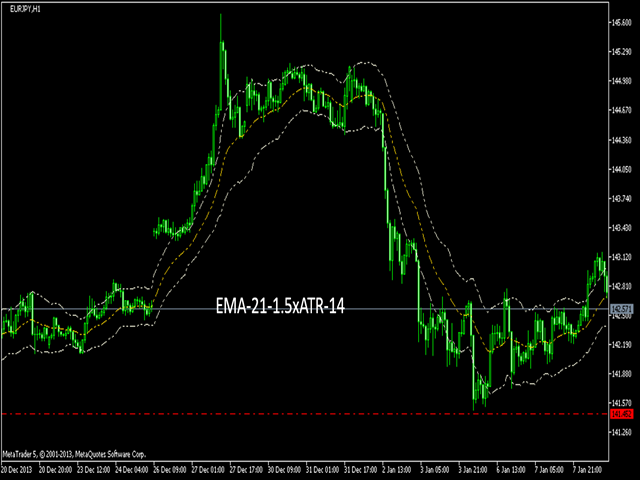
"ATR channel all MAs jm" ist ein Indikator, der es ermöglicht, auf einem Chart den ATR-Kanal anzuzeigen, der anhand des ausgewählten gleitenden Durchschnitts berechnet wurde.
Sie können 9 Standard-MAs auswählen, die in MetaTrader 5 verfügbar sind - SMA, EMA, SMMA, LWMA, DEMA, TEMA, Frama, VIDYA, AMA, TRIX, und 4 Nicht-Standard-MAs - LRMA, HMA, JMA, AFIRMA.
Allgemeine Parameter:
- Kanaltyp - wahr: Kanal ATR, falsch: Kanal Preis.
- Methode MA - wählen Sie den Typ des gleitenden Durchschnitts, der im aktuellen Diagramm angezeigt werden soll.
- Periode MA - die Anzahl der Balken zur Berechnung des MA.
- Periode ATR - Periode für die Berechnung des ATR.
- Kanalbreite - die Breite des Kanals, ausgedrückt in Vielfachen der ATR.
- Angewandter Preis - Auswahl des Preistyps (Schlusskurs, Höchstkurs, Tiefstkurs ...).
Vorteile der Anwendung:
Manuelle Trader: Es verfügt über ein "Mehrzweckmesser", das die Analyse von Trends und Ausbrüchen über ein einziges Kontrollfeld im Chart erleichtert.
Automatische Trader: Sie können die Art des MA als weiteren Parameter des EA optimieren, indem sie einfach "Method MA" als externen Parameter einfügen. Eine Strategie kann mit BB EMA nicht gut funktionieren, aber mit BB VIDYA oder AMA profitabel sein. Wenn Sie EAs entwerfen, sollten Sie in Ihrem Code die Aufzählung vorsehen: {SMA=0,EMA=1,SMMA=2,LWMA=3,DEMA=4,TEMA=5,FRAMA=6,VIDYA=7,AMA=8,LRMA=9,HMA=10,JMA=11,AFIRMA=12}.