MACD BBands
- Indikatoren
-
Dmitriy Moshnin
 Торговать нужно так, чтобы не было мучительно больно за бесцельно вложенные деньги...
 - Version: 1.0
- Aktivierungen: 5
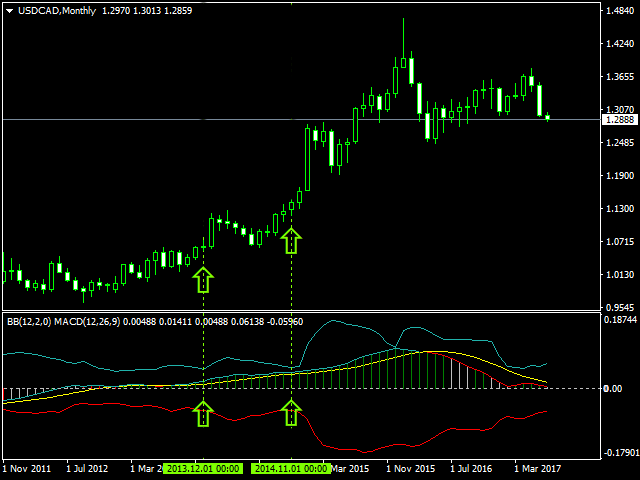
MACD BBands ist ein Handelssystem, das auf MACD und Bollinger Bands in einem einzigen Fenster basiert. Der Indikator zeigt die Veränderung des Neigungswinkels des gleitenden Durchschnitts (Trend) an, vergleicht ihr Verhältnis (Konvergenz/Divergenz) und ermöglicht das Aussortieren von Signalen mithilfe von Bollinger Bands. Die Indikatoren sind so kalibriert, dass die mittlere Bollinger-Band-Linie dem Nullniveau des MACD-Indikators entspricht.
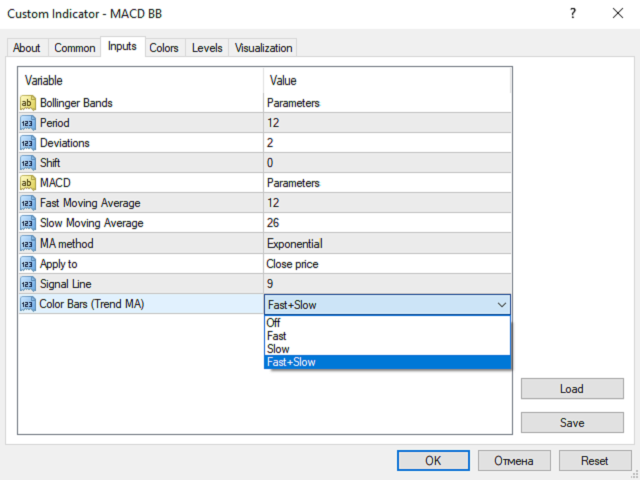
Parameter
- Zeitraum - Zeitraum der Bollinger Bänder;
- Abweichungen - Anzahl der Standardabweichungen;
- Verschiebung - Verschiebung relativ zum Preis;
- Schneller gleitender Durchschnitt - Periode des schnellen gleitenden Durchschnitts;
- Langsamer gleitender Durchschnitt - Periode des langsamen gleitenden Durchschnitts;
- MA-Methode - Mittelungsmethode der gleitenden Durchschnitte (einfache Mittelung, exponentiell, geglättet und linear gewichtet);
- Anwenden auf - angewandter Preis der gleitenden Durchschnitte (Close, Open, High für die Periode, Low für die Periode, Median, Typical und Linear-Weighted);
- Signallinie - Periode der Signallinie;
- Farbige Balken (Trend MA) - Änderung der Farbe der Indikatorbalken bei Änderung der Neigungswinkel des schnellen und (oder) langsamen gleitenden Durchschnitts.
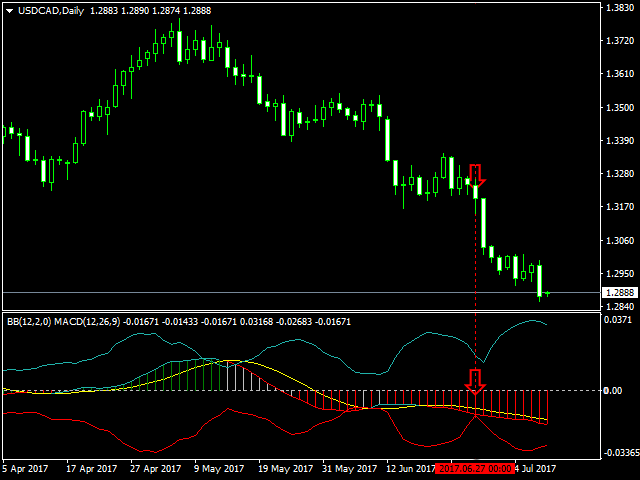
Eine Kante von Balken, die in Übereinstimmung mit einem Trend und der Farbe des MACD-Histogramms während der Verengung der Bollinger-Bänder gefärbt ist, wird als Markteinstiegs- bzw. Ausstiegssignal verwendet. Die Farbe des MACD-Histogramms kann im Eigenschaftsfenster des Indikators angepasst werden - die Neigungswinkel des Fast Moving Average oder Slow Moving Average im Hauptfenster des aktuellen Charts ändern sich einzeln oder beide zusammen.

Der Benutzer hat keinen Kommentar hinterlassen