RSI TrendLine Divergency Message
- Indikatoren
-
Dmitriy Moshnin
 Торговать нужно так, чтобы не было мучительно больно за бесцельно вложенные деньги...
 - Version: 3.1
- Aktualisiert: 17 November 2021
- Aktivierungen: 5
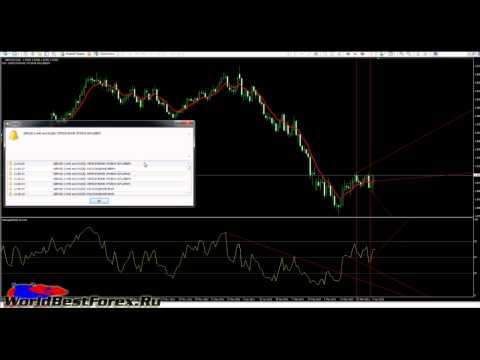
RSI TrendLine Divergency Message ist ein Indikator für die Handelsplattform MetaTrader 4. Im Gegensatz zum Originalindikator verfügt diese Version über ein System von Warnungen, die über Veränderungen der Marktsituation informieren. Es besteht aus den folgenden Signalen:
- wenn die Hauptlinie die Niveaus der Extremzonen und das 50%-Niveau kreuzt;
- wenn die Hauptlinie die Trendlinie im Indikatorfenster kreuzt;
- Divergenz auf dem letzten Balken.
Die Parameter der Niveaus der Extremzonen, des 50-Niveaus und der Divergenz sind einstellbar.
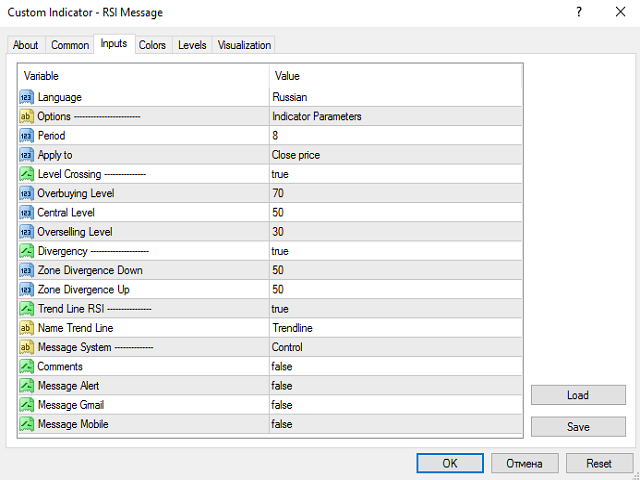
Parameter
- Sprache - wählen Sie die Sprache: Englisch oder Russisch;
- Optionen - Einstellungen des Indikators: Auswahl der RSI-Mittelungsperiode nach dem angewandten Preis: Schluss, Eröffnung, Hoch, Tief, Median, typisch, gewichteter Durchschnitt;
- Level Сrossing - aktivieren/deaktivieren Sie die Warnungen, wenn die RSI-Linie das überkaufte, überverkaufte und mediane Niveau überschreitet;
- Divergency - aktivieren/deaktivieren Sie die Benachrichtigung, wenn der Preis des Hauptfensters vom Preis des Indikatorfensters im letzten Balken abweicht;
- Trendlinie RSI - aktiviert/deaktiviert Benachrichtigungen, wenn die RSI-Linie die Trendlinie im Indikatorfenster kreuzt. Sie sollten die Trendlinie einzeichnen und den Namen Trendlinie in den Indikatoreigenschaften entsprechend umbenennen;
- Meldungssystem - Meldungssystem.
Signale werden als Kommentare im Hauptfenster des Charts, als Warnungen, Push-Benachrichtigungen, die an das auf Ihrem mobilen Gerät installierte mobile Terminal gesendet werden, oder als E-Mail-Nachrichten angezeigt. Der Vorteil des Indikators besteht darin, dass Sie die Signale von Ihrem PC aus (auf Ihrem mobilen Gerät) empfangen und verfolgen können, so dass Sie das Öffnen und Schließen von Positionen kontrollieren können.
Viel Spaß beim Handeln!
Der Benutzer hat keinen Kommentar hinterlassen