Profit Factor
- Indikatoren
-
Dmitriy Moshnin
 Торговать нужно так, чтобы не было мучительно больно за бесцельно вложенные деньги...
 - Version: 1.2
- Aktualisiert: 17 November 2021
- Aktivierungen: 5
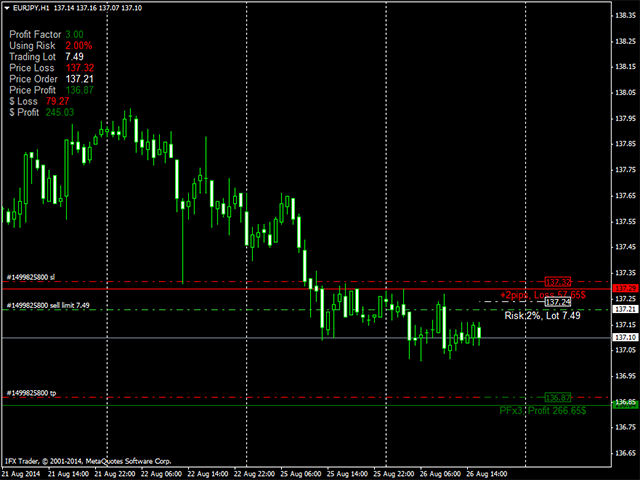
Der Profit Factor Indikator berechnet einen der drei Parameter: 1 - das Niveau des Markteintritts (im Parameter "Berechne den" - Market Open Trade), 2 - das Niveau des Stop Loss (Berechne den - Market Price Loss), 3 - das Niveau des Take Profit (Berechne den - Market Price Profit) - mit einem gewünschten Gewinn/Verlust-Verhältnis (Profit Factor), sowie die Losgröße (Handelsvolumen) entsprechend dem Wert des Risikoprozentsatzes der verfügbaren Mittel, der in den Einstellungen angegeben ist (ein einfacheres Analogon ist der Indikator Lot Calculation ). Der Indikator bietet ein eingebautes System der Benachrichtigung über das Erreichen der Niveaus von Stop Loss (rote horizontale Linie), Take Profit (grüne horizontale Linie) und des Preises der offenen Order (weiße horizontale Linie) durch den Marktpreis.
Parameter
- Sprache Russisch - wählen Sie die Sprache aus: Russisch/Englisch;
- Gewinnfaktor - Gewinn/Verlust-Verhältnis entsprechend der Strategie (beliebiger Wert... 2/1, 2.5/1, 3/1, etc.);
- Prozentuales Risiko - prozentualer Wert der verfügbaren Mittel für die Berechnung der Losgröße;
- Berechnen - Auswahl des Betriebsmodus des Indikators, Berechnung des Niveaus der Positionseröffnung auf der Grundlage des Marktpreisgewinns und des Marktpreisverlusts, oder Berechnung des Niveaus des Zielgewinns auf der Grundlage der festgelegten Preise des offenen Handels und des Marktpreisverlusts, oder Berechnung des Niveaus des Stop Loss auf der Grundlage des festgelegten Preises des offenen Handels und des Marktpreisgewinns.
- Market Price Profit - Take Profit, Marktpreis; wenn der Wert gleich Null ist, wird das Level durch Ziehen der horizontalen Linie des Levels Take Profit im Chartfenster mit der Maus festgelegt;
- Market Open Trade - Positionseröffnung; wenn der Wert gleich Null ist, wird das Niveau durch Ziehen der horizontalen Linie von Level Open Trade im Chart-Fenster mit der Maus festgelegt;
- Market Price Loss - Stop Loss, Marktpreis; wenn der Wert gleich Null ist, wird das Niveau durch Ziehen der horizontalen Linie von Level Stop Loss im Chart-Fenster mit der Maus festgelegt;
- Stop Loss hinzufügen (Pips) - Wert in Pips, der zum Stop-Loss-Preis hinzugefügt wird, wenn der Marktpreisverlust nicht gleich Null ist.
- ASK-Linie - Hinzufügen/Löschen der ASK-Linie.
Anwendung
Definieren Sie zunächst Ihre Ziele, z.B. Take Profit und Stop Loss, und geben Sie diese Daten in die Felder der Indikatoren Market Price Profit und Market Price Loss ein. Der Stop Loss kann mit einem kleinen AddStopLoss (Pips) festgelegt werden. Mit dem folgenden Tick zeichnet der Indikator die ASK-Linien und das horizontale Niveau der Positionseröffnung in Form des Gewinn/Verlust-Verhältnisses und berechnet das Handelsvolumen (wenn die Margin nicht ausreicht, wird die Berechnung für das Mindestlot durchgeführt) und den möglichen Gewinn und Verlust in der Einzahlungswährung.
Berechnetes Level Open Trade Level (weiß) ist ein Positionseröffnungslevel (oder Stop/Limit-Einstellungslevel), unter dem das geschätzte Handelsvolumen angezeigt wird. Wenn Marktpreisgewinn und Marktpreisverlust leer gelassen werden , berechnet der Indikator den Wert zwischen den horizontalen Linien, die mit der Maus im Chartfenster gezogen werden.
Die Berechnungsdaten werden in der oberen linken Ecke des Hauptfensters angezeigt. Beachten Sie, dass der Indikator den Spread des ausgewählten Symbols berücksichtigt. Stop Loss und Take Profit für Verkaufspositionen werden auf die ASK-Linie des Indikators gesetzt, Line ASK SL und Line ASK TP.
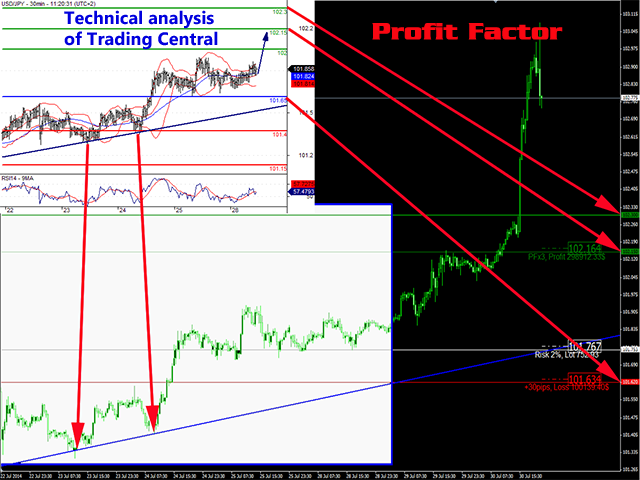
Wenn Sie nicht über genügend Erfahrung verfügen, können Sie die technische Analyse von Trading Central nutzen (der Indikator wurde für die Prognosen von Trading Central entwickelt) - dem Marktführer der globalen Analytik.
- Der Stop Loss wird nach der blauen Prognoselinie oder nach dem nächstgelegenen entgegengesetzten Niveau mit einer kleinen (Add Stop Loss (Pips)) Zulage bei der Line ASK SL des Indikators für eine Verkaufsposition und Level Stop Loss für eine Kaufposition gesetzt;
- Der Take Profit wird auf die Linie ASK TP des Indikators für eine Verkaufsposition und auf das Niveau Take Profit für eine Kaufposition gesetzt.
- In diesem Fall wird eine schwebende Order mit einem Berechnungslot auf der Linie des Levels Open Trade platziert.
Eröffnen Sie drei Positionen zu verschiedenen Symbolen durch Pending Orders mit einem Gewinn/Verlust-Verhältnis von 1/3. Folgen Sie der Prognose, die alle zwei Stunden aktualisiert wird. Die Rechnung ist einfach: Wenn Sie das maximale Risiko von 2% der Einlage verwenden, erhöhen Sie Ihre Einlage um 18%, wenn drei Gewinne erreicht werden. Wenn alle drei Positionen Verluste machen (was sehr selten vorkommt), verringern Sie Ihre Einlage um 6%. Wenn zwei Positionen gewinnbringend sind, während eine verlustbringend ist: 6%+6%-2%=10% des Gewinns. Eine gewinnbringende und zwei verlustbringende Positionen: +6%-2%-2%=+2%. Und so weiter.
Löschen Sie unbenutzte Orders, wenn der Preis die Gewinnstufe erreicht hat oder sich die Symbolprognose geändert hat. Wenn der Kurs das Level Open Trade erreicht, können Sie eine Order zum Marktpreis eröffnen. Dies kann über ein Mobiltelefon verfolgt werden, indem Sie die Benachrichtigungsfunktion aktivieren. Schicken Sie mir eine private Nachricht, wenn Sie an Trading Central Unternehmensprognosen interessiert sind. Meine Kontakte sind im Profil zu finden.
Viel Glück beim Trading!