MACD BBands
- Indicadores
-
Dmitriy Moshnin
 Торговать нужно так, чтобы не было мучительно больно за бесцельно вложенные деньги...
 - Versión: 1.0
- Activaciones: 5
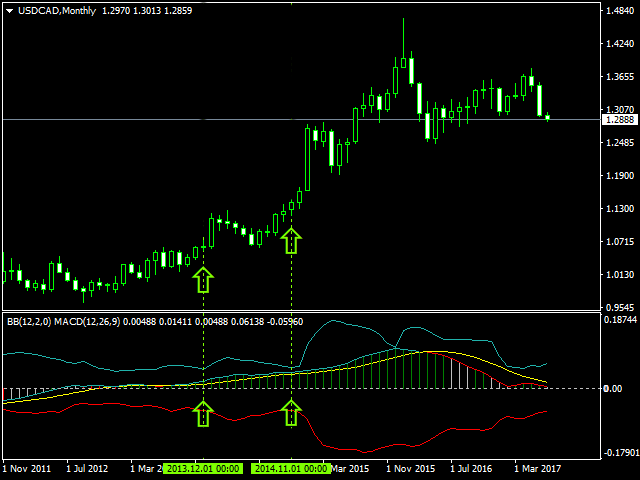
MACD BBands es un sistema de trading basado en MACD y Bandas de Bollinger colocadas en una única ventana. El indicador muestra el cambio del ángulo de inclinación de la media móvil (tendencia), compara su relación (convergencia/divergencia) y permite clasificar las señales utilizando las Bandas de Bollinger. Los indicadores están calibrados de tal manera que la línea media de las Bandas de Bollinger es el nivel cero del indicador MACD.
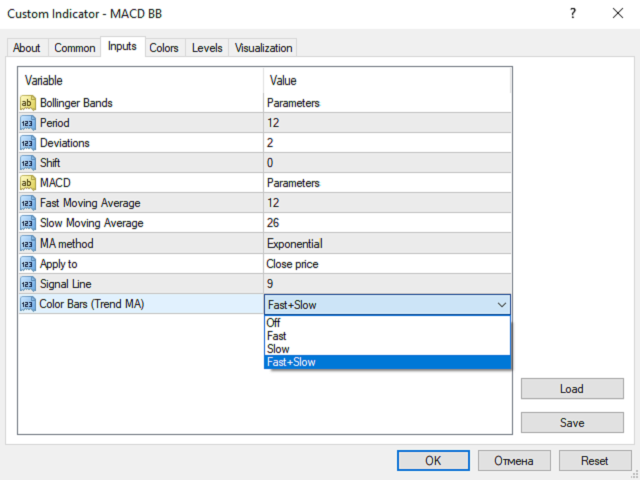
Parámetros
- Período - período de las Bandas de Bollinger;
- Desviaciones - número de desviaciones estándar;
- Desplazamiento - desplazamiento relativo al precio;
- Media móvil rápida - período de la media móvil rápida;
- Media móvillenta - período de la media móvil lenta;
- Método MA - método de promediación de las medias móviles (promediación simple, exponencial, suavizada y lineal ponderada);
- Aplicar a - precio aplicado de las medias móviles (Cierre, Apertura, Máximo del período, Mínimo del período, Mediana, Típica y Ponderada lineal);
- Línea de señal - período de la línea de señal;
- Color Bars (Trend MA) - cambiar el color de las barras del indicador al cambiar los ángulos de inclinación de la Media Móvil Rápida y (o) Lenta.
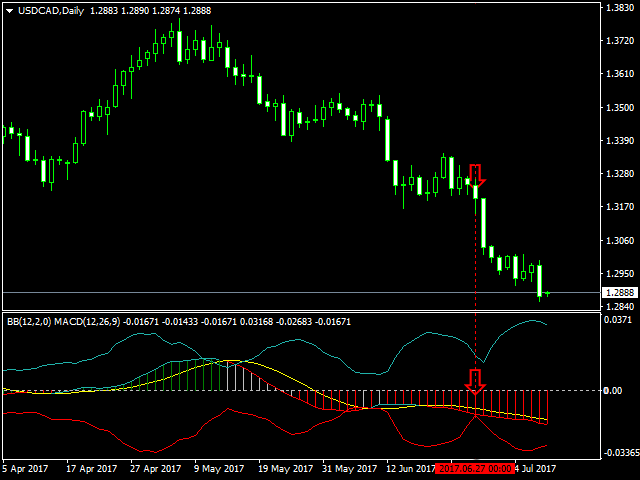
Un borde de barras de color de acuerdo con una tendencia y el color del histograma MACD durante el estrechamiento de las Bandas de Bollinger se utilizan como una señal de entrada/salida del mercado. El color del histograma MACD se puede personalizar en la ventana de propiedades del indicador - los ángulos de pendiente de la Media Móvil Rápida o Media Móvil Lenta en la ventana principal del gráfico actual cambian individualmente o ambos juntos.

El usuario no ha dejado ningún comentario para su valoración