Parabolic Converter
- Indikatoren
-
Dmitriy Moshnin
 Торговать нужно так, чтобы не было мучительно больно за бесцельно вложенные деньги...
 - Version: 1.3
- Aktualisiert: 23 Oktober 2021
- Aktivierungen: 5
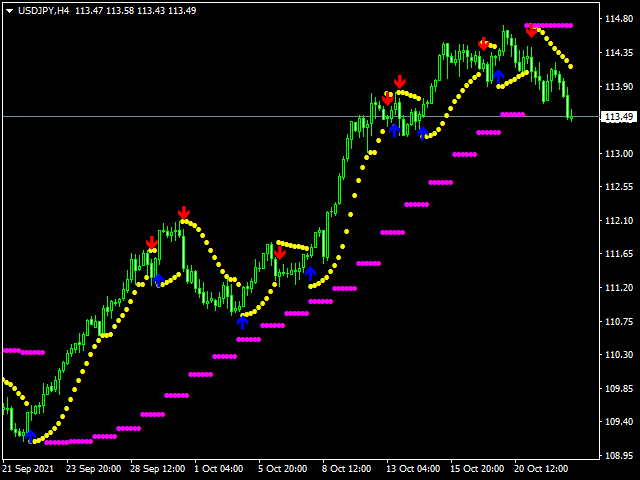
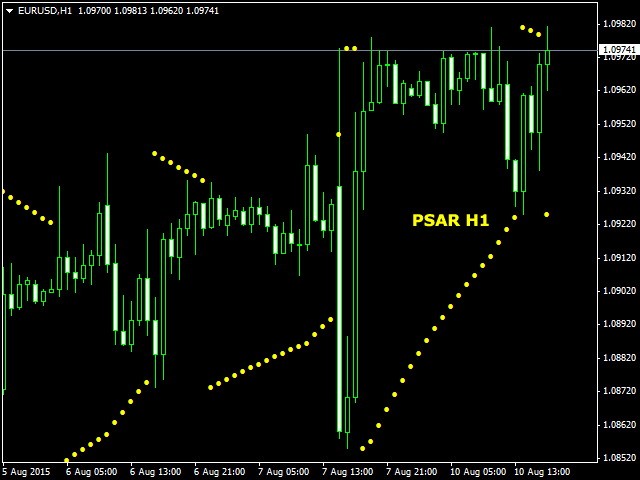
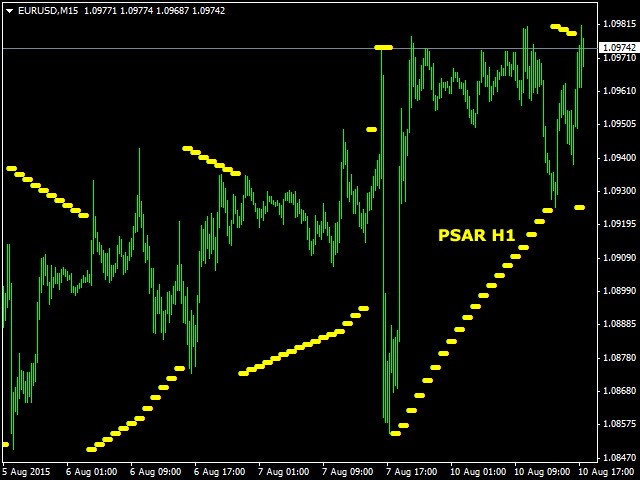
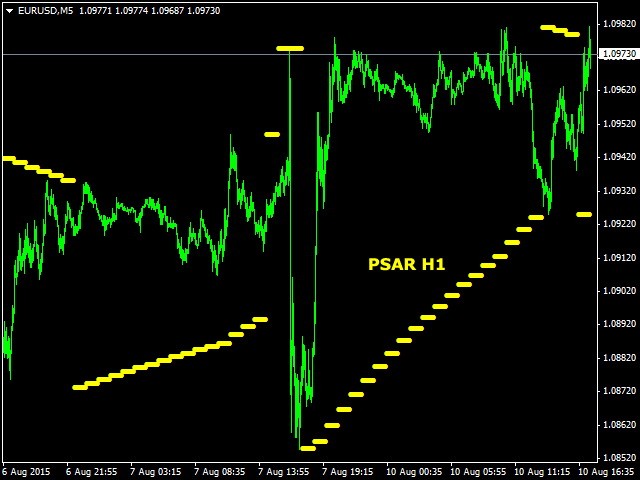
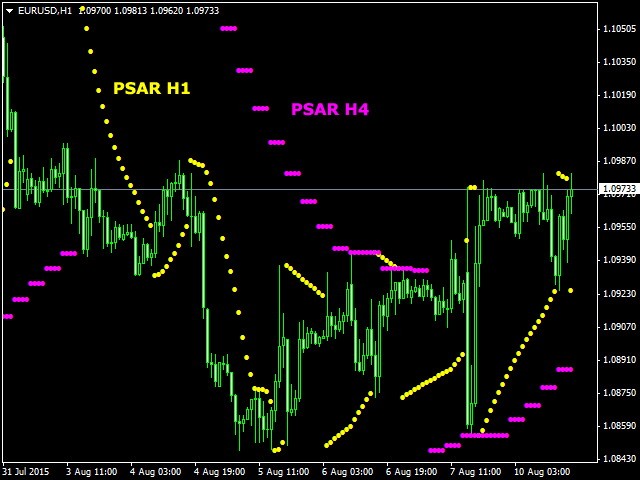
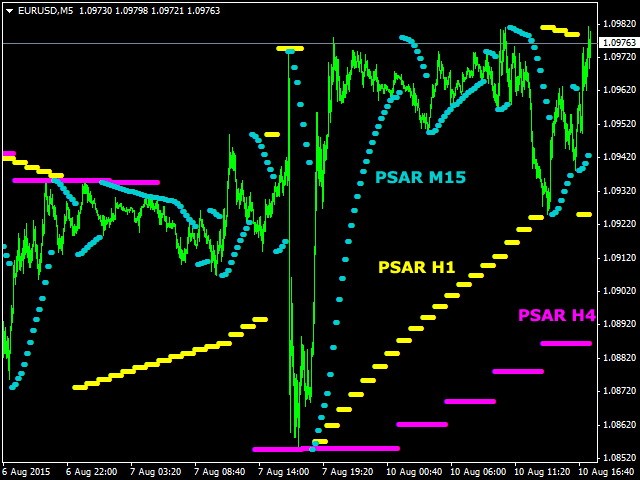
Der Parabolic Converter ist ein Analogon des Parabolic-Indikators für МТ4, der automatisch die Parameter des in den Einstellungen festgelegten Zeitrahmens für niedrigere Zeiträume neu berechnen kann. Er verfügt über ein Benachrichtigungssystem, das ausgelöst wird, wenn die Richtung der Preisbewegung geändert wird.
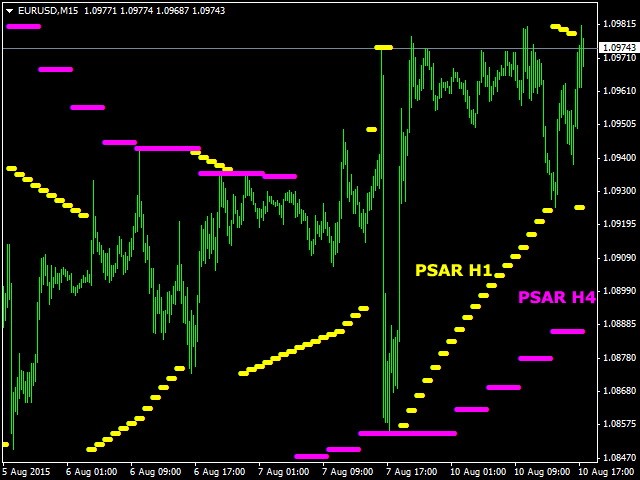
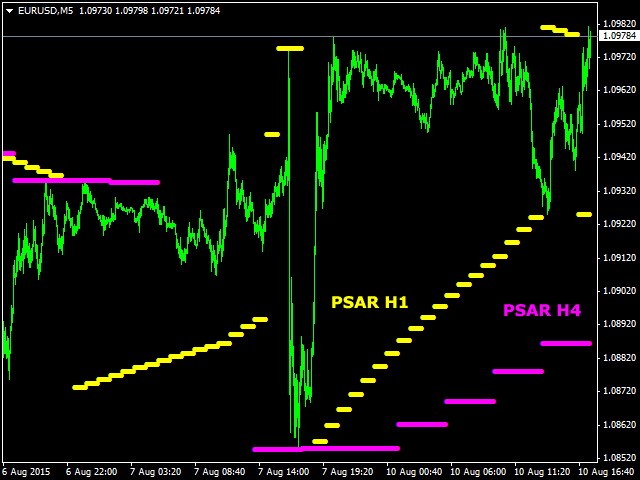
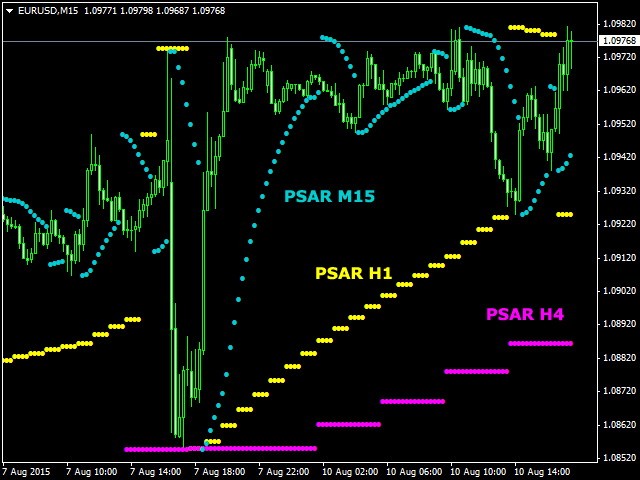
Zum Beispiel: Wenn wir den Time Frame 1 Hour auf H1 und die darin enthaltenen M30, M15, M5 und M1 einstellen, können wir die Werte des Indikators sehen, die H1 entsprechen (Abb.). Wenn wir nun eine weitere Parabolic auf demselben Chart (oder mehreren Charts) mit einem anderen Time Frame 4 Hour Parameter hinzufügen, , sehen wir die Werte von zwei Indikatoren auf H1 und H4 (oder mehrere Parabolics).
Die automatische Neuberechnung der Parameter befreit uns von der Beobachtung mehrerer Fenster des Terminals, da alle erforderlichen Daten auf dem Chart eines unteren Zeitrahmens sichtbar sind, was für Strategien, die den Parabolic-Indikator verwenden, zweifellos ein Vorteil ist.
Der Indikator kann nicht die Parameter eines niedrigeren Zeitraums für einen höheren Zeitraum neu berechnen. In diesem Fall hören Sie ein Fehlersignal und sehen eine entsprechende Warnung auf Ihrem Bildschirm.
Parameter
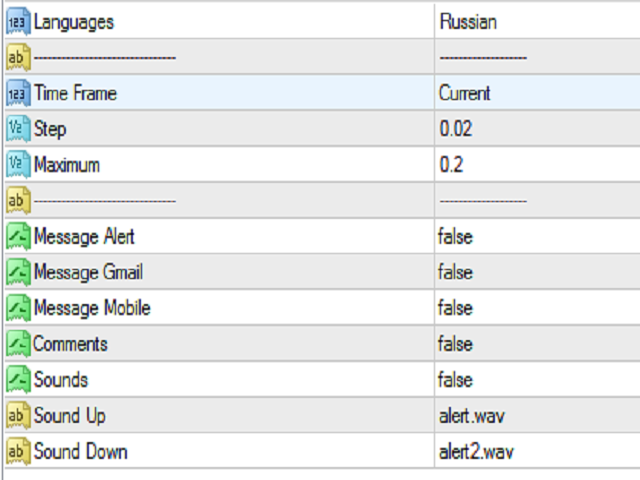
- Sprache - wählen Sie die Sprache - Englisch oder Russisch;
- Time Frame - Zeitraum der Parabolic-Messungen (Current - aktueller Zeitraum);
- Schritt - Schrittweite der Geschwindigkeit, Beschleunigung;
- Maximum - maximaler Koeffizient der Verfolgung des Preises;
Benachrichtigungssystem
Der Indikator kann Signale in Form von Warnungen generieren(Message Alert), einen Kommentar in der oberen linken Ecke des Charts anzeigen(Comments), Benachrichtigungen an die Version für mobile Endgeräte senden(Message Mobile), E-Mails senden(Message Gmail). Die Funktion Sounds wurde zu den Alert-Parametern hinzugefügt. Sie spielt Sound Up- und Sound Down-Dateien im wav-Format ab, die mit einem Programm erstellt und in den Ordner Sounds des installierten Terminals eingefügt werden können. Wenn Sounds aktiviert ist, wird Message Alert automatisch deaktiviert!
Wir wünschen Ihnen einen erfolgreichen Handel!