Chaikin Oscillator
- Indikatoren
- Version: 1.23
- Aktualisiert: 18 Juli 2024
- Aktivierungen: 7

Beschreibung
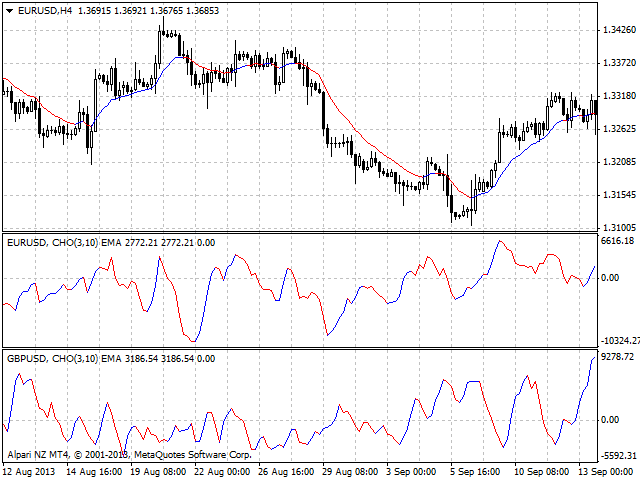
Ein farbiger Chaikin-Oszillator mit mehreren Währungen und Symbolen.
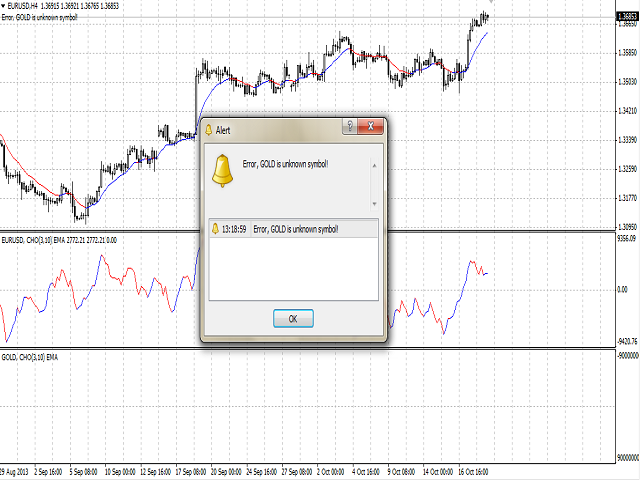
Der Oszillator kann mit jedem Broker verwendet werden, unabhängig vom Namen des Finanzinstruments, da die manuelle Eingabe des Namens als Eingabeparameter erforderlich ist. Wenn Sie einen nicht existierenden oder falschen Namen eines Finanzinstruments eingeben, erhalten Sie eine Fehlermeldung, dass dieses Finanzinstrument unbekannt ist (nicht existiert).
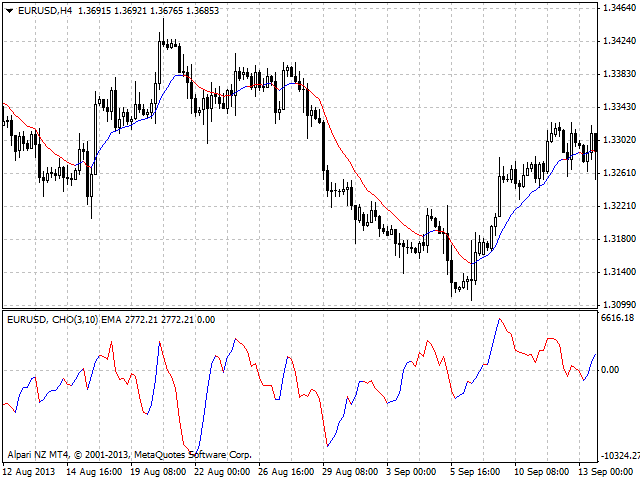
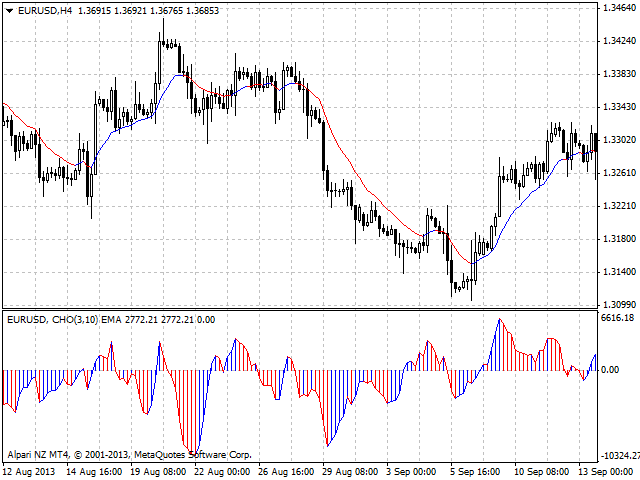
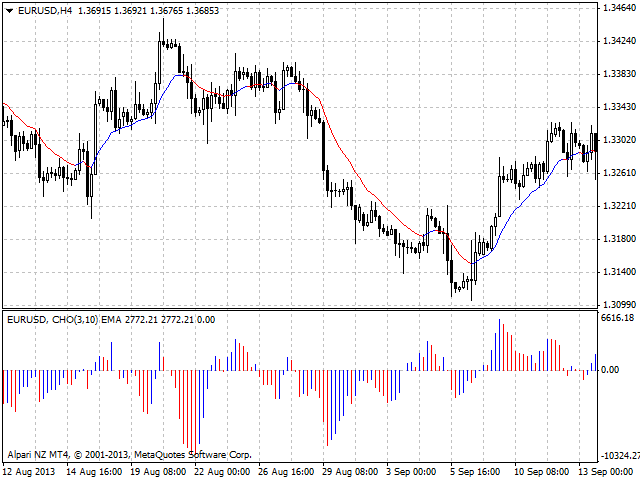
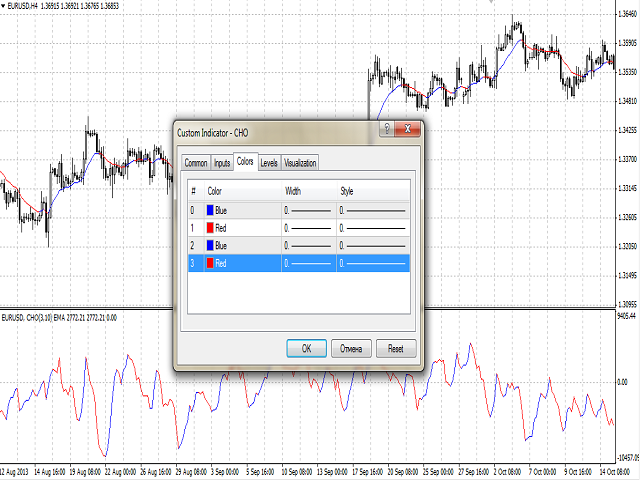
Sie können die Art der grafischen Darstellung der Oszillatorwerte wählen, sowie die Farbe der steigenden und fallenden Linien des Histogramms.
Zweck
Der Indikator kann für den manuellen oder automatisierten Handel in einem Expert Advisor verwendet werden. Die Werte des Indikatorpuffers vom Typ Double können für den automatisierten Handel verwendet werden:
- Die Hauptlinie des Indikators - Puffer 4.
- Die bullische Linie des Indikators - Puffer 0, darf nicht gleich 0 sein.
- Die Baisse-Linie des Indikators - Puffer 1, darf nicht gleich Null sein.
- Die bullische Linie des Indikators Histogramm - Puffer 2, darf nicht gleich 0 sein.
- Die Baisse-Linie des Indikator-Histogramms - Puffer 3, darf nicht gleich Null sein.
Bedeutung der Indikatorsignale
Die wichtigsten Oszillatorsignale werden in den Fällen beobachtet, in denen der Preis einen neuen Höchst- oder Tiefststand erreicht (insbesondere im überverkauften oder überkauften Bereich) und der Oszillator seinen vorherigen Extremwert nicht erreichen kann und seine Richtung ändert.
Die zweite Möglichkeit, den Oszillator zu verwenden, besteht darin, Richtungsänderungen des Oszillators als Kauf- oder Verkaufssignale zu interpretieren, allerdings in Trendrichtung. Befindet sich der Kurs beispielsweise oberhalb des gleitenden n-Tages-Durchschnitts, so liegt ein steigender Trend vor, liegt er darunter, ein fallender Trend. In dieser Situation ist ein Aufwärtsschwung des Oszillators, der sich am Boden (unter Null) befindet, ein Kaufsignal und ein Abwärtsschwung über Null ein Verkaufssignal.
Eingaben
- Currency_Name - der Name des Finanzinstruments.
- Draw_Method - Oszillator-Zeichnungsmethode:
- eine Linie und ein Histogramm (Standard).
- eine Linie.
- ein Histogramm.
- FastMA - die Periode des schnellen gleitenden Durchschnitts.
- SlowMA - die Periode des langsamen gleitenden Durchschnitts.
- MA_Methode - die MA-Mittelungsmethode.
- Shift - die Verschiebung des Basisindikators relativ zum Preisdiagramm.
Empfehlungen
Es wird empfohlen, gleichzeitig auf die Identität oder den Unterschied in den Farben der Linie und des Histogramms zu achten.