Chaikin Oscillator
- Göstergeler
- Sürüm: 1.23
- Güncellendi: 18 Temmuz 2024
- Etkinleştirmeler: 7

Description
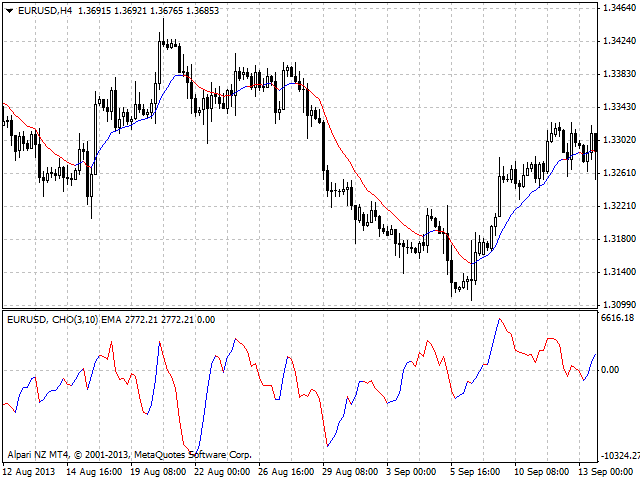
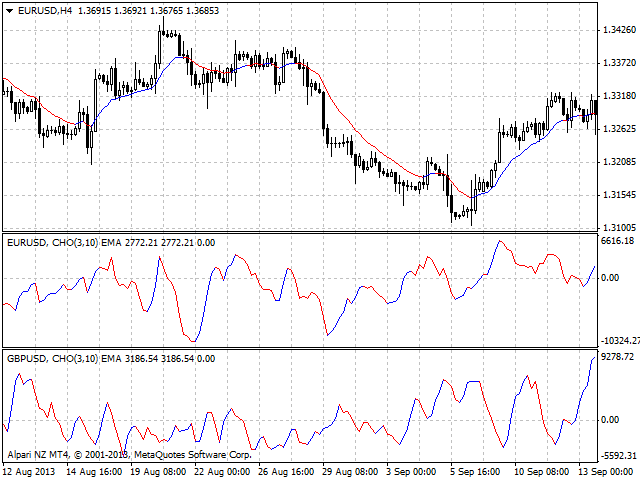
A colored multicurrency/multi-symbol Chaikin Oscillator.
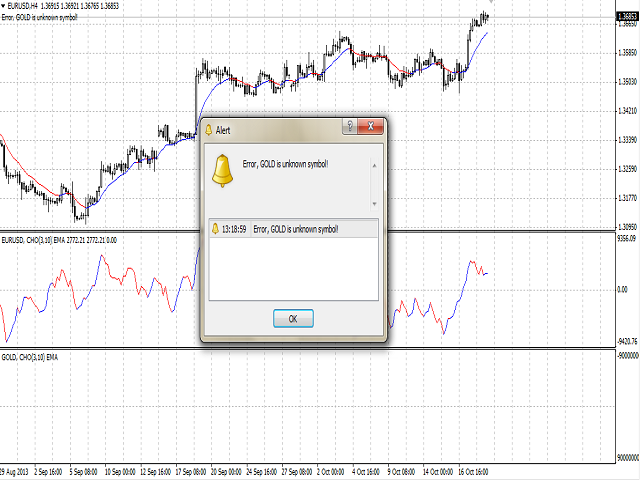
The oscillator may be used with any broker, irrespective of the name of the financial instrument since it is necessary to manually enter the name as an input parameter. If you enter a non-existent or incorrect name of a financial instrument, you will receive an error message that this financial instrument is unknown (does not exist).
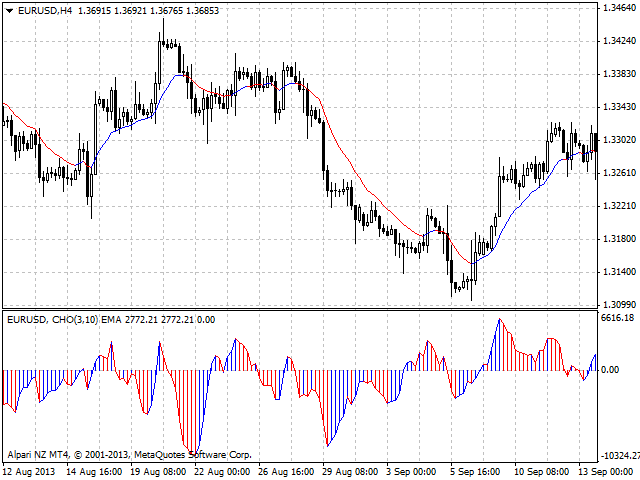
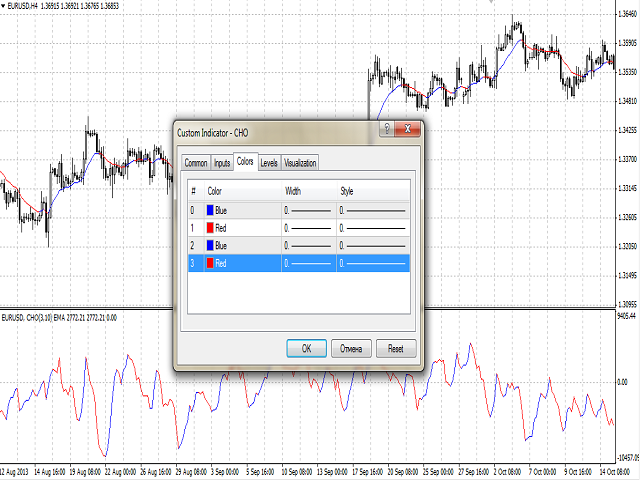
You can select the way of the graphic display of the oscillator values, as well as color the growing and falling lines of the histogram.
Purpose
The indicator can be used for manual or automated trading in an Expert Advisor. Values of indicator buffer of the double type can be used for automated trading:
- The main line of the indicator - buffer 4.
- The bullish line of the indicator - buffer 0, must not be equal to 0.
- The bearish line of the indicator - buffer 1, must not be equal to zero.
- The bullish line of the indicator histogram- buffer 2, must not be equal to 0.
- The bearish line of the indicator histogram - buffer 3, must not be equal to zero.
Meaning of the Indicator Signals
The most important oscillator signals are observed in cases where the price makes a new top or bottom (especially in the oversold or overbought area), and the oscillator cannot reach its previous extreme value and changes direction.
The second way of using the oscillator is interpreting oscillator direction changes as signals to buy or sell, but in the direction of trend. For example, if the price is above the n-day moving average, then we have a growing trend, if below - a falling trend. In this situation, a turn up of the oscillator that is at the bottom (below zero) will be a signal to buy, and a turn down above zero - a signal to sell.
Inputs
- Currency_Name - the name of the financial instrument.
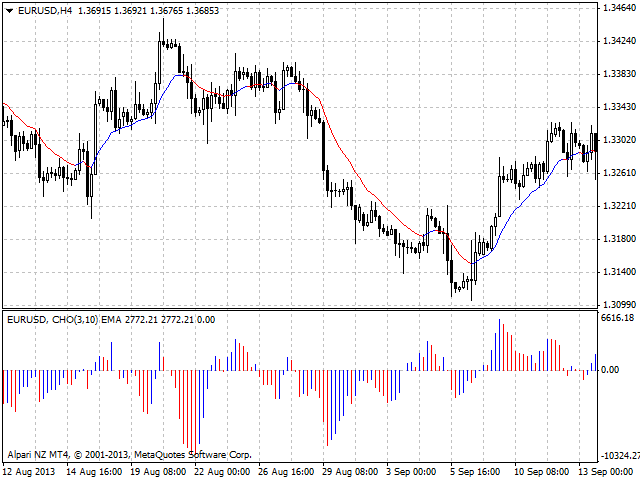
- Draw_Method - Oscillator drawing method:
- a line and a histogram(default).
- a line.
- a histogram.
- FastMA - the period of the fast moving average.
- SlowMA - the period of the slow moving average.
- MA_Method - the MA averaging method.
- Shift - the sift o the basic indicator relative to the price chart.
Recommendations
It is recommended to pay attention to the identity or difference in the colors of the line and the histogram simultaneously.