Chaikin Oscillator
- Indicadores
- Versión: 1.23
- Actualizado: 18 julio 2024
- Activaciones: 7

Descripción
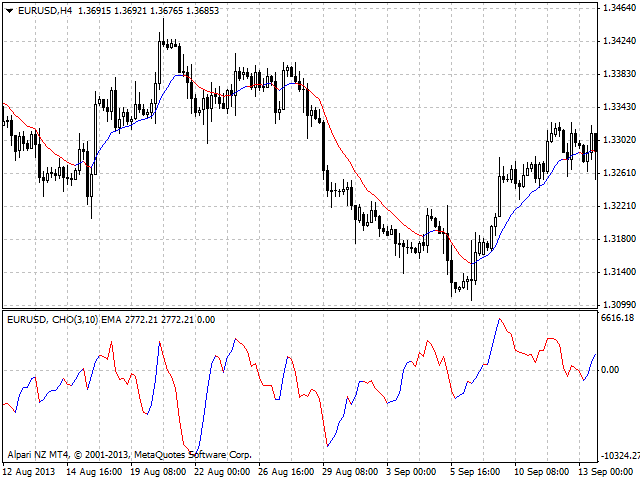
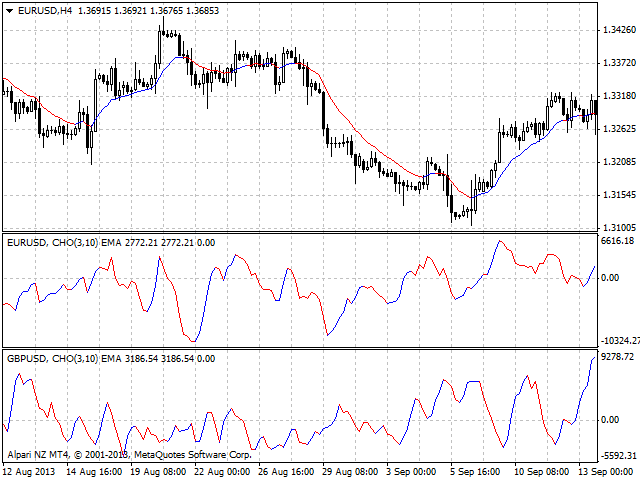
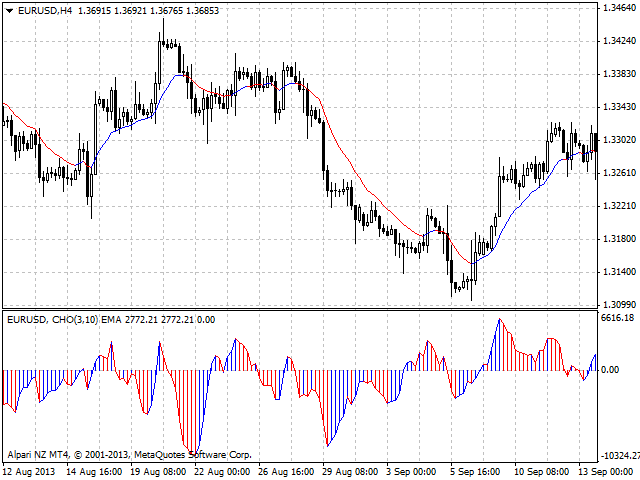
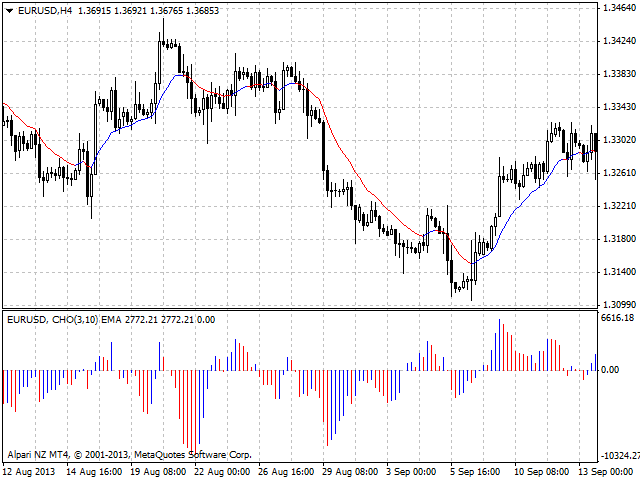
Un oscilador Chaikin de color multidivisa/multisímbolo.
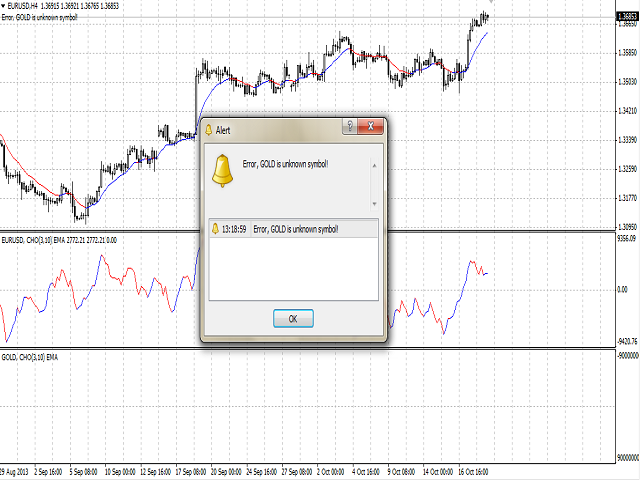
El oscilador se puede utilizar con cualquier broker, independientemente del nombre del instrumento financiero, ya que es necesario introducir manualmente el nombre como parámetro de entrada. Si introduce un nombre inexistente o incorrecto de un instrumento financiero, recibirá un mensaje de error indicando que este instrumento financiero es desconocido (no existe).
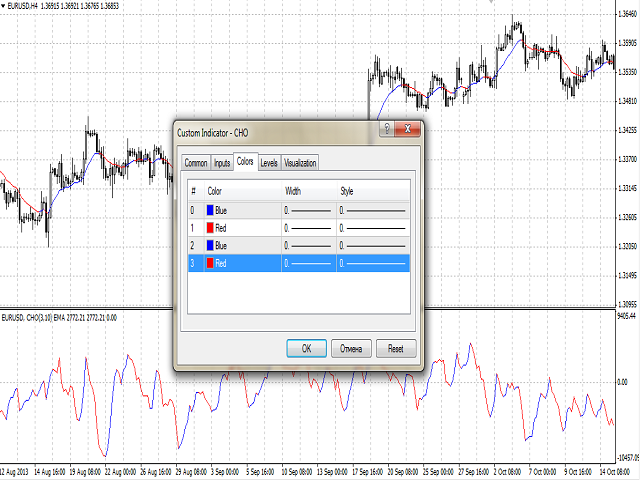
Puede seleccionar el modo de visualización gráfica de los valores del oscilador, así como colorear las líneas crecientes y decrecientes del histograma.
Propósito
El indicador se puede utilizar para el comercio manual o automatizado en un Asesor Experto. Los valores de la memoria intermedia del indicador de tipo doble se pueden utilizar para el comercio automatizado:
- La línea principal del indicador - buffer 4.
- La línea alcista del indicador - buffer 0, no debe ser igual a 0.
- La línea bajista del indicador - buffer 1, no debe ser igual a cero.
- La línea alcista del indicador histograma - buffer 2, no debe ser igual a 0.
- La línea bajista del histograma del indicador - buffer 3, no debe ser igual a cero.
Significado de las señales del indicador
Las señales más importantes del oscilador se observan en los casos en que el precio hace un nuevo máximo o mínimo (especialmente en la zona de sobreventa o sobrecompra), y el oscilador no puede alcanzar su valor extremo anterior y cambia de dirección.
La segunda forma de utilizar el oscilador consiste en interpretar los cambios de dirección del oscilador como señales de compra o venta, pero en la dirección de la tendencia. Por ejemplo, si el precio está por encima de la media móvil de n días, entonces tenemos una tendencia creciente, si está por debajo - una tendencia bajista. En esta situación, un giro al alza del oscilador que esté en la parte inferior (por debajo de cero) será una señal de compra, y un giro a la baja por encima de cero - una señal de venta.
Entradas
- Currency_Name - el nombre del instrumento financiero.
- Draw_Method - Método de dibujo del oscilador:
- una línea y un histograma(por defecto).
- una línea.
- un histograma.
- FastMA - período de la media móvil rápida.
- SlowMA - el periodo de la media móvil lenta.
- MA_Method - el método de promediación MA.
- Shift - el desplazamiento del indicador básico con respecto al gráfico de precios.
Recomendaciones
Se recomienda prestar atención a la identidad o diferencia en los colores de la línea y el histograma simultáneamente.