Reversal Bars
- Indikatoren
- Version: 1.22
- Aktualisiert: 23 Juli 2024
- Aktivierungen: 7

Beschreibung
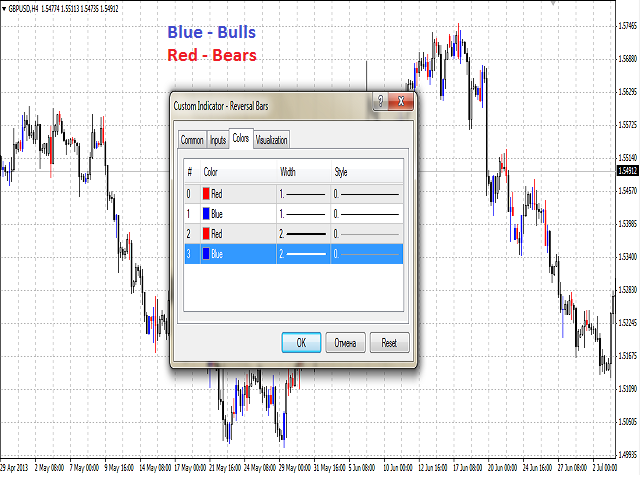
Der Indikator bestimmt das Aussehen der Balken, die eine Umkehr der aktuellen lokalen Stimmungen signalisieren, und gibt einen Signalton aus. Außerdem malt er diese Balken entsprechend der bullischen und/oder bärischen Priorität aus.
Sie können die Farbe für bullische und bärische Stimmungen wählen.
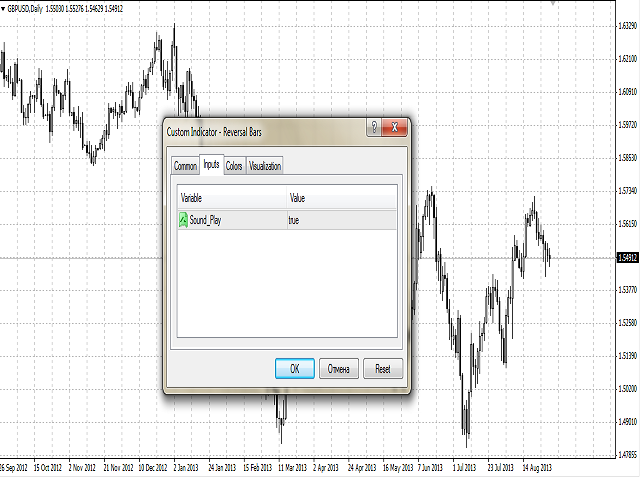
Eingaben
- Sound_Play - ein Flag, das die Sound-Benachrichtigung erlaubt.
verwenden
Die Erkennung eines Umkehrbalkens kann ein Signal sein, um entsprechende Handelsaktivitäten durchzuführen.
Der Indikator kann für den manuellen oder automatisierten Handel in einem Expert Advisor verwendet werden. Für den automatisierten Handel kann er Werte eines beliebigen Indikatorpuffers vom Typ Double verwenden: 0, 1, 2 oder 3. Der Wert darf nicht Null sein!