Price Levels
- Indikatoren
- Version: 2.13
- Aktualisiert: 18 Juli 2024
- Aktivierungen: 7

Beschreibung
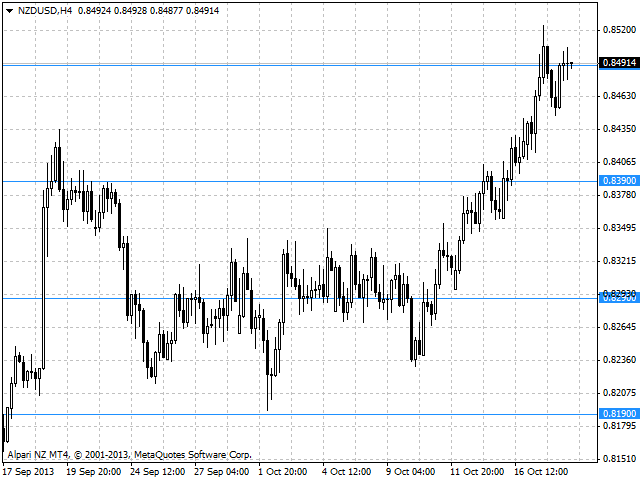
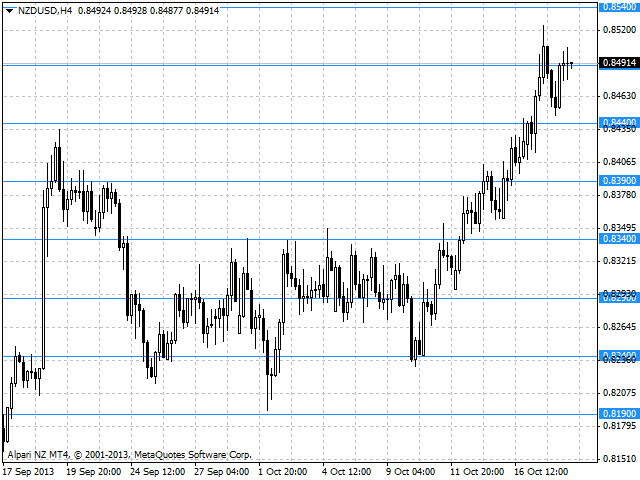
Der Indikator ist für die Kennzeichnung des Charts mit horizontalen Niveaus und/oder halbrunden Preisen bestimmt. Der Indikator funktioniert für jedes Finanzinstrument, unabhängig von der Bezeichnung und der Anzahl der Ziffern.
Der Benutzer kann die Farben für die Linien des Indikators wählen.
Eingabe-Parameter
- Calc_Method - Methode zur Berechnung der Linien:
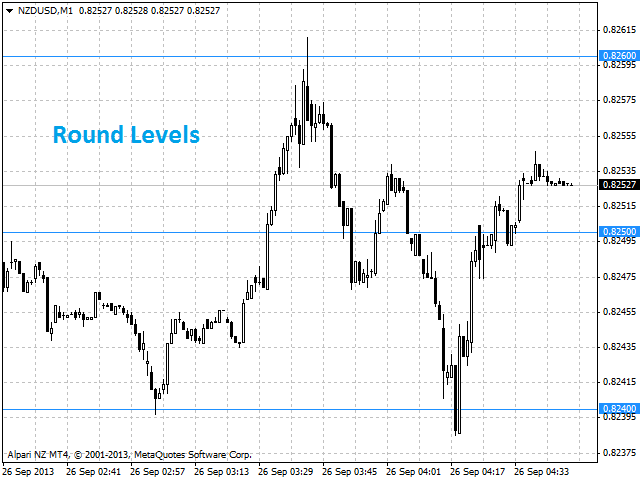
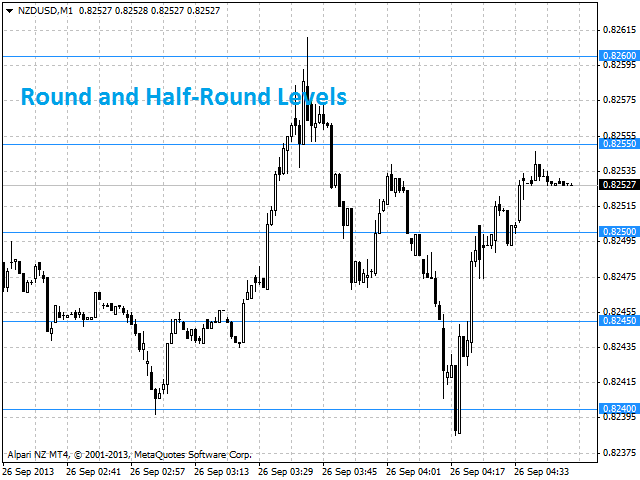
- Niveaus der runden Preise.
- Niveaus der halbrunden Preise.
- Digits_Accepted - Flagge für die Berechnung der Niveaus nach der Anzahl der Dezimalstellen in den Kursen eines Finanzinstruments:
- true - unter Berücksichtigung der Anzahl der Dezimalstellen.
- false - ohne Berücksichtigung der Anzahl der Nachkommastellen.
- Level_Color - Farbe der angezeigten Linien.
Standardmäßig werden die Levels von halbrunden Kursen berechnet und dargestellt.
Zweck
Der Indikator kann für den manuellen oder automatischen Handel innerhalb eines Expert Advisors verwendet werden. Für den automatisierten Handel verwenden Sie einen beliebigen Indikatorpuffer vom Typ Double:
- Höchstes Niveau - Puffer 0.
- Niedrigstes Niveau - Puffer 1.
Die Zwischenstände sollten mit einem Schritt berechnet werden, der einem halbrunden oder runden Kurswert entspricht, und unter Berücksichtigung des höchsten und des niedrigsten Standes, die durch Prüfung der Werte der Indikatorpuffer auf dem entsprechenden Balken ermittelt werden.
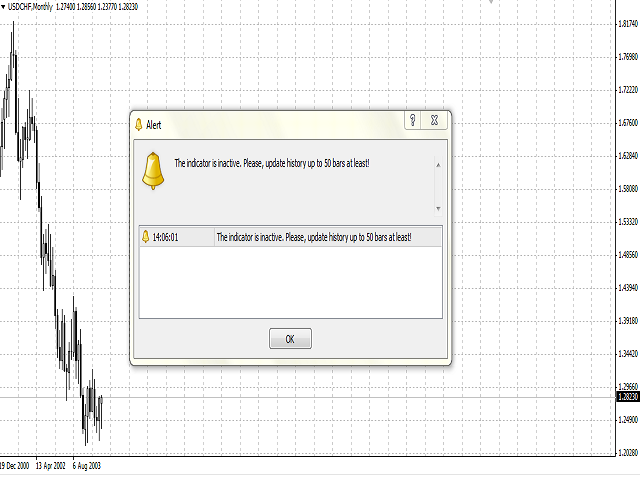
Beschränkungen
Damit der Indikator funktioniert, müssen mindestens 50 Balken für das Finanzinstrument verfügbar sein. Andernfalls wird eine Fehlermeldung angezeigt, die vorschlägt, die Kursverlaufsdatenbank zu aktualisieren.