Multicurrency Tools
- Indikatoren
- Version: 1.25
- Aktualisiert: 23 Juli 2024
- Aktivierungen: 7

Beschreibung
Ein Mehrzweck-Multi-Farb-/Multi-Symbol-Indikator, der eine Reihe von Standard-Tools aus dem MetaTrader 4-Terminal ist.
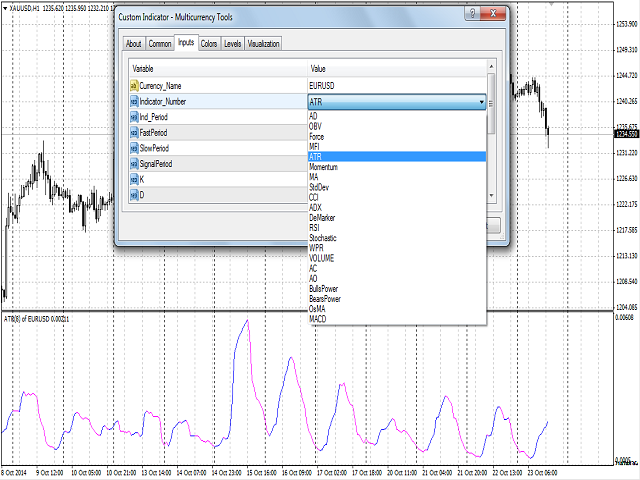
Der Unterschied besteht darin, dass er unterhalb des grundlegenden Preisdiagramms ermöglicht, in einem separaten Fenster einen der zwanzig Indikatoren in farbiger Form zu berechnen und zu erstellen, wobei Bullen und Bären in verschiedenen Farben dargestellt werden, und zwar für jedes beliebige Finanzinstrument in Übereinstimmung mit der unten stehenden Liste:
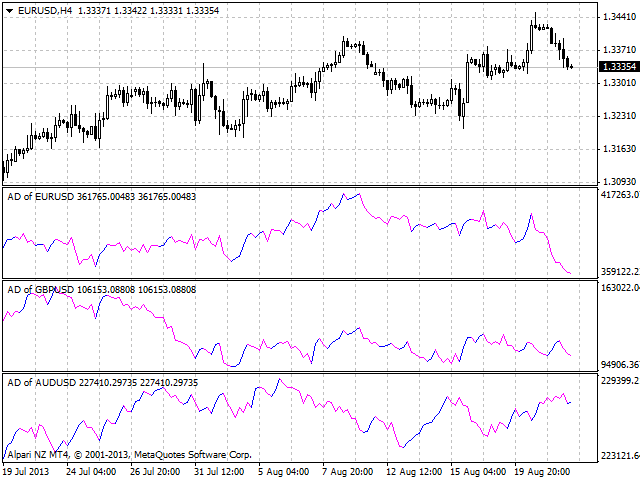
- AD - ein Indikator für die Akkumulation und Verteilung des Volumens.
- OBV - On Balance Volumen.
- Force - Indikator für den Force Index.
- MFI - Geldfluss-Index.
- ATR - Durchschnittliche wahre Spanne.
- Momentum.
- Gleitender Durchschnitt.
- Standardabweichung.
- CCI - Commodity Channel Index.
- ADX - Average Directional Movement Indikator.
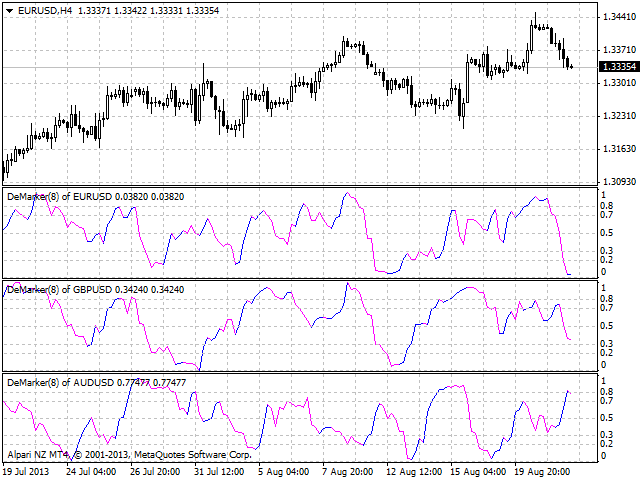
- DeMarker.
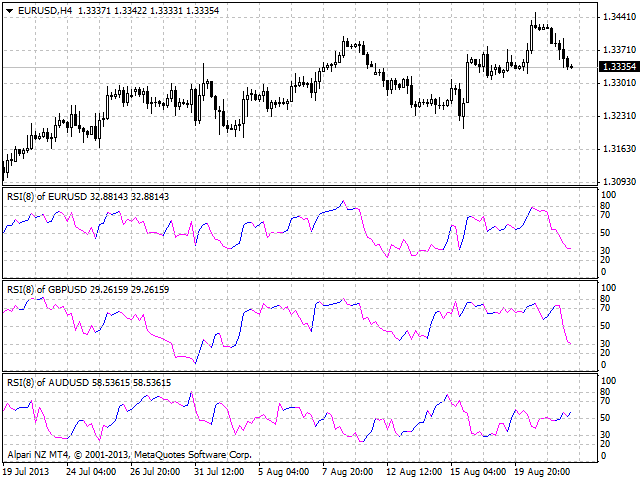
- RSI - Relative Stärke-Index.
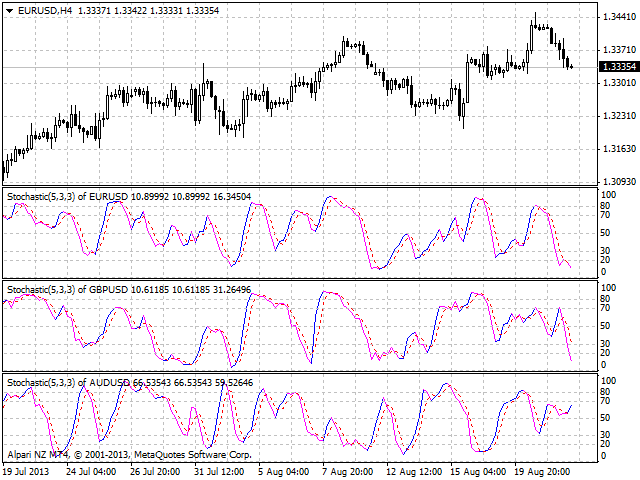
- Stochastik - Stochastik-Oszillator.
- WPR - Bill-Williams-Oszillator.
- Volumen - Tick-Volumen-Indikator.
- AC - Indikator für die Beschleunigung.
- AO - Williams-Oszillator.
- BullsPower.
- BearsPower.
- OsMA - gleitender Durchschnitt des Oszillators.
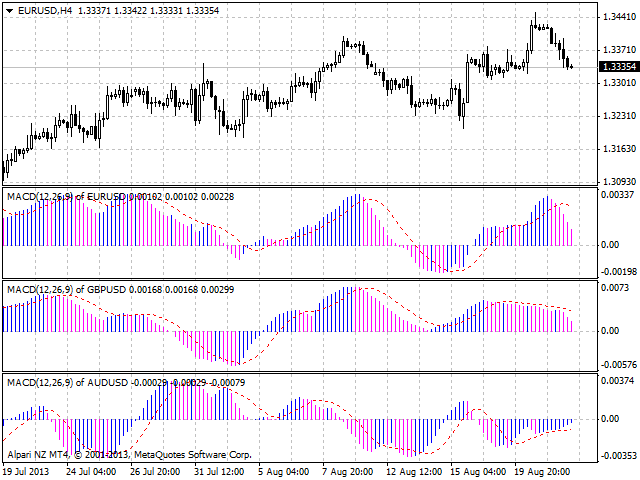
- MACD - gleitender Durchschnitt Konvergenz/Divergenz.
Der Standardindikator ist AD - ein Indikator für die Akkumulation und Verteilung des Volumens.
Zweck
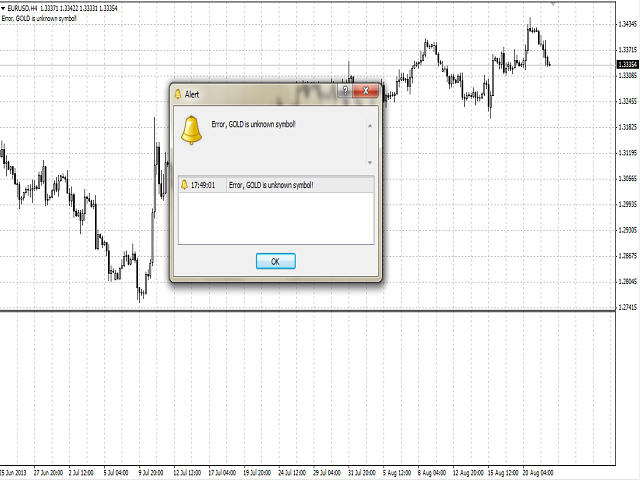
Der Indikator kann mit jedem Broker verwendet werden, unabhängig von der Bezeichnung des Finanzinstruments, da es notwendig ist, die Bezeichnung manuell als Eingabeparameter einzugeben. Wenn Sie einen nicht existierenden oder falschen Namen eines Finanzinstruments eingeben, erhalten Sie eine Fehlermeldung, dass dieses Finanzinstrument unbekannt ist (nicht existiert).
Eingaben
- Währung_Name - der Name des Finanzinstruments.
- Indikator_Nummer - der Name des berechneten Indikators aus der Liste.
- Ind_Period - die Periode des Indikators.
- FastPeriod - die Periode des schnellen MA für OsMA und MACD.
- SlowPeriod - die Periode des langsamen MA für OsMA und MACD.
- SignalPeriod - Periode der Signallinie für OsMA und MACD.
- K - Mittelungszeitraum für die Berechnung der K-Linie für Stochastic
- D - Mittelungszeitraum für die Berechnung der D-Linie für die Stochastik
- Verlangsamung - der Verlangsamungswert für Stochastic.
- PriceField - Preisauswahlparameter für die Berechnung der Stochastik:
- Low/High.
- Schließen/Schließen.
- MA_Methode - die Mittelungsmethode für die MA- und Signallinien.
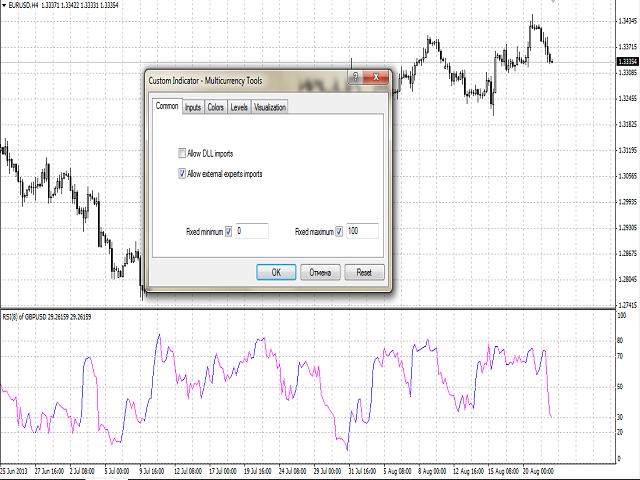
- Applied_Price - Verwendeter Preis.
- Shift - Verschiebung relativ zum Preisdiagramm.
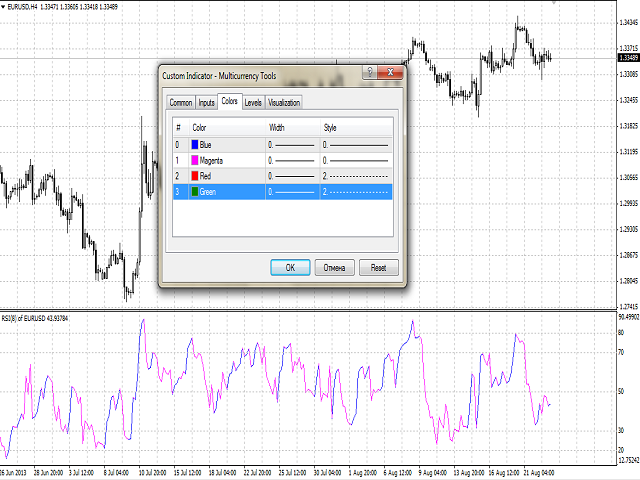
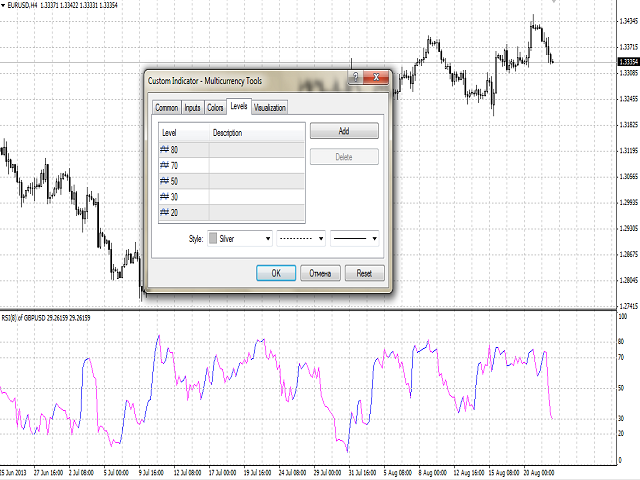
Plotten
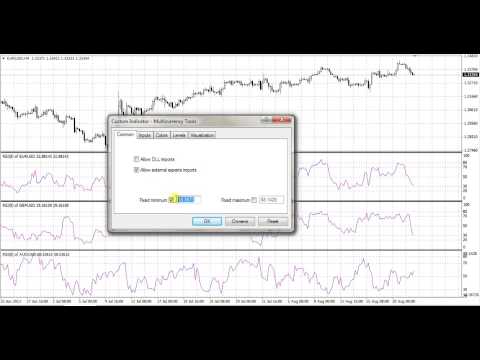
Der Indikator zeichnet automatisch interne horizontale Linien zwischen dem Maximum und dem Minimum. Die Linien des Maximums und des Minimums müssen manuell eingestellt werden. Zum Beispiel, für RSI und Stochastic - 0 und 100, für DeMarker - 0 und 1.
Beim Ändern, d.h. Neuberechnen von Indikatoren, sollten die Maximal- und Minimallinien des vorherigen Indikators geändert oder deaktiviert werden, interne Linien sollten gelöscht werden.
Das einfache Verfahren wird im Video gezeigt. Um das Verfahren zu vereinfachen, entfernen Sie den vorherigen Indikator aus dem Fenster und fügen Sie den neuen ein.
Verwendung
Der Indikator kann für den manuellen oder automatisierten Handel in einem Expert Advisor verwendet werden. Werte von Indikatorpuffern des Typs Double können für den automatisierten Handel verwendet werden:
- Die Linie/Histogramm des Indikators - Puffer 4.
- Die Wachstumslinie/das Wachstumshistogramm (Bullen) - Puffer 0, darf nicht leer sein, d.h. gleich EMPTY_VALUE.
- Die Falllinie/das Fallhistogramm (Bären) - Puffer 1, darf nicht leer sein, d.h. gleich EMPTY_VALUE.
- Die Signallinie für ADX (+DI), Stochastic, MACD - Puffer 2.
- Die Signallinie des ADX (-DI) - Puffer 3.