Multicurrency MAs
- Indikatoren
- Version: 1.24
- Aktualisiert: 23 Juli 2024
- Aktivierungen: 7

Beschreibung
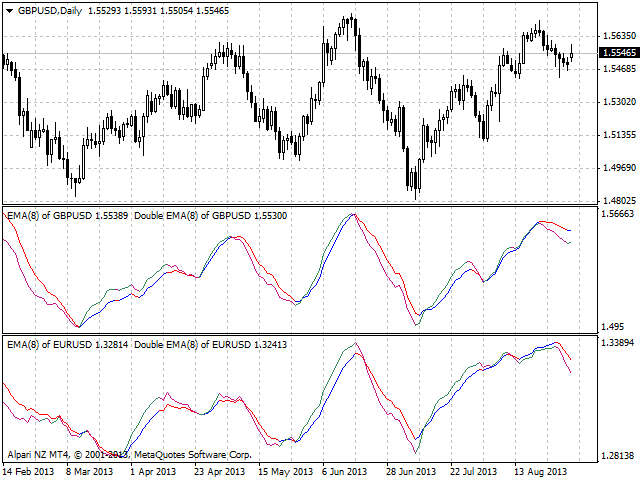
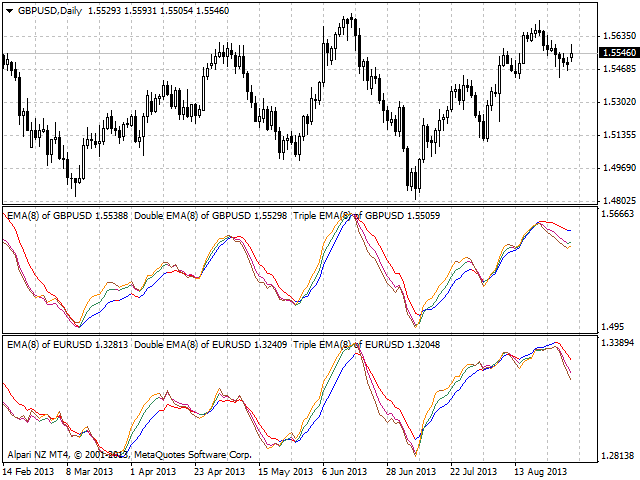
Ein universeller farbiger Multiwährungs/Multisymbol-Indikator für gleitende Durchschnitte: Gleitender Durchschnitt, doppelter gleitender Durchschnitt, dreifacher gleitender Durchschnitt.
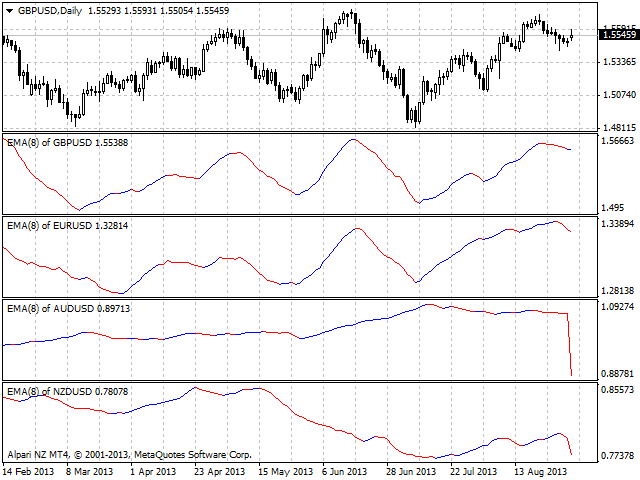
Der Indikator wird in einem separaten Fenster angezeigt, so dass der Benutzer unterhalb des Hauptcharts die Entwicklung eines anderen Finanzinstruments sehen kann.
Er ist sehr nützlich, wenn man die kombinierten Werte verschiedener gleitender Durchschnitte für unterschiedliche Finanzinstrumente unterhalb des Hauptcharts betrachtet.
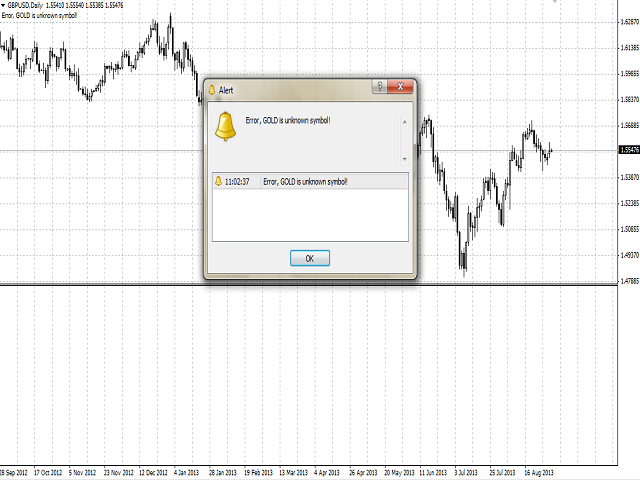
Der Indikator kann mit jedem Broker verwendet werden, unabhängig vom Namen des Finanzinstruments, da es notwendig ist, den Namen manuell als Eingabeparameter einzugeben. Wenn Sie einen nicht existierenden oder falschen Namen eines Finanzinstruments eingeben, erhalten Sie eine Fehlermeldung, dass dieses Finanzinstrument unbekannt ist (nicht existiert).
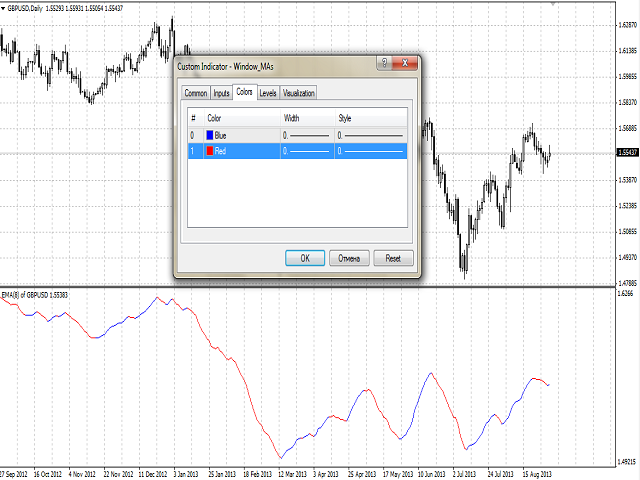
Sie können bullische und bearische Stimmungen einfärben.
Eingaben
- Currency_Name - der Name des Finanzinstruments.
- MA_Typ - Art der Multiplikation:
- Gleitender Durchschnitt.
- Doppelter gleitender Durchschnitt.
- Dreifacher gleitender Durchschnitt.
- MA_Periode - die MA-Periode.
- MA_Methode - die Mittelwertbildungsmethode für den MA.
- Angewandter_Preis - der verwendete Preis.
- Shift - Verschiebung relativ zum Preisdiagramm.
Zweck
Der Indikator kann für den manuellen oder automatischen Handel in einem Expert Advisor verwendet werden. Werte von Indikatorpuffern des Typs double können für den automatisierten Handel verwendet werden:
- Die Hauptlinie des Indikators - Puffer 5.
- Die bullische Linie des Indikators - Puffer 0, darf nicht gleich 0 sein.
- Die Baisse-Linie des Indikators - Puffer 1, darf nicht gleich Null sein.