Profile Map
- Indikatoren
- Version: 1.35
- Aktualisiert: 29 Januar 2019
- Aktivierungen: 5

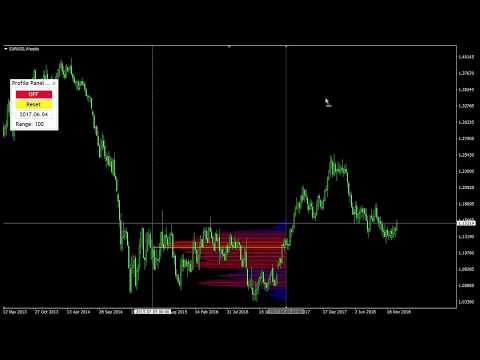
Das Marktprofil hilft dem Händler, das Verhalten der wichtigsten Marktteilnehmer zu erkennen und Zonen von deren Interesse zu definieren. Das Hauptmerkmal ist die klare grafische Darstellung des Preisaktionsbereichs, in dem 70 % der Trades durchgeführt wurden. Das Verständnis der Lage von Volumenakkumulationsbereichen kann dem Händler helfen, die Erfolgswahrscheinlichkeit zu erhöhen. Das Tool kann sowohl als eigenständiges System als auch in Kombination mit anderen Indikatoren und Handelssystemen verwendet werden.
Dieser Indikator ist auf die Bedürfnisse aller Profilhändler zugeschnitten. Er bietet Funktionen und Merkmale zur Anzeige des Marktprofils auf der erforderlichen Anzahl von Balken in der Historie.
Highlights der Funktion
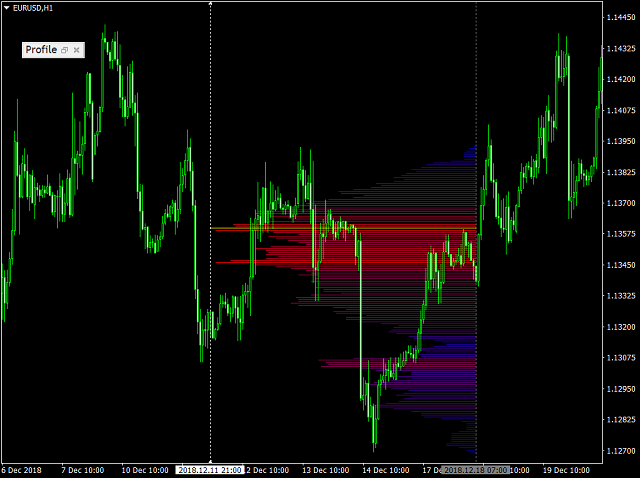
- Möglichkeit der Anzeige des Marktprofils auf der gewünschten Anzahl von Balken in der Historie.
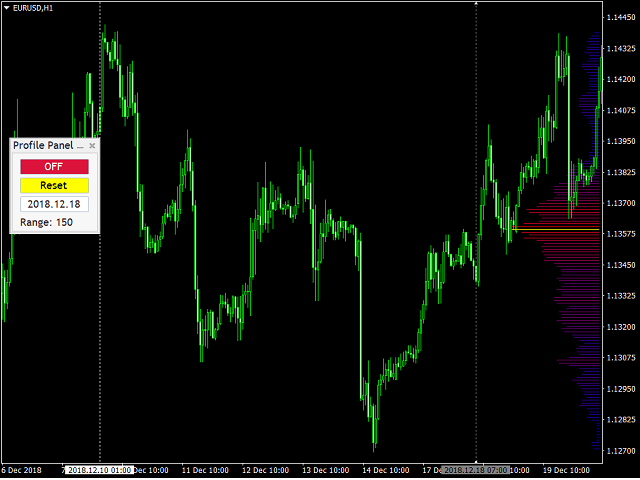
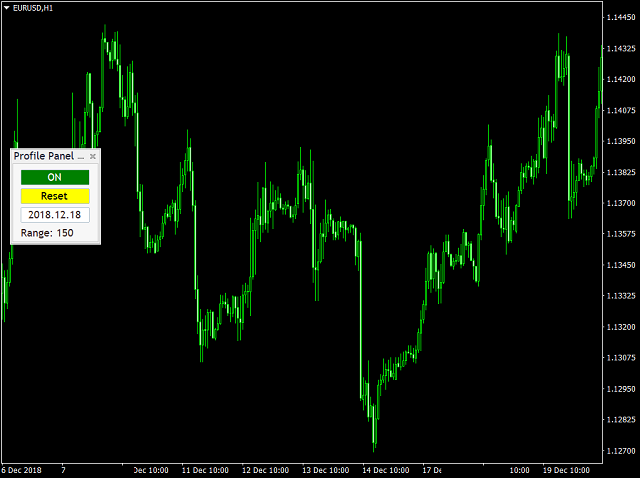
- Anzeige des Profils für den gewünschten Zeitraum und Kontrolle vom Chart aus.
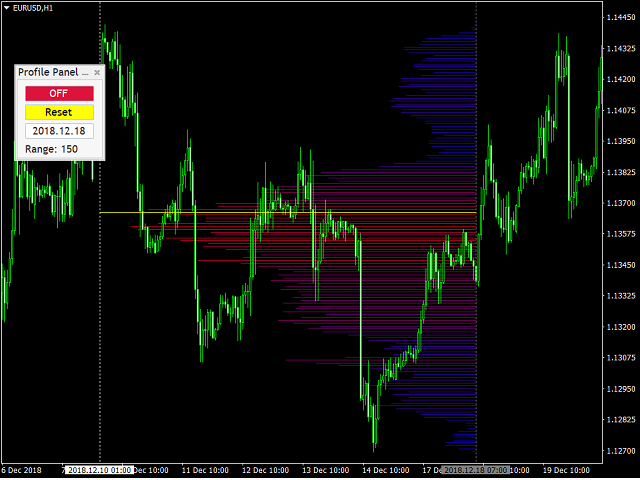
- Anzeige der gewünschten Anzahl von horizontalen Linien.
- Anzeige des Profils auf einer bequemen Seite.
- Grafische Darstellung des Profils in Form eines Gradienten, der die Stärke der Stufen widerspiegelt.
- Farbwechsel des Profils und des Akkumulationszentrums.
- Punkt der Kontrolle
Eingänge
- Volumenart - Tick oder Real
- Anzahl der Linien - Anzahl der horizontalen Linien im Profil
- Verschiebung der rechten Kante zum neuesten Balken - Verschiebung der rechten Kante/Linie des Profils
- Verschiebung des linken Randes, wenn der rechte verschoben wurde - Verschiebung des linken Randes, wenn der rechte verschoben wurde.
- Stil der linken Kante - Stil für die linke Kante/Linie
- Stil für die rechte Kante - Stil für die rechte Kante/Linie
- Farbe der rechten Kante - Farbe für die rechte Kante/Linie


Отличный индикатор! Есть возможность смотреть исторический профиль.