All in one smart Smc indicator Ict mmxm

Features List 1:

  • FVG->iFVG
  • Order Block
  • High Transaction Line (Personal strategy)
  • Premium Discount
  • 50% and 61%
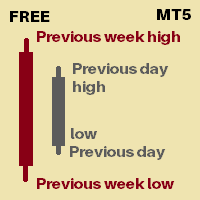
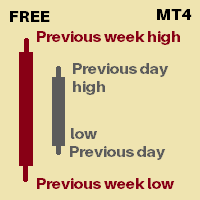
  • Previous day high low
  • Previous week high low
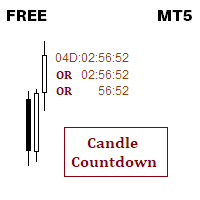
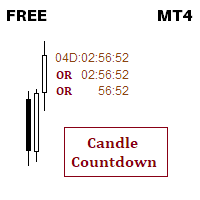
  • Candle end countdown

Feature List 2 : (Implemented based on feedback from community groups)

  • trend identification
  • Hide FVG, Order Block, Large Transaction line below 50% equilibrium.
  • Hide all/Individual texts/features

FUTURE Feature List (Will be implemented only if at least 5 people request for it.)

  • Asia, London, NY lq zones
  • Alerts for features price touch
  • Multi-timeframe
  • Textbox that saves your notes
  • Your requests/Your entry techniques(Private jobs can also be fulfilled). 


Always open to feedback and criticism if it helps me provide more value.


Thank you :)

Produtos recomendados
The indicator plays sound alerts when the price reaches certain levels, specified by trader. You only need to draw a trendline and then press the alert button in the panel. The texts of the notification you determine. Notification via a smartphone or email address is possible. Note for "Free Demo" : MetaTrader 4 does not support displaying an alert window or playing sounds in the strategy tester, only in live or demo accounts. How it works Draw a trendline Click the "Alert" button (Trendline m
The indicator allows you to trade binary options. The recommended time frame is М1 and the expiration time is 1,2,3 minutes. The indicator suitable for auto and manual trading. A possible signal is specified as a arrows above/under a candle. You should wait until the candle closes! Arrows are not re-painted Trade sessions: TOKYO section (Half-end) Currency pairs: USD/JPY Working time frame: M1 Expiration time: 1,2,3 minutes. The indicator also shows good results when using the martingale strateg
FREE
Profile Map
Dmitriy Sapegin
5 (11)
Market Profile helps the trader to identify the behavior if major market players and define zones of their interest. The key feature is the clear graphical display of the range of price action, in which 70% of the trades were performed. Understanding of the location of volume accumulation areas can help traders increase the probability of success. The tool can be used as an independent system as well as in combination with other indicators and trading systems. this indicator is designed to suit
Blahtech Market Profile
Blahtech Limited
4.53 (15)
Was: $249  Now: $149   Market Profile defines a number of day types that can help the trader to determine market behaviour. A key feature is the Value Area, representing the range of price action where 70% of trading took place. Understanding the Value Area can give traders valuable insight into market direction and establish the higher odds trade. It is an excellent addition to any system you may be using. Blahtech Limited presents their Market Profile indicator for the MetaTrader community. In
Trend Zones
Augustine Kamatu
Introducing Trend Zones: Your Ultimate Tool for Precise Market Entry and Exit Points. Trend Zones is a revolutionary MetaTrader 4 indicator designed to provide traders with clear buy and sell zones based on trend reversals and price action. Built upon advanced algorithms and non-repainting technology, this indicator offers unparalleled accuracy in identifying optimal entry and exit points in the forex market. Key Features: 1. Non-Repainting Signals: Trend Zones delivers non-repainting signals,
Volume Compair
Thiago Pereira Pinho
Professional Cumulative Delta & Volume Median Indicator Track   real buying/selling pressure   with this powerful volume analysis tool. The   Volume Compare Indicator   combines   Cumulative Delta   and   Volume Medians   to help you identify institutional activity, imbalances, and potential reversals. Key Features:   Cumulative Delta Histogram   – Visualizes net buying vs. selling volume in real-time.   Buy/Sell Volume Medians   – Horizontal lines showing average buy & sell volume lev
VWAP Indicator MT4
Kyra Nickaline Watson-gordon
5 (1)
Description : VWAP (Volume-Weighted Average Price) is the ratio of the value traded to total volume traded over a particular time horizon. It is a measure of the average price at which pair is traded over the trading horizon. Read More. All Symbols and All Timeframes are supported. Indicator Inputs :     VWAP Mode : Mode of VWAP Calculation. Options can be selected : Single,Session,Daily,Weekly,Monthly     Volumes : Real Volumes,Tick Volumes     Price Type : Used price for calculating.
Simply The Best Pro
Szymon Palczynski
5 (1)
This indicator displays the histogram and arrows on chart. When Simple The Best Pro are placed on a chart, they identify the trend.  The color of may be blue or red. The blue color stands for upside moves and the red color stands for downside trends. The indicator offers to set Stop Loss (SL) and  Take Profit (TP)  setting. The default value is ATR. Indicator has automatic optimization. The STB is a unique indicator that shows the tendency (button Bars) of a particular signals. The STB tells us
Last 50 Pips
Martin Alejandro Bamonte
O indicador Last 50 Pips foi projetado para identificar rapidamente oportunidades de compra e venda com base no comportamento recente dos preços. Ele mede a variação de preço nas últimas velas para destacar em amarelo os momentos em que o preço pode estar mudando de direção. Sinal de compra: Deve abrir uma posição de COMPRA quando o indicador muda de VERMELHO para AMARELO , sugerindo uma mudança de uma tendência de baixa para uma de alta. Por favor, veja as imagens para entender como é simples.
Pinbar Pattern Scanner: Your Ultimate Forex Trading Tool The Pinbar Pattern Scanner is a cutting-edge, non-repainting, non-lagging price action tool designed for both novice and expert traders. With its unique ability to scan across 9 timeframes, this tool alerts you of potential price rejections in any forex symbol, all from a single chart. Key Features: Versatility: Originally developed for forex, it's also suitable for binary options for those well-versed in price action. Customizable: Tai
O indicador cria cotações atuais, que podem ser comparadas com as históricas e, com base nisso, fazer uma previsão do movimento dos preços. O indicador possui um campo de texto para navegação rápida até a data desejada. Opções: Símbolo - seleção do símbolo que o indicador exibirá; SymbolPeriod - seleção do período do qual o indicador coletará dados; IndicatorColor - cor do indicador; HorisontalShift - deslocamento das cotações desenhadas pelo indicador pelo número especificado de barras; I
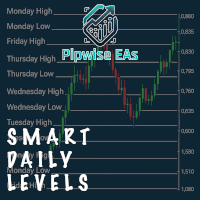
Smart Daily Levels – Extended Highs & Lows from Past Days Never lose sight of market structure again. Smart Daily Levels automatically draws horizontal lines at the high and low of each day — and extends them forever to the right side of your chart. Perfect for traders who use: • Support & resistance • Breakout traps • Liquidity zones • Smart Money / price action strategies Core Features • Daily high & low lines from the past X days (default: 10) • Lines start at each day’s open an
ForexFlipAlert
Adriano De Mello Moura
FOREX FLIP ALERT   - Show where the price will reverse with more than 95% probability. This information will help every trader to effectively open trades. The indicator on the chart draws arrows in which place and in which direction the price will reverse. The indicator   does not redraw  its arrows and shows price reversals for medium and long distances. This means that after the arrow appears, the price will go in the indicated direction for many points. Benefits of the indicator: Gives sign
BoxChart MT4
Evgeny Shevtsov
4.4 (5)
The market is unfair if only because 10% of participants manage 90% of funds. An ordinary trader has slim changes to stand against these "vultures". This problem can be solved. You just need to be among these 10%, learn to predict their intentions and move with them. Volume is the only preemptive factor that faultlessly works on any timeframe and symbol. First, the volume appears and is accumulated, and only then the price moves. The price moves from one volume to another. Areas of volume accumu
VR Grid
Vladimir Pastushak
5 (3)
O indicador VR Grid foi projetado para criar uma grade gráfica com configurações definidas pelo usuário. Ao contrário da grade padrão , a VR Grid é usada para construir níveis circulares . Dependendo da escolha do usuário, o passo entre os níveis de rodada pode ser arbitrário. Além disso, ao contrário de outros indicadores e utilitários, o VR Grid mantém a posição da rede mesmo quando o período de tempo muda ou o terminal é reiniciado. Configurações, arquivos de configuração, versões demo, instr
FREE
VWAP Bands WTC
Stefano Cocconi
5 (1)
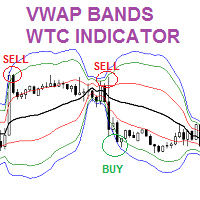
Check My Product Contact me to discover all my services  The VWAP Volume weighted Average Price Bands indicator is similar to the Moving Averages and Bollinger bands. In this indicator, more weight is given to the volume. The indicator provides great insight on support and resistance levels in the chart. Moreover, the indicator shows the fair value of a trading instrument. Thus, enabling forex traders to identify great trading opportunities to BUY LOW and SELL HIGH. Forex traders can combine t
Market Viewer
Matimu Romeo Ngoveni
Market Viewer This utility seeks to assist the trader in identifying potential areas of interest on the price chart. Different components integral to decision making have been automated, allowing the user to engage with perfectly calculated levels. Some components include the weeks initial balance, session Min and Max areas and a round number indicator altogether forming templates providing confidence to the trader. Have a look at the screenshots for a sneak peak into the components. The utility
Blahtech Supply Demand
Blahtech Limited
4.58 (36)
Was: $299  Now: $149   Supply Demand uses previous price action to identify potential imbalances between buyers and sellers. The key is to identify the better odds zones, not just the untouched ones. Blahtech Supply Demand indicator delivers functionality previously unavailable on any trading platform. This 4-in-1 indicator not only highlights the higher probability zones using a multi-criteria strength engine, but also combines it with multi-timeframe trend analysis, previously confirmed swings
Horizontal tick volumes (HTV) Horizontal tick volumes - an easy and convenient indicator of a horizontal market profile in a user-selected time. Produces a visual image of strong trading levels by maximum peaks past volumes and trading direction by color (sell or buy), and also allows you to detect smaller trading levels by differentiating past volumes. In the "Optimal" mode, when displayed on chart periods up to and including "M30", the data of one-minute bars are used, on H1 and H4 - five-minu
SmartSignal Sniper
Ahmed Ismail Muhammad Ismail Al Talhat
SmartSignal Sniper: Seu Companheiro de Trading Definitivo Descubra o poder do trading preciso com o SmartSignal Sniper. Projetado para fornecer sinais de compra e venda precisos, esta ferramenta avançada permite que traders de todos os níveis naveguem pelos mercados financeiros com confiança e clareza. Recursos Principais: Precisão Milimétrica: O SmartSignal Sniper utiliza algoritmos avançados para fornecer sinais precisos de compra e venda, ajudando os traders a identificar oportunidades lucrat
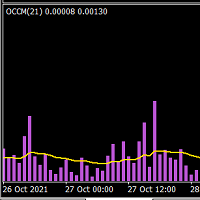
This indicator is suited for who is looking to grasp the present and past market volatility. You can apply this indicator to any instrument, you will be able to understand when the market is moving sideways and when it's pickinp up momentum. The embedded moving average allows you to filter bad trade signals. You can tweak the moving average to reach its maximum potential. As I have highlighted in the screenshot when the moving average is above the histogram the price tends to move sideways crea
Este indicador é baseado na transformada discreta de Hartley. O uso dessa transformação permite aplicar diferentes abordagens ao processar séries temporais financeiras. Uma característica distintiva deste indicador é que suas leituras não se referem a um ponto no gráfico, mas a todos os pontos do período do indicador. Ao processar uma série temporal, o indicador permite selecionar vários elementos da série temporal. A primeira possibilidade de filtragem baseia-se nesta abordagem - todos os comp
VolumeProfile
Robert Hess
3.8 (5)
Descption: The Volume Profile displays detailed informations of historical trading activities at certain price levels (Market Profile). So you can locate the areas with the best prices in the market and get an advantage about other market participants. Features: Customizable Volume Profile / Market Profile Shows the "fair" Value Area with 70% of all Volume Shows critical low volume zones Shows VPOC, VAL and VAH Points Works on all timeframes Also available for MT5 ( https://www.mql5.com/en/mark
Volume Profile Indicator for MT4 Gain a trading edge with the "Volume Profile" indicator for MetaTrader 4 (MT4). This advanced technical analysis tool allows you to precisely identify key support and resistance levels based on transaction volume. Easily visualize market areas of high interest, where trading volumes are highest, and use this information to make more informed trading decisions. Key Features: Clear and detailed visualization : The indicator displays volume histograms directly on th
Indicator (includes Volume Profile + Order Blocks) - a revolutionary indicator that combines two of the most powerful concepts of modern technical analysis: volume profiles and institutional players' order blocks. This tool allows you to see what is hidden from most traders and gives you a significant advantage in the market. Key benefits of the indicator: Visualization of "smart money": Clearly shows the areas of concentration of large players, highlighting areas with maximum volume in bright
Forex Volume MT4
KEENBASE SOFTWARE SOLUTIONS
KT Forex Volume exibe o volume de compra e venda de um par de moedas na forma de um histograma colorido. O volume é composto por transações de compra e venda de um ativo. No mercado Forex: Se o volume de compra for maior que o de venda, o preço do par de moedas tende a subir. Se o volume de venda for maior que o de compra, o preço do par de moedas tende a cair. Recursos Evite operações ruins confirmando-as com dados de volume por tick. Ajuda você a operar na direção dos grandes players do merca
The Time Segmented Volume (TSV) is a technical indicator that measures the volume of a financial instrument within specific time segments. It helps traders identify buying and selling pressure based on volume analysis. The TSV indicator can be used as part of a trading strategy to generate trade signals and confirm market trends. Let's explore how to use the TSV indicator as a trading strategy. To begin, add the TSV indicator to your trading platform. The TSV is typically represented as a line o
Daily Candle Predictor é um indicador que prevê o preço de fechamento de uma vela. O indicador destina-se principalmente ao uso em gráficos D1. Este indicador é adequado tanto para negociação forex tradicional quanto para negociação de opções binárias. O indicador pode ser usado como um sistema de negociação autônomo ou pode atuar como um complemento ao seu sistema de negociação existente. Este indicador analisa a vela atual, calculando certos fatores de força dentro do próprio corpo da vela, be
Este é um indicador de tendência. O indicador reflete milhares de mudanças nos preços de mercado usando uma linha real vermelha e verde. A mudança na cor da linha real indica que o mercado mudou e é altamente provável que haja uma reversão! A linha verde indica que o preço de mercado está em um período de alta. A linha vermelha indica que o preço de mercado está em um período de baixa.
The Chaikin Oscillator is a technical indicator developed by Marc Chaikin that combines price and volume data to measure the accumulation and distribution of a financial instrument. It aims to identify potential buying and selling opportunities in the market. The Chaikin Oscillator is calculated by subtracting a 10-day exponential moving average of the Accumulation Distribution Line (ADL) from a 3-day exponential moving average of the ADL. Here's how to use the Chaikin Oscillator indicator in tr
Os compradores deste produto também adquirem
M1 Sniper
Oleg Rodin
5 (12)
O M1 SNIPER é um sistema indicador de negociação fácil de usar. É um indicador de seta projetado para o período M1. O indicador pode ser usado como um sistema independente para scalping no período M1 e pode ser usado como parte do seu sistema de negociação existente. Embora este sistema de negociação tenha sido projetado especificamente para negociação no M1, ele também pode ser usado em outros períodos. Originalmente, desenvolvi este método para negociar XAUUSD e BTCUSD. Mas considero-o útil ta
Trend indicator AI
Ramil Minniakhmetov
5 (45)
O indicador Trend Ai é uma ótima ferramenta que irá melhorar a análise de mercado de um trader, combinando a identificação de tendências com pontos de entrada acionáveis e alertas de reversão. Este indicador permite que os usuários naveguem pelas complexidades do mercado forex com confiança e precisão Além dos sinais primários, o indicador Trend Ai identifica pontos de entrada secundários que surgem durante retrações ou retrações, permitindo que os comerciantes capitalizem as correções de preço
Gann Made Easy
Oleg Rodin
4.82 (138)
Gann Made Easy é um sistema de negociação Forex profissional e fácil de usar, baseado nos melhores princípios de negociação usando a teoria do sr. W. D. Gann. O indicador fornece sinais precisos de COMPRA e VENDA, incluindo níveis de Stop Loss e Take Profit. Você pode negociar mesmo em movimento usando notificações PUSH. Entre em contato comigo após a compra! Vou compartilhar minhas dicas de negociação com você e ótimos indicadores de bônus de graça! Provavelmente você já ouviu muitas vezes sobr
Scalper Inside PRO
Alexey Minkov
4.7 (69)
An exclusive indicator that utilizes an innovative algorithm to swiftly and accurately determine the market trend. The indicator automatically calculates opening, closing, and profit levels, providing detailed trading statistics. With these features, you can choose the most appropriate trading instrument for the current market conditions. Additionally, you can easily integrate your own arrow indicators into Scalper Inside Pro to quickly evaluate their statistics and profitability. Scalper Inside
Dynamic Forex28 Navigator
Bernhard Schweigert
5 (6)
Dynamic Forex28 Navigator - A ferramenta de negociação Forex de última geração. ATUALMENTE 49% DE DESCONTO. Dynamic Forex28 Navigator é a evolução dos nossos indicadores populares de longa data, combinando o poder de três em um: Indicador Advanced Currency Strength28 (695 avaliações) + Advanced Currency IMPULSE com ALERTA (520 avaliações) + Sinais CS28 Combo (Bônus). Detalhes sobre o indicador https://www.mql5.com/en/blogs/post/758844 O que o Next-Generation Strength Indicator oferece?  Tudo
Enigmera
Ivan Stefanov
5 (8)
ENIGMERA: O núcleo do mercado Importante: A demonstração do MQL5.com funciona no Strategy Tester e pode não refletir completamente a funcionalidade do Enigmera. Verifique a descrição, as capturas de tela e o vídeo para mais detalhes. Fique à vontade para me enviar uma mensagem com qualquer dúvida! O código do indicador foi completamente reescrito. A versão 3.0 adiciona novas funcionalidades e corrige erros acumulados desde o início do indicador. Introdução Este indicador e sistema de negociação
Day Trader Master é um sistema de negociação completo para day traders. O sistema é composto por dois indicadores. Um indicador é um sinal de seta para comprar e vender. É o indicador de seta que você obtém. Eu fornecerei o segundo indicador gratuitamente. O segundo indicador é um indicador de tendência especialmente projetado para ser usado em conjunto com essas setas. OS INDICADORES NÃO SE REPETEM E NÃO SE ATRASAM! A utilização deste sistema é muito simples. Você só precisa seguir os sinais de
Advanced Supply Demand
Bernhard Schweigert
4.91 (295)
Atualmente com 33% de desconto! A melhor solução para qualquer Trader Novato ou especialista! Este indicador é uma ferramenta de negociação exclusiva, de alta qualidade e acessível porque incorporamos uma série de recursos proprietários e uma nova fórmula. Com esta atualização, você poderá mostrar fusos horários duplos. Você não só será capaz de mostrar um TF mais alto, mas também mostrar ambos, o TF do gráfico, MAIS o TF mais alto: MOSTRANDO ZONAS ANINHADAS. Todos os traders de Oferta e Demanda
Trend Screener
STE S.S.COMPANY
4.79 (95)
Indicador de tendência, solução única inovadora para negociação e filtragem de tendências com todos os recursos de tendências importantes construídos dentro de uma ferramenta! É um indicador multi-timeframe e multi-moedas 100% sem repintura que pode ser usado em todos os símbolos/instrumentos: forex, commodities, criptomoedas, índices e ações. OFERTA POR TEMPO LIMITADO: O indicador Support and Resistance Screener está disponível por apenas US$ 50e vitalício. (Preço original US$ 250) (oferta este
TPSpro RFI Levels
Roman Podpora
4.85 (26)
Zonas de reversão - níveis / Zonas ativas de um jogador importante INSTRUÇÕES RUS   /   INSTRUÇÕES   ENG   /   Versão MT5 TODO COMPRADOR DESTE INDICADOR       GANHE ADICIONALMENTE   GRATUITAMENTE   : 3 meses de acesso       para sinais de negociação do serviço       SUPER SINAIS       — pontos de entrada prontos de acordo com o algoritmo TPSproSYSTEM. 3 meses de acesso       para materiais de treinamento com atualizações regulares - imersão em estratégia e crescimento profissional. Suporte 24 h
Auto Optimized Bollinger Bands – Ferramenta adaptativa de volatilidade para mercados reais O Auto Optimized Bollinger Bands é um indicador avançado para MT4 que aprimora as bandas de Bollinger clássicas, selecionando automaticamente os melhores valores de período e desvio com base em simulações históricas de negociações. Em vez de depender de configurações fixas, o indicador realiza uma otimização em tempo real com base no comportamento real do mercado, permitindo que as bandas se ajustem dinami
IQ Gold Gann Levels a non-repainting, precision tool designed exclusively for XAUUSD/Gold intraday trading. It uses W.D. Gann’s square root method to plot real-time support and resistance levels, helping traders spot high-probability entries with confidence and clarity. William Delbert Gann (W.D. Gann) was an exceptional market analyst, whose trading technique was based on a complex blend of mathematics, geometry, astrology, and ancient mathematics which proved to be extremely accurate. Download
Upper and Lower Reversal - Sistema para previsão antecipada de momentos de reversão. Permite encontrar pontos de viragem de preços nos limites dos canais de movimento de preços superiores e inferiores. O indicador nunca irá recolorir ou alterar a posição das setas de sinalização. As setas vermelhas são um sinal de compra, as setas azuis são um sinal de venda. Ajusta-se a quaisquer prazos e instrumentos de negociação O indicador não redesenha, só funciona quando a vela fecha. Existem vários tip
Easy Breakout
Mohamed Hassan
4.69 (13)
After your purchase, feel free to contact me for more details on how to receive a bonus indicator called VFI, which pairs perfectly with Easy Breakout for enhanced confluence!    Easy Breakout is a powerful price action trading system built on one of the most popular and widely trusted strategies among traders: the Breakout strategy ! This indicator delivers crystal-clear Buy and Sell signals based on breakouts from key support and resistance zones. Unlike typical breakout indicators, it levera
O sistema PRO Renko é um sistema de negociação altamente preciso especialmente concebido para a negociação de gráficos RENKO. Trata-se de um sistema universal que pode ser aplicado a vários instrumentos de negociação. O sistema neutraliza eficazmente o chamado ruído de mercado, dando-lhe acesso a sinais de inversão precisos. O indicador é muito fácil de usar e tem apenas um parâmetro responsável pela geração de sinal. Você pode facilmente adaptar a ferramenta a qualquer instrumento de negocia
TREND HARMONY MT4 –  Multi Timeframe Trend and Phase and Pullback Level Visualizer indicator for Metatrader4 The TREND HARMONY indicator automates deep trend analysis and generates visualizations for you. Take control of your trades by eliminating uncertainty! Revolutionize your trading experience with precision and insight through the TREND HARMONY Multi Timeframe Trend Indicator – your ultimate MT4 trend visualization indicator. Are you tired of missing trading opportunities or consistently e
TPSproTREND PrO
Roman Podpora
4.65 (23)
VERSION MT5        —        ИНСТРУКЦИЯ RUS           —        INSTRUCTIONS  ENG Principais funções: Sinais de entrada precisos SEM RENDERIZAÇÃO! Se aparecer um sinal, ele permanece relevante! Esta é uma diferença importante em relação aos indicadores de redesenho, que podem fornecer um sinal e depois alterá-lo, o que pode levar à perda de fundos depositados. Agora você pode entrar no mercado com maior probabilidade e precisão. Também existe a função de colorir as velas após o aparecimento da se
Hydra Trend Rider is a non-repainting, multi-timeframe trend indicator that delivers precise buy/sell signals and real-time alerts for high-probability trade setups. With its color-coded trend line, customizable dashboard, and mobile notifications, it's perfect for traders seeking clarity, confidence, and consistency in trend trading. Download the Metatrader 5 Version Read the User Manual here. HURRY!  Price  increasing soon! Read the product description carefully before purchasing the product. 
IQ FX Gann Levels a precision trading indicator based on W.D. Gann’s square root methods. It plots real-time, non-repainting support and resistance levels to help traders confidently spot intraday and scalping opportunities with high accuracy. William Delbert Gann (W.D. Gann) was an exceptional market analyst, whose trading technique was based on a complex blend of mathematics, geometry, astrology, and ancient mathematics which proved to be extremely accurate. Download the Metatrader 5 Version M
Apollo Secret Trend é um indicador de tendência profissional que pode ser usado para encontrar tendências em qualquer par e período de tempo. O indicador pode facilmente se tornar seu principal indicador de negociação, que você pode usar para detectar tendências de mercado, não importa qual par ou período de tempo você prefira negociar. Ao usar um parâmetro especial no indicador, você pode adaptar os sinais ao seu estilo de negociação pessoal. O indicador fornece todos os tipos de alertas, inclu
Gold Stuff
Vasiliy Strukov
4.85 (262)
Gold Stuff-um indicador de tendência projetado especificamente para o ouro, também pode ser usado em qualquer instrumento financeiro. O indicador não é redesenhado ou atrasado. O timeframe recomendado é H1. O EA Gold Stuff Expert Advisor está escrito neste indicador, você pode encontrá-lo no meu perfil. Importante! Entre em contato comigo imediatamente após a compra para obter instruções e bônus!  Você pode obter uma cópia gratuita do nosso indicador Strong Support e Trend Scanner, envie uma
Auto Optimized RSI
Davit Beridze
5 (1)
Auto Optimized RSI é um indicador de setas inteligente e fácil de usar, projetado para fornecer sinais de negociação precisos. Ele utiliza simulações de trades com dados históricos para identificar automaticamente os níveis de compra e venda de RSI mais eficazes para cada instrumento e período gráfico. Este indicador pode ser usado como um sistema de negociação independente ou como parte da sua estratégia atual. É especialmente útil para traders de curto prazo. Diferente dos níveis fixos tradici
Volatility Trend System - um sistema de negociação que dá sinais para entradas. O sistema de volatilidade fornece sinais lineares e pontuais na direção da tendência, bem como sinais para sair dela, sem redesenho e atrasos. O indicador de tendência monitora a direção da tendência de médio prazo, mostra a direção e sua mudança. O indicador de sinal é baseado em mudanças na volatilidade e mostra entradas no mercado. O indicador está equipado com vários tipos de alertas. Pode ser aplicado a vários i
Support Resistance screnner
STE S.S.COMPANY
4.95 (37)
O Support And Resistance Screener está em um indicador de nível para MetaTrader que fornece várias ferramentas dentro de um indicador. As ferramentas disponíveis são: 1. Screener de estrutura de mercado. 2. Zona de retração de alta. 3. Zona de retração de baixa. 4. Pontos de Pivô Diários 5. Pontos Pivot semanais 6. Pontos Pivot mensais 7. Forte suporte e resistência com base no padrão harmônico e volume. 8. Zonas de nível de banco. OFERTA POR TEMPO LIMITADO: O indicador de suporte e resistência
Actualmente 20% OFF ! A melhor solução para qualquer novato ou comerciante especializado! Este software de painel de instrumentos está a funcionar em 28 pares de moedas. É baseado em 2 dos nossos principais indicadores (Advanced Currency Strength 28 e Advanced Currency Impulse). Dá uma grande visão geral de todo o mercado Forex. Mostra valores avançados de força da moeda, velocidade de movimento da moeda e sinais para 28 pares de divisas em todos os (9) períodos de tempo. Imagine como a sua n
Core Principles Swing Angle Measurement   Swing angles are calculated by measuring the degree of price movement between swing highs and lows over time. Steeper angles (typically 45+ degrees) indicate stronger momentum and potentially more profitable trading opportunities. Traders use various timeframes to identify these patterns, from intraday charts to weekly swings. Momentum Confirmation   High degree swing angles often coincide with strong momentum indicators like RSI breakouts, volume spikes
Gold Pro Scalper
Aleksandr Makarov
4.8 (5)
Special offer! https://www.mql5.com/ru/users/bossik2810 Gold Pro Scalper Precise entry points for currencies, crypto, metals, stocks, indices! Indicator 100% does not repaint!!! If a signal appeared, it does not disappear! Unlike indicators with redrawing, which lead to loss of deposit, because they can show a signal, and then remove it. Trading with this indicator is very easy. Wait for a signal from the indicator and enter the deal, according to the arrow  (Blue arrow - Buy, Red - Sell).
Gartley Projection D
Oleksandr Medviediev
3.71 (7)
The indicator identifies the harmonic patterns (XABCD) according to developments of H.M.Gartley ( "Profits in the Stock Market" , 1935г). It projects D-point as a point in the perspective projection (specify ProjectionD_Mode = true in the settings). Does not redraw. When a bar of the working timeframe closes, if the identified pattern point has not moved during Patterns_Fractal_Bars bars, an arrow appears on the chart (in the direction of the expected price movement). From this moment on, the ar
Currency Strength Wizard é um indicador muito poderoso que fornece uma solução completa para uma negociação bem-sucedida. O indicador calcula o poder deste ou daquele par forex usando os dados de todas as moedas em vários intervalos de tempo. Esses dados são representados em uma forma de índice de moeda fácil de usar e linhas de energia de moeda que você pode usar para ver o poder desta ou daquela moeda. Tudo o que você precisa é anexar o indicador ao gráfico que deseja negociar e o indicador mo
Quantum Breakout Indicator PRO
Bogdan Ion Puscasu
4.96 (24)
Apresentando       Quantum Breakout PRO   , o inovador Indicador MQL5 que está transformando a maneira como você negocia Breakout Zones! Desenvolvido por uma equipe de traders experientes com experiência em negociação de mais de 13 anos,   o Quantum Breakout PRO   foi projetado para impulsionar sua jornada comercial a novos patamares com sua estratégia inovadora e dinâmica de zona de rompimento. O Quantum Breakout Indicator lhe dará setas de sinal em zonas de breakout com 5 zonas-alvo de lucro
Mais do autor
Supply demand zone with added Alerting system. Why this supply demand indicator is different? Zones are not traditional zones. these are KIRI zones. these are high probability zones where market reacts no matter how much. Most people including me have been missed out of trade because we somehow got distracted. no worries, i have added an alert to our zones now. (Metatrader doesn't show alerts in strategy tester) Most people dont know when to enter the market when it comes to zone based trading.
EURUSD EA tested over 25 years from 2000 till today Pure price + time + quant mathematics. Please make " Enable Auto-algo selection based on broker " this flag to true before you test. You will not find a single EA on this platform that has been tested for such big data, all EAs here are martingales that fails no matter what and when they fail you lose it all. Message me if you need any help or if you are not able to regenerate the same results. Indicator setting :  Make sure you have enabled t
EURUSD EA tested over 25 years from 2000 till today Pure price + time + quant mathematics. Please make " Enable Auto-algo selection based on broker " this flag to true before you test. You will not find a single EA on this platform that has been tested for such big data, all EAs here are martingales that fails no matter what and when they fail you lose it all. Message me if you need any help or if you are not able to regenerate the same results. Indicator setting :  Make sure you have enabled th
Here is the V3 of perfect market structure. Whats new? Coded based on ICT rules. No more trend confusions...-- Added labels to show current trend No more timeframe juggling and missing out important points, -- Now You can add indicator multiple times to mark multi timeframe market  structure on the same chart window( 1D market structure on 4H or may be 4H market  structure on 15 min timeframe and more.....) No more waiting in large range as sometimes market makes huge ranges and starts making im
3 Trading Strategies to Exploit Market Structure (Without Overcomplicating It) Trading isn’t about predicting the future—it’s about spotting patterns, managing risk, and acting when odds favor you. Below are two timeless strategies (and one hybrid) that align with how markets   actually   move, not how we wish they would. Some of the strategies you can trade with the indicator [ Note] Higher timeframe should be 15x of the lower timeframe, for eg. htf 15min, ltf 1min. 1. The Breakout Trap: Trad
This is the finest structure marking you will ever find in any market. indicator is coded considering the actual structure any trader would use. indicator is coded based on actual candle breaks and not coded based on any pivot or predefined values or specific number of candles high and low. please check out the screenshot. if you want me to fine tune it according to your needs then i am open for it. Thank you :)
V2 of the Perfect structure. What's Inherited from v1? This is the finest structure marking you will ever find in any market. Indicator is coded considering the actual structure any trader would use. Indicator is coded based on actual candle breaks and not coded based on any pivot or predefined values or specific number of candles high and low. Please check out the screenshot. What's new in V2? AI based approach for High accuracy by calculating maximum bars with rapid switch algorithm. Dual tim
Zone + Trend Reversal System There are many many situations you may want to use this indicator and you may not want to. Please refer the doc attached in the comment section for complete guidance. Check comments for manual. Keep in mind, Once you make the purchase please reach out to me when you are in the testing phase so i could answer your queries when you are stuck and confused because most of the time we fail because we keep going in a wrong direction without asking for the help. Read the m
RD Range System V3
Rahul Shrikrishna Dani
About the indicator  You have price range limit (red lines) that is calculated based on previous range.  You have signal (yellow star) that indicates the end of swing. When price hits the price range upper or lower limit and generates swing end signal (yellow star) then you trade for reversal. Now there are rules, you can't just simply trade, read the manual i have attached in the comments. Note that, Indicator works with all pairs and with every timeframe. While testing in strategy tester it t
FVG that is only marked above(downtrend)/below(uptrend) 50% retracement with ICT market structure. Strategy 1: False Break + FVG Confluence Setup: structure breaks -> market goes to fvg -> returns back and continue its journey marking it as a false break. fvg above 50% retracement is a very strong unfilled area which always reacts to price. Entry Rules: Enter when price hits the FVG after the false break Wait for structure to change (downtrend close : when red candle closes below swing low and
SMT aka correlation divergence between EURUSD and Strategy: False Break + SMT Setup: Structure breaks -> market structure creates smt -> structure breaks and returns to 50% level. SMT makes it a high probability trade. for low risk high reward use 1H:5Min, 4H:15Min, 1D:1H timeframes, one to find false break, other to find out SMT and structure break.  stop loss should always be at the top of the structure start(in lower timeframe when price touches false break and breaks the structure) and not a
Pair correlation divergence. Define your pair in indicator setting with this format : SYMBOL1:SYMBOL2,SYMBOL3:SYMBOL4 Already Defined Symbols : EURUSD:GBPUSD,AUDUSD:NZDUSD,USDCHF:EURUSD,USDCAD:Crude,XAUUSD:AUDUSD Symbol name should match the exact case as you see it in left panel where all symbols are listed. (Indicator will not work on strategy tester, strategy tester fail to load different symbols data internally, watch video for functional usage) CAUTION   : If you drag any symbol on screen
V2 of the Perfect structure. What's Inherited from v1? This is the finest structure marking you will ever find in any market. Indicator is coded considering the actual structure any trader would use. Indicator is coded based on actual candle breaks and not coded based on any pivot or predefined values or specific number of candles high and low. Please check out the screenshot. What's new in V2? AI based approach for High accuracy by calculating maximum bars with rapid switch algorithm. Dual tim
3 Trading Strategies to Exploit Market Structure (Without Overcomplicating It) Trading isn’t about predicting the future—it’s about spotting patterns, managing risk, and acting when odds favor you. Below are two timeless strategies (and one hybrid) that align with how markets   actually   move, not how we wish they would. Some of the strategies you can trade with the indicator [ Note] Higher timeframe should be 15x of the lower timeframe, for eg. htf 15min, ltf 1min. 1.  The Breakout Trap: Trad
Pair correlation divergence. Define your pair in indicator setting with this format : SYMBOL1:SYMBOL2,SYMBOL3:SYMBOL4 Already Defined Symbols : EURUSD:GBPUSD,AUDUSD:NZDUSD,USDCHF:EURUSD,USDCAD:Crude,XAUUSD:AUDUSD Symbol name should match the exact case as you see it in left panel where all symbols are listed. CAUTION  : If you drag any symbol on screen and indicator doesn't paint(live mode, not strategy tester) then just  Right click-> indicators list-> select divergence indicator-> edit-> ok-
Filtro:
Sem comentários
Responder ao comentário