SMC setup 05 Minor OB and Trend Proof
- Indikatoren
-
Minh Truong Pham
 Hello, my name is Pham and I am a programmer and trader! At here, I create amazing forex indicators and expert advisors for Metatrader.
I will try:
+ Provide best tools base on my 5 years experience as a trader and 10 years as a programmer. - Version: 1.0
- Aktivierungen: 15
🔵Einführung
Das "Smart-Money-Konzept" geht über den Bereich rein technischer Handelsstrategien hinaus und stellt eine umfassende Philosophie über die Dynamik der Marktvorgänge dar. Es geht davon aus, dass wichtige Marktteilnehmer Preismanipulationen vornehmen und dadurch die Handelslandschaft für kleinere Einzelhändler erschweren.
Nach dieser Doktrin wird Einzelhändlern empfohlen, ihre Strategien auf die Manöver des "Smart Money" abzustimmen - im Wesentlichen das Kapital, das von den Marktmachern eingesetzt wird.
Zu diesem Zweck sollte man sich bemühen, die Handelsmuster dieser einflussreichen Marktteilnehmer nachzuahmen, die sich geschickt durch die Nuancen von Angebot, Nachfrage und der allgemeinen Marktstruktur bewegen. Als Befürworter des Smart-Money-Handels sind diese Elemente bei der Entscheidungsfindung für den Einstieg in den Handel von zentraler Bedeutung.
🟣KeyInsights
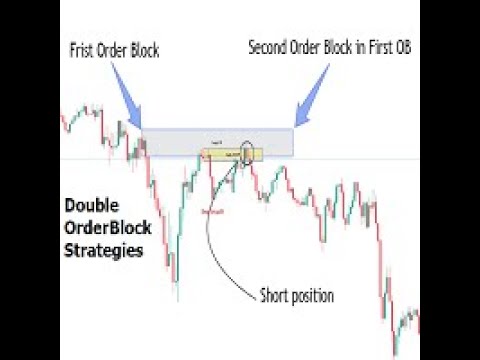
Das Kernprinzip dieser Strategie beruht auf der Irreführung anderer Händler. Eine plötzliche Marktbewegung gegen den vorherrschenden Trend, die entweder zur Bildung eines tieferen Tiefs oder eines höheren Hochs führt, gefolgt von einem Pullback, bei dem ein Divergenzmuster entsteht, bereitet die Bühne.
Anschließend kann der Markt ein weiteres tieferes Tief oder höheres Hoch bilden. Händler, die davon überzeugt sind, dass der Markt die neue Bewegung fortsetzen wird, werden überrascht, wenn der Kurs abrupt die Richtung wechselt. Nach einem "Stop Hunt" der offenen Positionen der Händler nimmt der Markt seinen anfänglichen Trend wieder auf.
Um das Wesen dieses Setups zu verstehen, beachten Sie die folgenden Abbildungen.
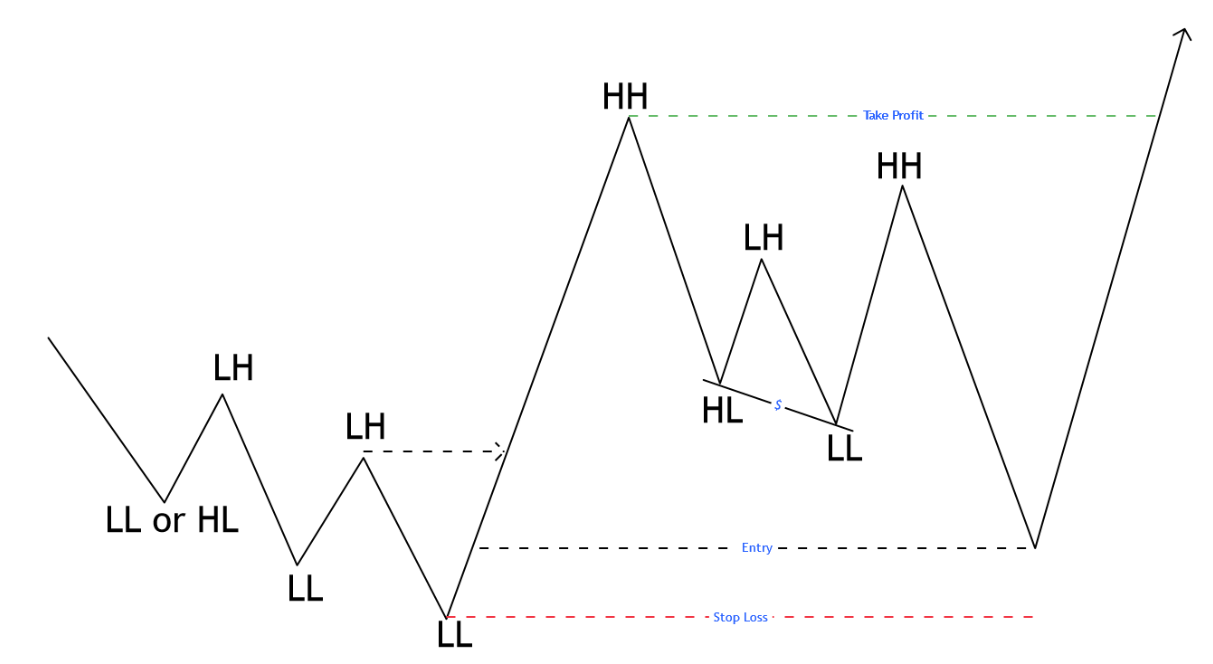
"Bullish Setup" - Abbildung 2
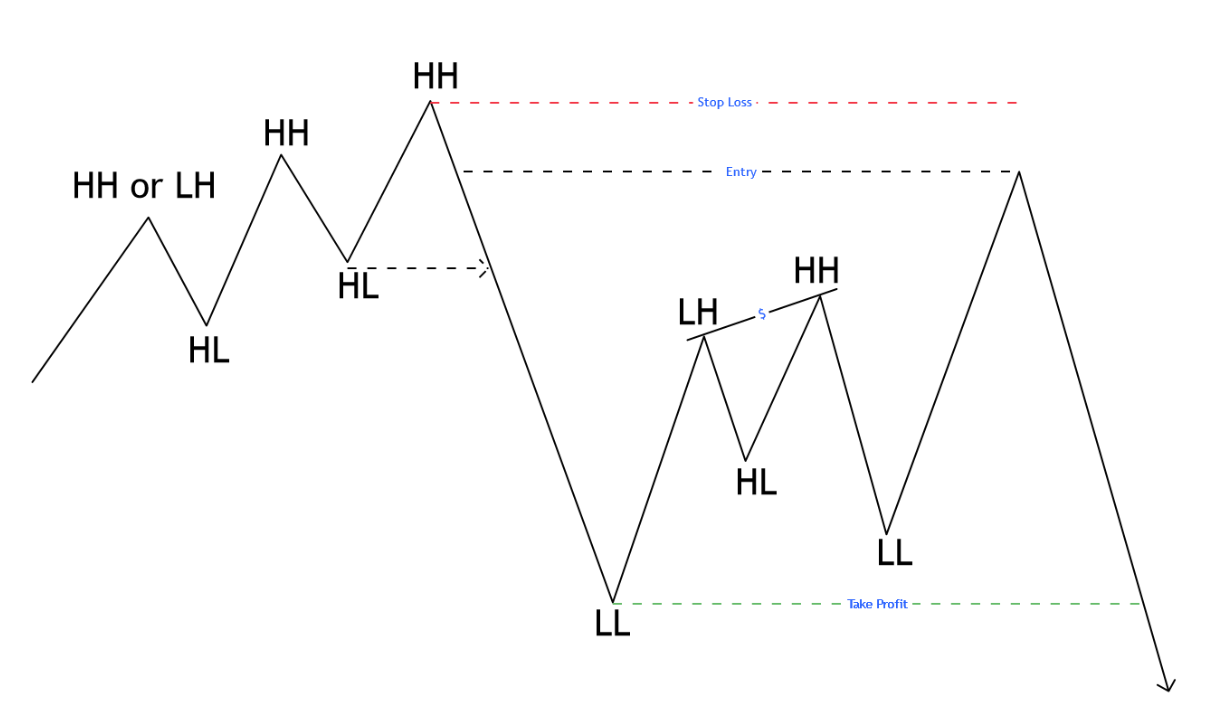
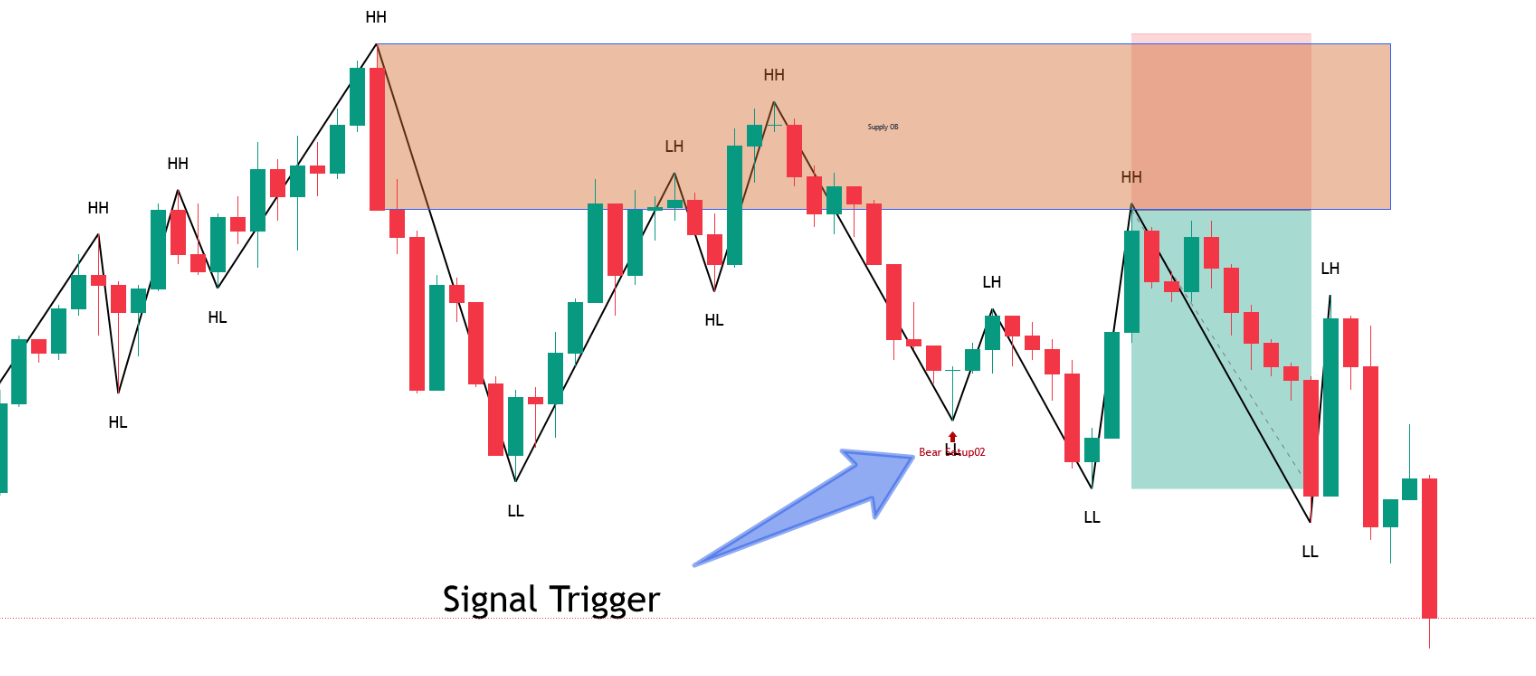
"Bearish Setup" - Abbildung 3
🔵Howto Use
Die Setups können auf der Grundlage der gewünschten Formationsperiode angepasst werden. Diese Anpassung kann über die Preiseinstellungsoptionen des Indikators vorgenommen werden, wo die Standardperiode auf 2 eingestellt ist.
Nachdem Sie Ihre bevorzugte Periode konfiguriert haben, werden die Signale umsetzbar. Sobald sich ein Setup gebildet hat, besteht der nächste Schritt darin, darauf zu warten, dass der Preis den "Orderblock" erreicht.
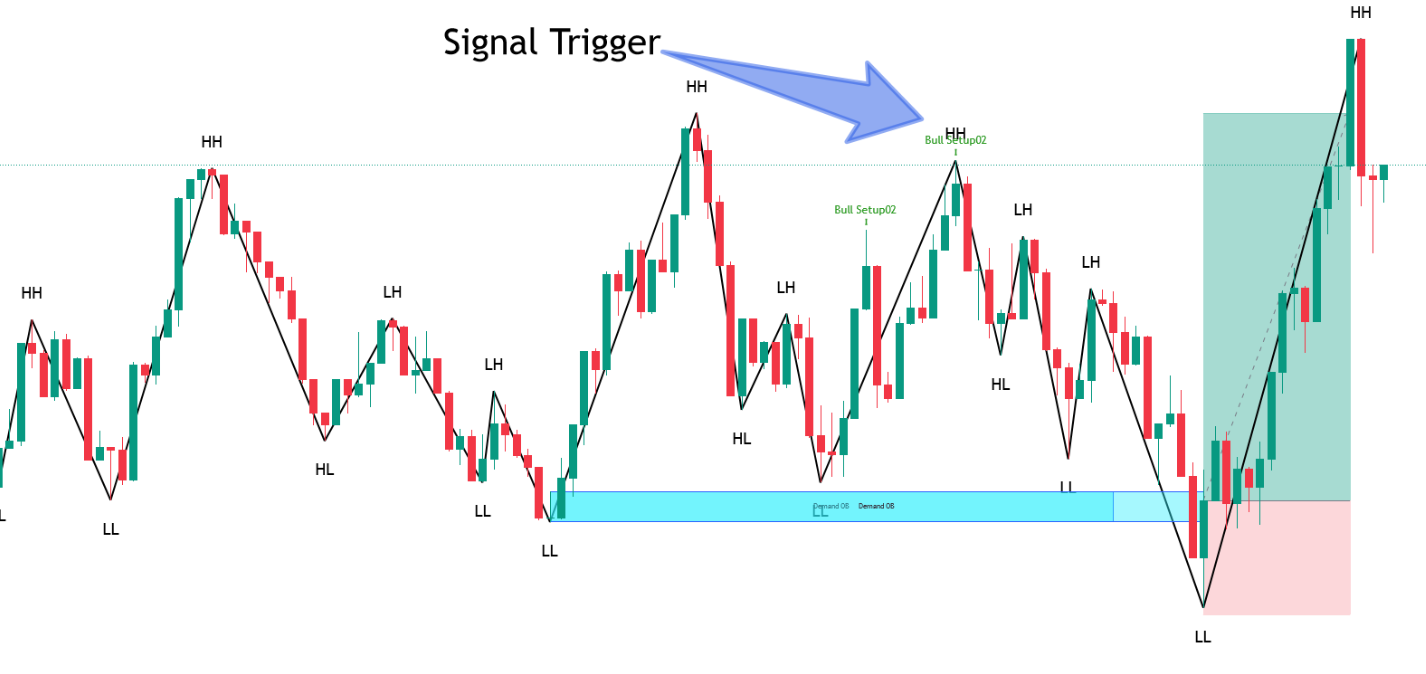
"Bullish Setup" - Abbildung 4
Wenn eine bullische Struktur erkannt wird, findet der Indikator automatisch den OB am niedrigsten Punkt (LL) und "rayright" den OB. Ein Kaufsignal wird ausgelöst, wenn der Preis diesen OB erneut testet. Der Indikator sendet eine Benachrichtigung an den Benutzer, wenn die Struktur erkannt wurde und ein Kaufsignal erfolgt ist.
Das Modell wird ungültig, wenn der Schlusskurs unter dem Tiefpunkt des OB liegt.
"Bearish Setup" Abbildung 5
Wenn eine bärische Struktur erkannt wird, findet der Indikator automatisch den OB am niedrigsten Punkt (LL) und "rayright" OB. Ein Verkaufssignal wird ausgelöst, wenn der Preis diesen OB erneut testet. Der Indikator sendet eine Benachrichtigung an den Benutzer, wenn die Struktur erkannt wurde und ein Kaufsignal erfolgt.
Das Modell wird ungültig, wenn der Schlusskurs höher als der obere Teil des OB ist.
🔵Einstellungen
- Pivot-Periode: die wichtigste Einstellung, die die Länge des Pivot-Punktes (links und rechts) definiert. Unterschiedliche Periode wird unterschiedliches Modell erkannt.
- Rückblicksnummer: der Verlaufsbalken wird zum Zeitpunkt des Starts berechnet.
- Pivotpunkt anzeigen oder hoch, wenn ein Modell vorhanden ist
- Alarmeinstellung (wenn bullisches Setup erkannt wird und wenn der Preis OB - Entry testet)
- Präfix: das Präfix des Objekts, das im Chart angezeigt wird.
Die gemeinsame Schwäche der Indikatoren, die automatisch Muster gemäß der SMC-Strategie erkennen, ist, dass sie eine feste Länge benötigen, um den Pivot-Punkt zu bestimmen. Bei unterschiedlichen Längenwerten werden "HH", "LL", "LH", "HL" unterschiedlich sein, das strukturell erkannte Modell wird unterschiedlich sein.
Um die oben genannten Schwächen zu überwinden, habe ich das Konzept des Präfixes eingeführt. Mit verschiedenen Präfixen können Benutzer mehrere Indikatoren auf demselben Diagramm anbringen, wobei jeder Indikator für eine andere Pivot-Länge gilt, z. B. 2, 5, 6, 7.... Auf diese Weise ist es möglich, Modelle über alle Marktstrukturen hinweg zu überwachen.
*****************************************
Häufig gestellte Fragen
Warum wird nichts auf dem Chart angezeigt, wenn ich einen Indikator lade?
https://www.youtube.com/watch?v=hW-KHHvUCWI
Wie baue ich ein Signal-Scan-System mit diesem Indikator auf?