SV Flag and Pennant pattern with alert
- Indikatoren
-
Minh Truong Pham
 Hello, my name is Pham and I am a programmer and trader! At here, I create amazing forex indicators and expert advisors for Metatrader.
I will try:
+ Provide best tools base on my 5 years experience as a trader and 10 years as a programmer. - Version: 1.0
- Aktivierungen: 5
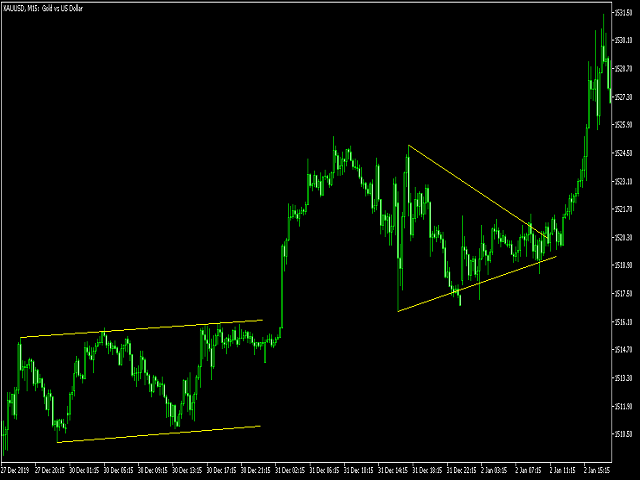
Flaggen und Wimpel können als Fortsetzungsmuster kategorisiert werden. Sie stellen in der Regel nur kurze Pausen in einem dynamischen Markt dar. Sie treten typischerweise direkt nach einer großen, schnellen Bewegung auf. Der Markt hebt dann in der Regel wieder in dieselbe Richtung ab. Untersuchungen haben gezeigt, dass diese Muster zu den zuverlässigsten Fortsetzungsmustern gehören.
Bullish Flags sind durch niedrigere Höchst- und Tiefststände gekennzeichnet, wobei das Muster gegen den Trend tendiert. Im Gegensatz zu Keilen verlaufen ihre Trendlinien jedoch parallel.
Bärenflaggen bestehen aus höheren Ober- und Unterseiten. Bärenflaggen neigen ebenfalls dazu, sich gegen den Trend zu neigen. Ihre Trendlinien verlaufen ebenfalls parallel.
Wimpel ähneln symmetrischen Dreiecken, sind aber in der Regel von geringerer Größe (Volatilität) und Dauer.
(Das Volumen schrumpft im Allgemeinen während der Pause und steigt beim Ausbruch wieder an).
Dieser Indikator scannt alle Flaggen und Wimpelmuster und warnt, wenn ein Muster gefunden wird. Der Händler muss also nicht den ganzen Tag auf den Chart schauen, um ein Muster zu finden.
Einstellungen:
+ Horizontale Steigung: ist die Horizontale des Musters. Standard ist 0.01 . Wenn das Symbol die Ziffer 2 hat, multipliziert der Indikator automatisch mit 10. Sie sollten testen, um den besten Wert zu finden.
+ Tolenz des mittleren Drehpunktes: ist die Tolenz der Drehpunkte 1-3 und 3-5. Theoretisch müssen die Pivotpunkte 1-3-5 auf einer Linie liegen, aber das ist in der Realität schwer zu erreichen. Dieser Wert ist die Tolenz des mittleren Drehpunktes (3). Wenn das Symbol die Ziffer 2 hat, multipliziert der Indikator automatisch mit 10
+ Line extend (bar): ist die Länge der Trendlinie. Standard ist 20 Balken
+ Alert: Sie können eine Benachrichtigung im Terminal, MT mobile app, Telegram einstellen.
Anmerkungen:
Um den besten Einstieg zu finden, sollte der Händler auf den Bruch des Musters, die Bestätigung des Preises und die Bestätigung des Volumens warten, um sicherzustellen, dass der Trend fortgesetzt wird!