PipTick Pairs Spread MT5
- 指标
-
Michal Jurnik
 "Talent is cheaper than table salt. What separates the talented individual from the successful one is a lot of hard work." - Stephen King. Those few words reflect myself very well. I am probably not the most talented developer in the world but I truly believe in hard work, professional attitude and
 - 版本: 1.5
- 更新: 1 十二月 2021
- 激活: 5
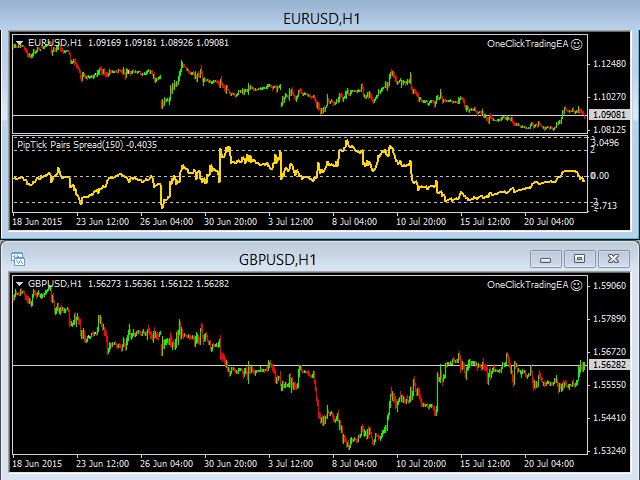
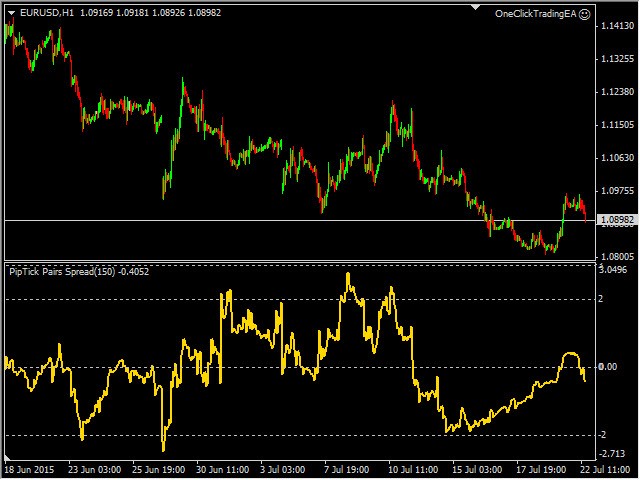
The Pairs Spread indicator has been developed for the popular strategy known as pairs trading, spread trading, or statistical arbitrage. This indicator measures the distance (spread) between prices of two directly (positively) correlated instruments and shows the result as a curve with standard deviations. So, traders can quickly identify when the instruments are too far apart and use this information for trade opportunities.
How to use the Pairs Spread indicator
Best results are attained when the trade is opened somewhere between the second and the third standard deviation.
- The indicator is between 2nd and 3rd standard deviations - SELL Pair 1, BUY Pair 2.
- The indicator is between -2nd and -3rd standard deviations - BUY Pair 1, SELL Pair 2.
Suitable currency pairs
- EURUSD vs. GBPUSD
- EURUSD vs. NZDUSD
- USDCHF vs. USDJPY
- AUDUSD vs. GBPUSD
- AUDUSD vs. EURUSD
Main features
- The indicator shows the deviations from the normal state.
- A simple comparison of the actual correlation between two currency pairs.
- The second and third standard deviations area for entering the trades.
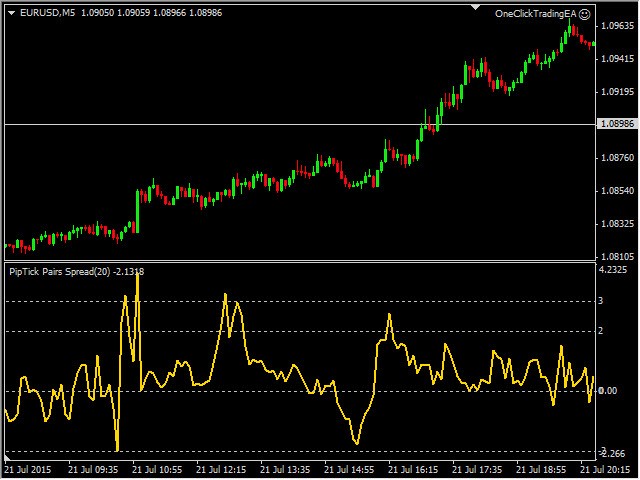
- Works on every timeframe (M1, M5, M15, M30, H1, H4, D1, W1, MN).
- The indicator is non-repainting.
- Ready for backtesting (customizable look-back period).
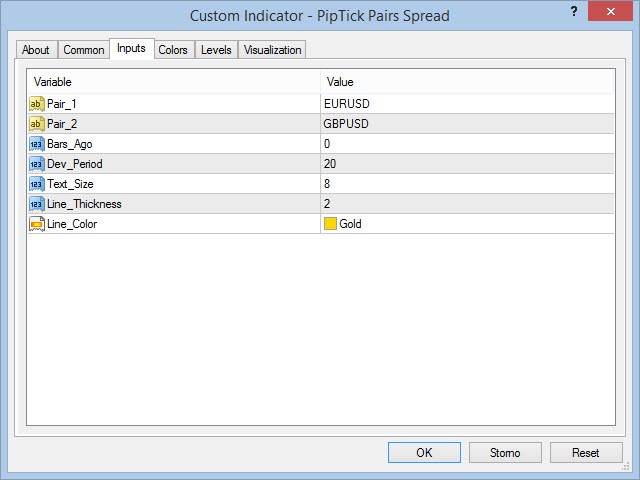
- Customizable parameters (Colors, Line thickness, Deviations period...).
- High-speed calculation.
- The indicator works with prefixes and suffixes of symbols as well (EURUSD.m, EURUSD-pro...).
- Available for MT4 and MT5.
Please visit the Pairs Spread indicator product page for the input and output parameters settings.

用户没有留下任何评级信息