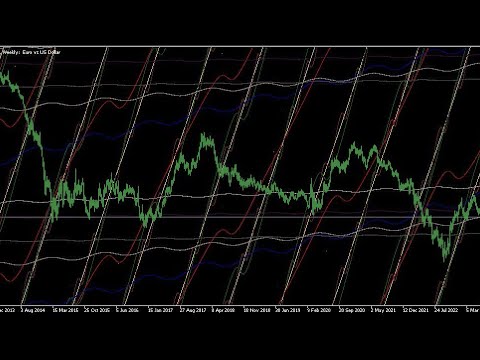
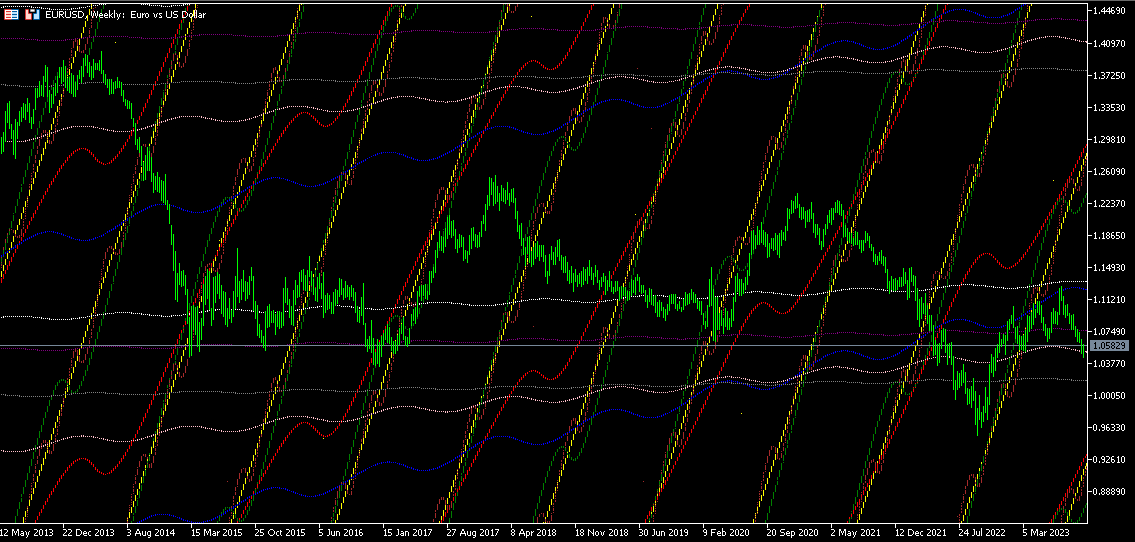
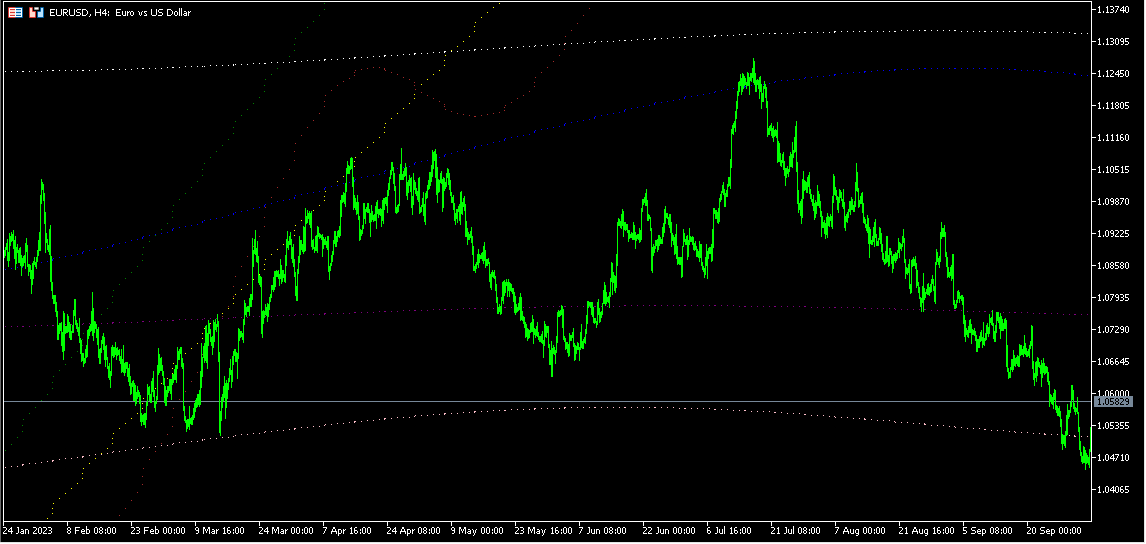
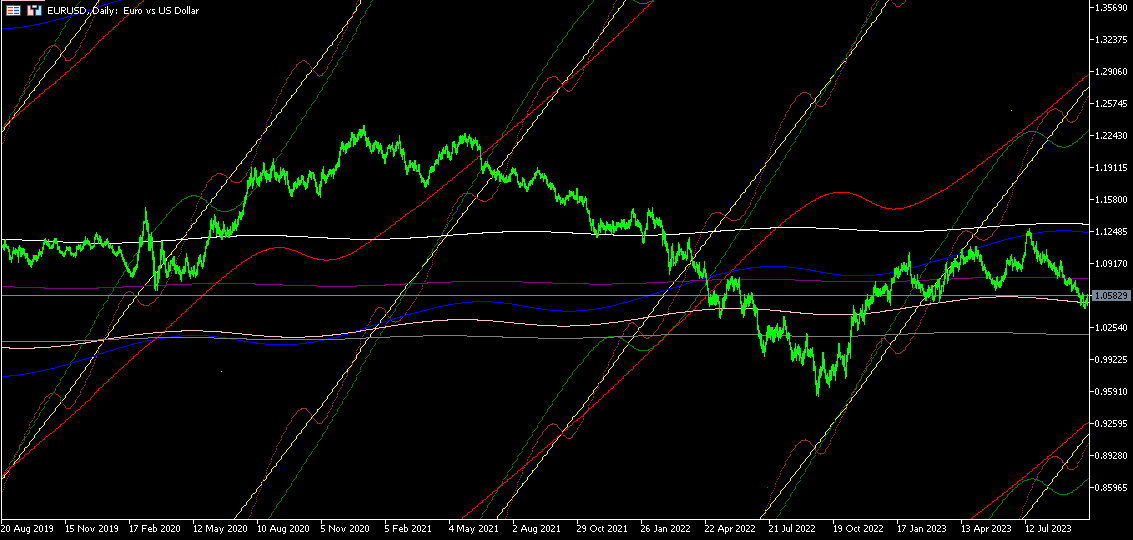
Gann Planetary Lines
- Indikatoren
- Version: 1.0
- Aktivierungen: 5

Glauben Sie, dass die Finanzmärkte und die Himmelskörper in getrennten Welten operieren? Unser Indikator ist da anderer Meinung!
Basierend auf der innovativen Theorie von William Gann, die den Einfluss der Bewegungen der Himmelskörper auf die Dynamik der Finanzmärkte betont, präsentieren wir Ihnen den "Gann Planetary Lines Indicator".
Merkmale des Indikators:
- Präzision: Genaue Projektion der 360 Grad der Planetenbahnen auf die Kurscharts.
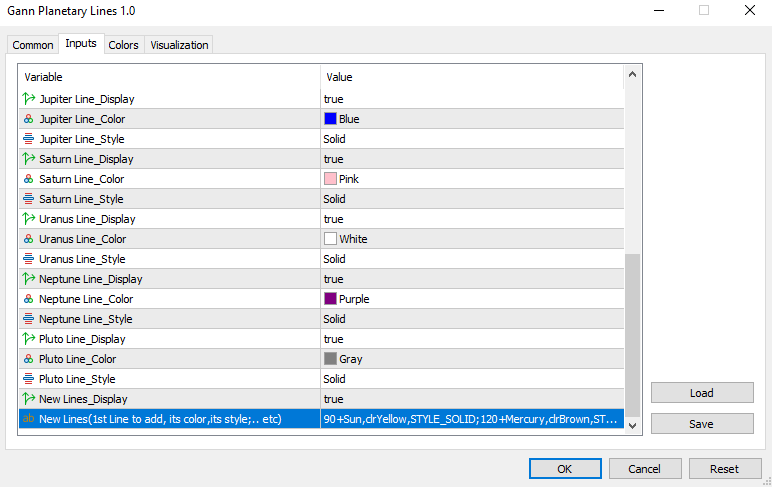
- Erweiterte Anpassungsmöglichkeiten: Möglichkeit, jede Planetenlinie ein- oder auszublenden, mit Optionen, um zusätzliche astrologische Linien zu den primären Planetenlinien hinzuzufügen.
- Eine Vielzahl von Farben und Designs: Eine Vielzahl von Optionen zur Steuerung der Farbe und des Aussehens jeder astralen Linie.
- Umfassende Abdeckung: Enthält Grundlinien für 10 Planeten: Sonne, Mond, Venus, Merkur, Mars, Jupiter, Saturn, Uranus, Neptun und Pluto.
Mit diesem Indikator basieren Ihre Handelsentscheidungen nicht nur auf der technischen Analyse, sondern auch auf einer astrologisch-strategischen Sicht der Marktbewegungen.
________________________________________________________________________________________________________
Wichtige Hinweise:-
1- Wenn Sie den Indikator in einem beliebigen Diagramm ausgeführt haben und ihn ändern möchten, sollten Sie ihn löschen und mit den gewünschten neuen Eingaben neu starten. So kann der Indikator effizienter arbeiten.
3- Wenn Sie neue Linien hinzufügen, müssen Sie sich an die oben genannte Formel halten (dies ist ein Beispiel für die Erstellung von zwei neuen Linien): 90+Sonne,clrGelb,STYLE_SOLID;120+Merkur,clrBraun,STYLE_DOT
Planetennamen : Sonne, Mond, Merkur, Venus, Mars, Jupiter, Saturn, Uranus, Neptun, Pluto
Farben : clrGelb, clrRot, clrGrün,...etc.
Stil : STYLE_SOLID, STYLE_DOT, STYLE_DASH, STYLE_DASHDOT, STYLE_DASHDOTDOT
4- Der Indikator benötigt einen Computer mit hohen Spezifikationen, um reibungslos und schnell zu funktionieren.
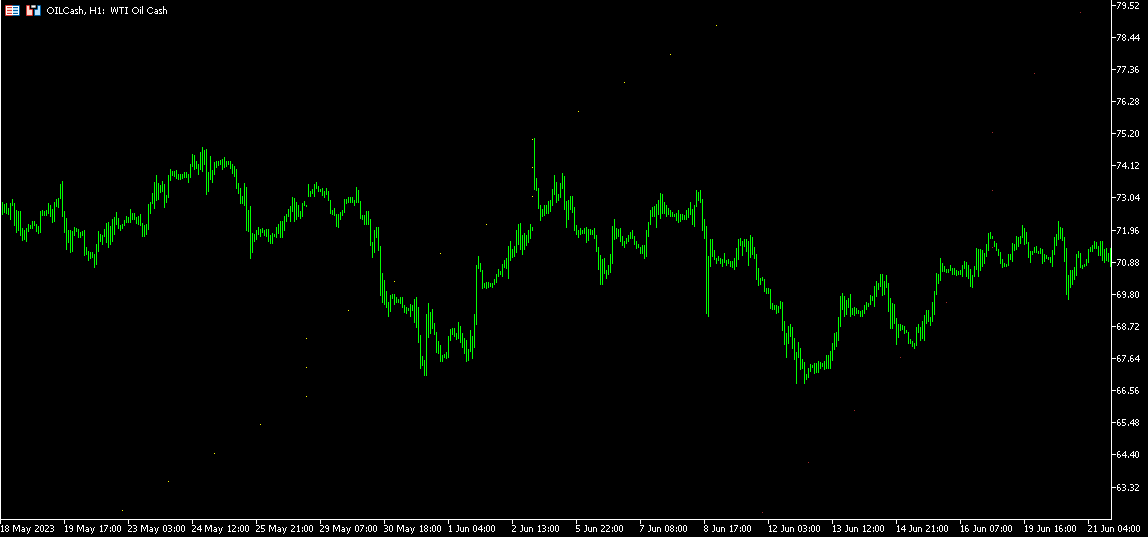
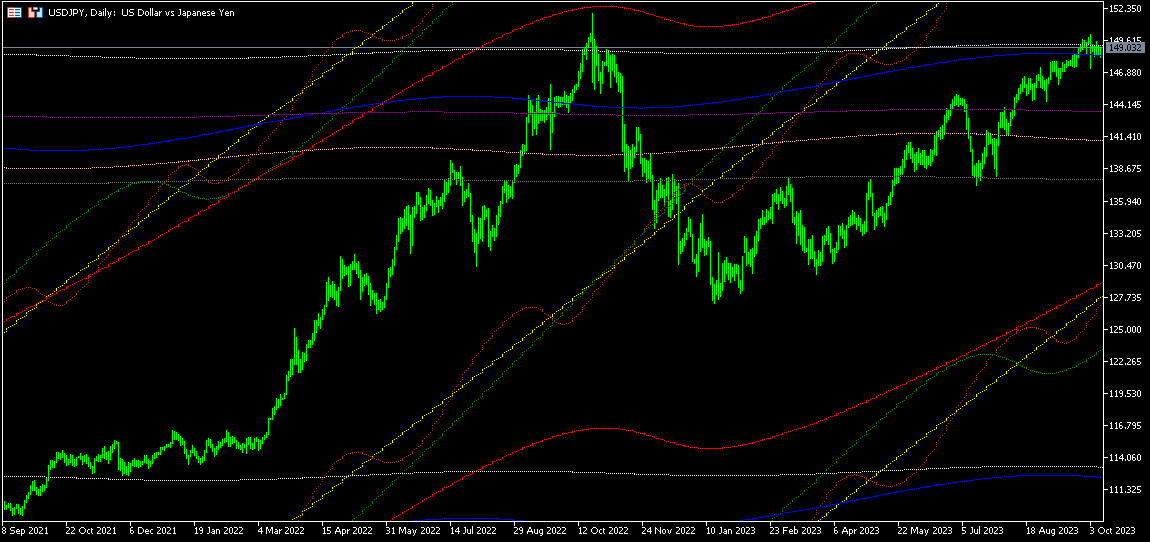
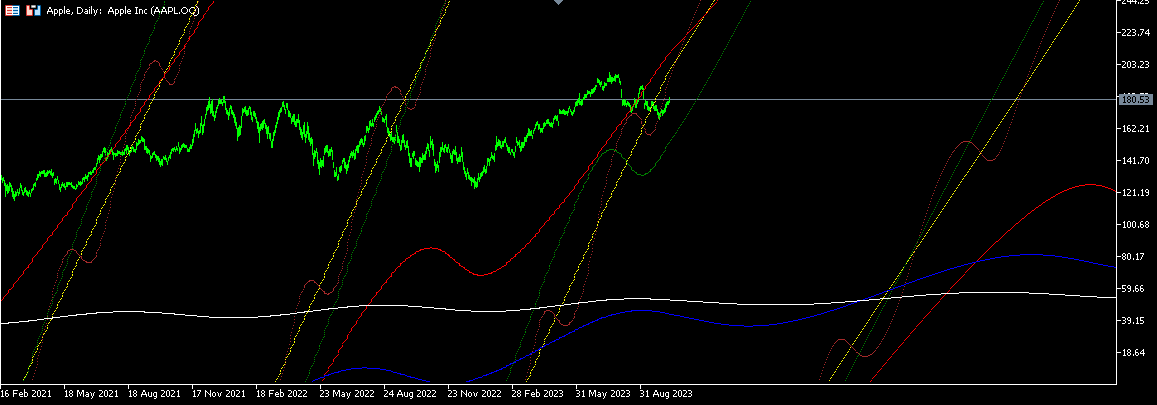
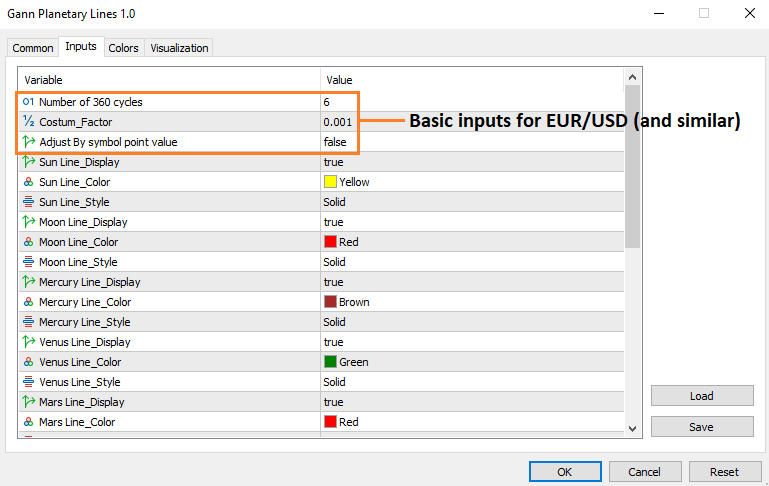
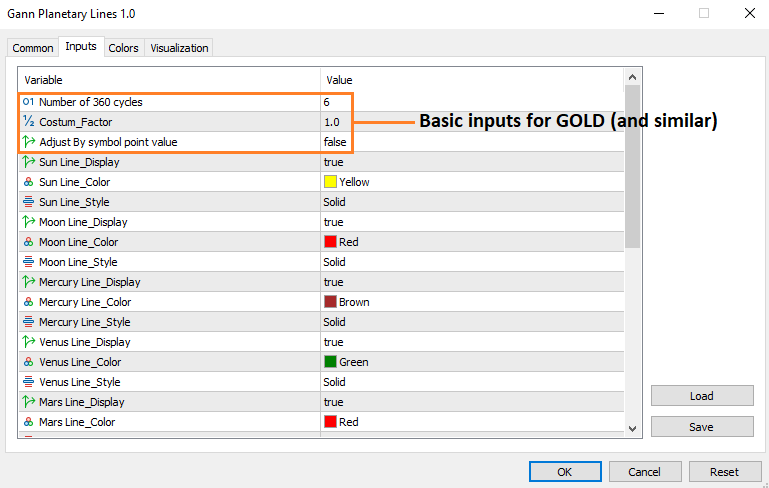
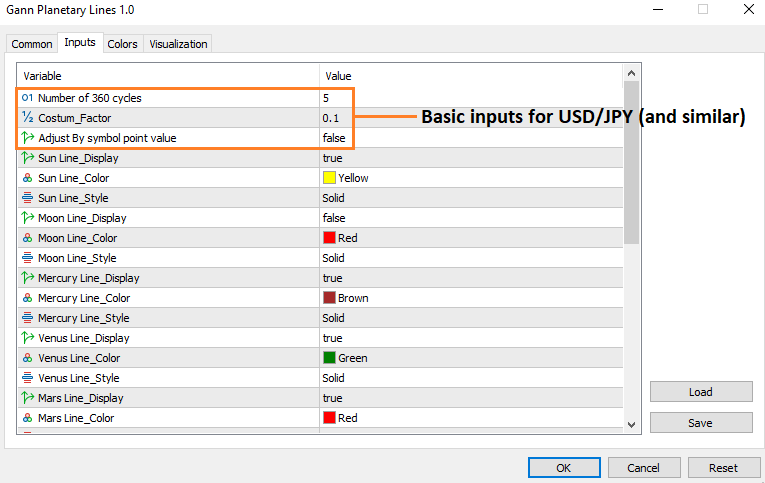
5- Die Anzahl der Zyklen hängt vom Aktienkurs ab. Zum Beispiel kann für Apple oder Öl, wenn der Preis 360 nicht überschreitet, 1 Zyklus in das Eingabefeld für Zyklen eingetragen werden. Befindet sich der Preis jedoch im sechsten Zyklus, wie z.B. bei Gold, dann müssen 6 in das Zyklenfeld eingetragen werden. Ich habe einige der grundlegenden Eingaben für einige Märkte in Bildern erklärt, die Sie überprüfen können.