Handelsroboter und Indikatoren für den MetaTrader 5 - 58

Unser Basic Support and Resistance Indikator ist die Lösung, die Sie für die Steigerung Ihrer technischen Analyse benötigen.Mit diesem Indikator können Sie Support- und Widerstandsebenen in der Tabelle projizieren/ MT4 -Version
Funktionen
Integration von Fibonacci -Ebenen: Mit der Option, Fibonacci -Werte neben Unterstützung und Widerstandsniveau anzuzeigen, gibt unser Indikator einen noch tieferen Einblick in das Marktverhalten und mögliche Umkehrbereiche.
Leistungsoptimierung: Mit der Op

Jackson Support and Resistance V ist ein leistungsfähiger Indikator für Unterstützung und Widerstand, der Signale auf der Grundlage von Preisaktionen liefert. Er soll es jedem leicht machen, Unterstützung und Widerstand zu zeichnen. Wir glauben, dass die meisten Strategien mit Unterstützung und Widerstand als Grundlage aufgebaut werden, und dass eine perfekte Unterstützung und ein perfekter Widerstand Ihre Handelsweise verändern können. Es ist flexibel für alle Instrumente. Vergessen Sie nicht,
FREE

Wenn die Preise aus den Widerstandsniveaus ausbrechen und der Momentum-Oszillator aus seinen historischen Widerstandsniveaus ausbricht, besteht die Wahrscheinlichkeit, dass die Preise weiter steigen. Es wird dringend empfohlen, den Preisausbruch mit dem Oszillatorausbruch zu bestätigen, da sie vergleichbare Auswirkungen haben wie der Preis, der die Unterstützungs- und Widerstandsniveaus durchbricht; sicherlich werden Short-Trades die gleiche Wahrnehmung haben. Das Konzept basiert darauf, Swing-
FREE

Hochgradig konfigurierbarer Macd-Indikator.
Merkmale: Hochgradig anpassbare Alarmfunktionen (bei Levels, Kreuzen, Richtungsänderungen per E-Mail, Push, Sound, Popup) Multi-Timeframe-Fähigkeit Farbanpassung (bei Pegeln, Kreuzen, Richtungsänderungen) Optionen für lineare Interpolation und Histogramm-Modus Funktioniert im Strategie-Tester im Multi-Timeframe-Modus (auch am Wochenende ohne Ticks) Einstellbare Levels Parameter:
Macd Timeframe: Sie können die unteren/höheren Zeitrahmen für Macd einst
FREE

Account Info AS ist ein leistungsstarkes Informationsskript für MetaTrader 5, das alle relevanten Informationen zu Ihrem Handelskonto direkt im Chart anzeigt. Das Skript liefert alle notwendigen Daten für die Kontoanalyse, das Risikomanagement und die Handelsentscheidung.
Hauptmerkmale Vollständige Finanzinformationen Kontotyp (Demo/Echtgeld/Wettbewerb)
Saldo, Eigenkapital und Margin
Freie Margin in bar und Prozent
Margin-Level
Aktueller Gewinn/Verlust
Risikomanagement Margin-Call- und S
FREE

1. Überblick Der Ichimoku Kinko Hyo (oder Ichimoku-Wolke) ist ein umfassender All-in-One-Indikator für die technische Analyse, der ein tiefes Verständnis der Markttrends, des Momentums und der dynamischen Unterstützungs- und Widerstandsniveaus vermittelt. Dieser Indikator bietet eine saubere, standardisierte Implementierung der fünf Ichimoku-Kernlinien. Sein Hauptmerkmal ist ein unaufdringliches Status-Dashboard , das Ihnen auf einen Blick einen Überblick über die aktuelle Marktsituation gemäß d
FREE

MaRSI Scalper & Trader Die Kombination aus gleitenden Durchschnitten und RSI Diese Einstellung ist flexibel, so dass sie im Hinblick auf den Benutzertest eingestellt werden kann verwendet 1. Für Scalping 2. Für den langfristigen Handel
Merkmale 1. Sendet Push-Benachrichtigungen 2. Sendet Benachrichtigungen an Computer 3. Zeichnet Pfeile 4. Zeichnet entsprechende Indikatoren (diese Funktion wird in Zukunft bearbeitet werden)
Feedback haben https://t.me/Tz_Trade_Logics oder rufen Sie einfach +2
FREE

Moving Average Convergence/Divergence ist ein von Gerald Appel entwickelter technischer Indikator, der in der technischen Analyse verwendet wird, um die Stärke und Richtung des Trends zu überprüfen sowie Umkehrpunkte zu identifizieren. Der im MetaTrader 5 eingebaute MACD-Indikator entspricht nicht der Idee des Autors (Gerald Appel):
- die MACD-Linie wird grafisch als Histogramm dargestellt, aber das Histogramm spiegelt die Differenz zwischen der MACD-Linie und der Signallinie wider;
- die Signa
FREE

Hochgradig konfigurierbarer Williams %R-Indikator. Merkmale: Hochgradig anpassbare Alarmfunktionen (bei Levels, Kreuzen, Richtungsänderungen per E-Mail, Push, Sound, Popup) Multi-Timeframe-Fähigkeit Farbanpassung (bei Niveaus, Kreuzen, Richtungsänderungen) Optionen für lineare Interpolation und Histogramm-Modus Funktioniert im Strategie-Tester im Multi-Timeframe-Modus (auch am Wochenende ohne Ticks) Einstellbare Levels Parameter:
Williams %R Timeframe: Sie können den aktuellen oder einen höhere
FREE

Ladder Quant EA - Multi-Session Expert Advisor The Ladder Quant EA is an advanced Expert Advisor for MetaTrader 5, designed to optimize forex trading across major market sessions. It integrates multiple strategies, including breakout, reversal, and range-bound trading, into a robust system. Tailored for major currency pairs, it combines sophisticated risk management with customizable settings. Professional Multi-Session Forex Trading Robot Version: 1.06 - Enhanced Edition Category: Expert A
FREE
Der Sandman EA - MT5 Scalping Roboter für ruhige Präzision im Chaos
"Andere haben gesehen, was ist, und gefragt, warum. Wir haben gesehen, was sein könnte, und gefragt, warum nicht." Wir stellen vor: The Sandman - ein hochpräziser, nüchterner MT5-Scalping-Roboter, der Ruhe und Kontrolle in Ihr Handelserlebnis bringt. Überblick Der Markt ist chaotisch und unberechenbar - selbst erfahrene Trader müssen mit Verlusten rechnen. Der Sandman wurde entwickelt, um Sie vom emotionalen Handel zu befreien.
FREE

Gold Swing Trader EA
Fortgeschrittener algorithmischer Handel für XAUUSD auf höheren Zeitskalen
Der Gold News & Swing Trader EA ist ein spezieller MetaTrader 5 Expert Advisor für den Handel mit XAUUSD (Gold). Er arbeitet mit einer Swing-Trading-Strategie, um mittel- bis langfristige Kursbewegungen auf den H4- und Daily-Charts zu erfassen.
Hauptmerkmale:
- Dedizierte XAUUSD-Strategie: Optimierte Logik für die einzigartige Volatilität von Gold.
- Fokus auf Swing Trading: Ziel ist es, signifik
FREE

RTC ML AiBot | ML Signal Executor EA - risikogeleitetes Single Entry System RTC ML AiBot ist kein typischer "Plug-and-Profit"-Roboter.
Es handelt sich um eine professionelle Ausführungs- und Risikokontroll-Engine, die für die Zusammenarbeit mit einem fortschrittlichen Machine-Learning-Signalsystem entwickelt wurde.
Dieser EA wurde entwickelt, um ein kritisches Problem zu lösen, mit dem die meisten Händler konfrontiert sind: den Schutz des Kapitals bei gleichzeitiger disziplinierter und konsist

Der RSI-Divergenzindikator ist ein leistungsfähiges Instrument zur Erkennung potenzieller Umschwünge auf dem Markt, indem er Diskrepanzen zwischen dem Relative-Stärke-Index (RSI) und der Kursbewegung aufzeigt. Divergenzen können ein deutlicher Hinweis auf einen bevorstehenden Trendwechsel sein, entweder von einem Aufwärtstrend zu einem Abwärtstrend oder umgekehrt. Dieser Indikator wurde entwickelt, um die Identifizierung potenzieller Handelsmöglichkeiten einfacher und effizienter zu gestalten.
FREE

Multi-TF Alert System - Professionelles Multi-Zeitrahmen-Alarmierungspanel BESCHREIBUNG Professionelles Multi-Zeitrahmen-Alarmierungspanel für MetaTrader 5 Das Multi-TF Alert System ist ein umfassendes Überwachungstool, das für Händler entwickelt wurde, die mehrere Märkte über verschiedene Zeitrahmen hinweg verfolgen müssen, ohne ständig zwischen Charts zu wechseln. Ob Sie Forex, Gold, Indizes oder Kryptowährungen handeln, dieses Panel bietet eine klare, organisierte Ansicht darüber, wo der Prei
FREE

Aurea Stella EA - Beleuchten Sie Ihren Handelsweg Wie die Leitsterne, die Seeleute durch unbekannte Gewässer führen, ermöglicht Ihnen Aurea Stella EA die Navigation durch die unberechenbare See der Finanzmärkte. Gestalten Sie Ihre eigene Strategiekonstellation: Endlose Kombinationen - Weben Sie Bollinger-Bänder, Stochastik, RSI, MACD, Hüllkurven und Donchian-Kanäle zusammen, um Ihre einzigartigen Handelsmuster zu erstellen.
Präzisionskontrolle - Passen Sie Stop-Loss, Take-Profit und Trailing
FREE

Meine anderen Indikatoren https://www.mql5.com/en/market/product/156702 https://www.mql5.com/en/market/product/153968 (KOSTENLOS) https://www.mql5.com/en/market/product/153960 (KOSTENLOS)
MyFXRoom Vortex - Gleiche Hochs & Tiefs Detektor Empfohlene Einstellungen Balken zwischen den Berührungen: 6 Level-Toleranz: 10
(Ein ausgewogener Ausgangspunkt für die meisten Paare/Zeitrahmen - passen Sie ihn an die Volatilität und Ihre Definition von "gleichen Hochs/Tiefs" an). Funktionsweise
MyFXRoom Vo
FREE

[ MT5-Version ] AO unbezahlte Abweichungen MT5 AO unbezahlte Divergenzen ist der erste Indikator, der entwickelt wurde, um regelmäßige und versteckte Divergenzen detailliert zu analysieren. Es verwendet diese Analyse, um mögliche Einstiegspunkte und Take Profit-Punkte zu finden. Nachfolgend einige der Merkmale dieses Indikators: Zeitersparnis Hochgradig anpassbar Funktioniert für alle Paare (Krypto, Forex, Aktien, Indizes, Rohstoffe...) Geeignet für Scalping oder Swing-Trading Mögliche Umk

Der Indikator zeigt die Größe des Spreads für das aktuelle Instrument auf dem Chart an. Sehr flexibel in den Einstellungen. Es ist möglich, den maximalen Wert des Spreads festzulegen, bei dessen Überschreitung sich die Farbe des Spread-Labels ändert und ein Signal ertönt (falls in den Einstellungen aktiviert). Der Indikator ist sehr praktisch für Leute, die mit Nachrichten handeln. Sie werden nie einen Handel mit einem großen Spread eingehen, da der Indikator Sie sowohl visuell als auch akustisc
FREE

Bitte bewerten Sie dieses kostenlose Tool mit 5 Sternen! Vielen Dank :) Die Expert Advisor Collection „Risk Management Assistant“ ist eine umfassende Suite von Tools zur Verbesserung Ihrer Handelsstrategien durch effektives Risikomanagement unter verschiedenen Marktbedingungen. Diese Sammlung umfasst drei Hauptkomponenten: Expert Advisors zur Mittelwertbildung, zum Switching und zur Absicherung. Jede dieser Komponenten bietet individuelle Vorteile für unterschiedliche Handelsszenarien.
Dieser
FREE

Murderbot - Smart Money Breakout Automatisiertes Breakout-Handelssystem für den Swing-Handel auf dem GBPUSD H1-Zeitrahmen. Dieser EA überwacht die Preisbewegung um Pivot-Punkte und geht Positionen ein, wenn die Ausbruchsbedingungen mit Volatilitätsfiltern bestätigt werden. Kern-Handelslogik Der EA identifiziert Swing-Hochs und Swing-Tiefs mithilfe konfigurierbarer Rückblickzeiträume und überwacht dann den Preis auf Ausbrüche über diese Niveaus hinaus. Einstiegssignale erfordern eine Kursbewegun
FREE
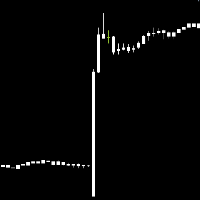
Haben Sie jemals lange Kerzenständer und schnelle Kursbewegungen auf dem Chart gesehen und das Gefühl gehabt, einen guten Handel verpasst zu haben? Mit diesem Fundamental Expert können Sie sich dieses Gefühl abschminken. Die Fähigkeit, wirtschaftliche Ereignisse zu handeln, während Sie schlafen oder Netflix schauen oder bei der Arbeit, ist jetzt möglich. Sie werden nie wieder große Bewegungen im Devisenhandel verpassen, wenn Sie die Nachrichten handeln.
Warum ist der Wirtschaftskalender so wic
FREE
FOTSI – Forex Übersicht True Strength Index Entdecke die wahre Stärke jeder Währung und handle mit Vorteil. Der FOTSI Indikator ist ein Multiwährungs-Oszillator , der die reale Dynamik jeder Hauptwährung (USD, EUR, GBP, JPY, CHF, AUD, CAD, NZD) über alle Paare hinweg misst. Anstatt nur ein einzelnes Chart zu analysieren, kombiniert FOTSI Daten mehrerer Paare, glättet die Bewegungen und wendet den True Strength Index (TSI) -Algorithmus an, um eine klare, stabile und verzögerungsfreie Ansicht der

Vantage FX Matrix Basic ist ein spezialisiertes Marktanalyse-Dashboard, das für die MetaTrader 4-Plattform entwickelt wurde. Es ermöglicht Händlern, die relative Stärke und das Momentum der wichtigsten globalen Währungen in Echtzeit zu überwachen. Diese Edition ist für Händler optimiert, die sich auf die vier liquidesten Währungen konzentrieren: USD, GBP, JPY und AUD . Das Dashboard kombiniert Multi-Timeframe-Analysen mit einem proprietären RSI-basierten Algorithmus, um potenzielle Trendfortsetz
FREE

Ein Preiserhöhungsindikator berechnet die Spanne und die Preisänderungen in Prozent. Er ist sehr nützlich, wenn Sie sich das Diagramm ansehen.
Er hilft Ihnen, Entscheidungen zu treffen, um Geschäfte zu eröffnen, wenn der Preis auf dem niedrigsten Niveau ist, öffnen Sie keine Verkaufsgeschäfte und öffnen Sie Kaufgeschäfte, und wenn er auf dem höchsten Niveau ist, öffnen Sie keine Kaufgeschäfte, öffnen Sie Verkaufsgeschäfte, es ist kein Einstiegssignal für Geschäfte, sondern um den niedrigsten
FREE

Fangen Sie an, durch Kopieren Gewinne zu erzielen Alle Trades werden von unseren erfolgreichen Forex-Händlern gesendet und sind extrem profitabel. Sie können täglich Gewinne durch das Kopieren von Trades erzielen Probezeit inklusive Sie erhalten außerdem Zugang zu einer extrem leistungsstarken Trading-Ausbildung, die Ihnen auf einfache Art und Weise ermöglicht, ein profitabler Trader zu werden, auch wenn Sie keine Handelserfahrung haben. https://ec137gsj1wp5tp7dbjkdkxfr4x.hop.clickbank.net/?cbp
FREE

SCALPER ROBOT: ALGOTRADER-Klasse Hochfrequenz-Handelssystem Entwickelt für präzises Scalping über FOREX, Metalle, Indizes und Rohstoffe. Basierend auf institutionellen Validierungsstandards mit fortschrittlichen Risikokontrollen und Echtzeit-Marktaufklärung. Limited Offer : LIMIT OFFER ON SALE: $79.00 ONLY - VALID FOR NEXT 10 SALES NEXT PRICE $399.00 HURRY After purchase for optimized SET FILE: MQL5 CHAT LINK Marktaufklärung-Architektur SCALPER ROBOT stellt die Evolution algorithmischer Ha

Das ADX-Histogramm ist eine moderne und visuelle Erweiterung des klassischen Average Directional Index (ADX ).
Es wandelt die Standard-ADX- und DI+ / DI--Werte in ein farbkodiertes Histogramm um, wodurch die Trendanalyse viel klarer und schneller wird. Hauptmerkmale: Histogramm mit vier Zuständen : Blau = Normaler Kauftrend Grün = Starker Kauftrend Orange = Normaler Verkaufstrend Rot = Starker Verkaufstrend Automatische Erkennung der Stärke : verwendet die ADX-Linie, um "normale" von "starken" S
FREE

Ein umfassendes Instrument zur Bestimmung von Unterstützungsniveaus, Widerständen und Umkehrungen in Bezug auf die Handelssitzungen. Die These des Indikators kann wie folgt ausgedrückt werden: "Unterstützungs- und Widerstandsniveaus werden zweifelsohne durch die psychologischen Barrieren der Marktteilnehmer gebildet und beeinflussen das weitere Verhalten des Kurses. Aber diese Barrieren sind für verschiedene Gruppen von Händlern unterschiedlich ( des einen Fleisch ist des anderen Gift ) und könn
FREE

FVG-Konzept und Marktstruktur (MS)-Indikator - Umfassende Analyse mit interaktiver Steuerung Dies ist nicht nur ein Indikator. Er ist ein nützliches Werkzeug für die Marktanalyse. Dieser Indikator vereint mehrere analytische Funktionen und ist damit eine der vollständigsten Lösungen in seinem Bereich. Dieses Tool stellt eine umfassende Lösung für die Analyse des Marktverhaltens dar, mit dem Ziel, die Richtung der Kursbewegung zu prognostizieren. Der Indikator ist so konzipiert, dass er den Händl
FREE
Advanced UT BOT ALERTS for MT5 Professionelles Multi-Filter-Trend-Erkennungssystem | Verbesserte UT BOT Engine Wir bieten ausschließlich hochwertige Indikatoren an. Advanced UT BOT wurde für den professionellen Einsatz entwickelt und verwendet eine stabile Signallogik sowie sichere Berechnungen, um Verzögerungen oder fehlerhafte Aktualisierungen zu vermeiden.
Er zeichnet keine Signale neu, entfernt oder verändert keine historischen Daten.
Alle BUY- und SELL-Signale werden erst nach dem Kerzensch

Dieser Indikator erstellt ein Wasserzeichen mit dem Symbol des Vermögenswerts (z. B. BTCUSD) in der Mitte des MetaTrader 5-Charts. Der Text wird in der serifenlosen Schriftart Arial Black angezeigt, deren Größe, Farbe und Deckkraft über die Indikatoreinstellungen angepasst werden kann. Das Wasserzeichen bleibt sowohl horizontal als auch vertikal auf dem Chart zentriert und bleibt hinter Kerzen und anderen Elementen, um die Visualisierung nicht zu beeinträchtigen. Standardmäßig wird eine hellgrau
FREE

Ich bin sicher, dass Sie nach vielen Recherchen im Internet keinen Indikator gefunden haben, der Ihnen beim Forex- oder Binärhandel in der neuesten Wahrscheinlichkeitsstrategie des berühmten Händlers Ronald Cutrim helfen kann. Die Strategie basiert auf einer einfachen Zählung grüner und roter Kerzen, wobei ein numerisches Ungleichgewicht zwischen ihnen über einen bestimmten Zeitraum auf einem Investmentmarkt-Chart überprüft wird. Wenn sich dieses Ungleichgewicht bestätigt und mindestens 16 % bet
FREE

Dies ist ein nützliches Dienstprogramm zur Überwachung der Ausbreitung und auch zur Aufzeichnung von Informationen in einer Datei. (Die Dateien werden in "Common\Files\Spread Monitor" gespeichert). Es besteht die Möglichkeit, den Indikator dank des Herunterladens von Ticks Hoch/Tief in die Vergangenheit berechnen zu lassen. (Das ist eine langsame und sinnvolle Sache! Am besten ist es, wenn Sie den Indikator an einen Chart anhängen und ihn den Spread in Echtzeit aufzeichnen lassen). Es gibt auch
FREE

Die offizielle automatisierte Version des leistungsstarken Indikators PipFinite Trend PRO EA Trend PRO handelt das Signal von PipFinite Trend PRO und verwaltet den Handel je nach Präferenz des Benutzers.
Der EA enthält viele anpassbare Funktionen, die die Trend PRO Handelsstrategie weiter verbessern können.
Features wie Entry- und Exit-Filter, Higher Timeframe Filter, Stoploss, Takeprofit, Breakeven, Trailing Stop, News Filter und MEHR!
Die innovative Lösung
EA Trend PRO wurde entwickelt, um

Der Indikator dient zum Zeichnen horizontaler Kanäle und Signalbereiche, zum Erkennen von Extremum-Durchbrüchen, Rückprallbewegungen und Zielen anhand frei wählbarer Fibonacci-Niveaus – mit oder ohne Tonsignale. Er legt die von Ihnen gewählten Fibonacci-Niveaus automatisch auf diese Extrempunkte. Bei Durchbruch der in den Einstellungen aktivierten Fibonacci-Niveaus kann der Indikator ein Tonsignal abgeben, eine Meldung anzeigen, eine Push-Benachrichtigung an Ihr mobiles Terminal oder eine E-Mai

Boleta-Paneel mit Knöpfen KAUFEN (ZUM MARKTPREIS KAUFEN), VERKAUFEN und CLOSE (ALLE GESCHÄFTE SCHLIESSEN). Es hat auch BOXEN für die Anzahl der LOTS, STOPLOSS und Takeprofit-Werte. TAKEPROFIT (GEWINN IN PUNKTEN). Mit dem Flash Bullet Panel können Sie das Panel mit einem Mausklick über den Chart ziehen. Mit dem Flash Bullet Panel können Sie das Panel mit einem Mausklick über den Chart ziehen und es so an der besten Stelle positionieren. Um es aus dem Chart zu entfernen, klicken Sie einfach auf da
FREE

Ein wenig geändert für die Geschwindigkeit. sie benötigen Tester für einen neuen Berater, an den Sie interessiert sind, schreiben Sie mir eine E-Mail 777basil@mail.ru https://backoffice.aurum.foundation/u/DHXP1U
Die Berechnung des Indikators basiert auf Preisänderungen in der Geschichte und wird mathematisch berechnet, jedes mal mit einem neuen Dateneingang neu berechnet. Kann auf verschiedenen Zeitrahmen verwendet werden. Von den Grenzen des Indikators in 70% gibt es eine änderung der Richtung
FREE

Price Volume Distribution
Volume Profile Indikator zur Analyse der Handelsvolumenverteilung nach Preisniveau. Zeigt POC, Value Area, Volumenspitzen und zonenbasierte Signalfilterung fur MT5.
Ubersicht
Price Volume Distribution ist ein Volumenanalyse-Indikator fur MetaTrader 5. Er berechnet und zeigt die Volumenverteilung uber Preisniveaus unter Verwendung von M1-Zeitrahmendaten und bietet visuelle Darstellung durch Histogrammbalken und Referenzlinien. Benutzerhandbuch zum Verständnis des Syst

Dies ist ein exklusiver Candlestick-Closing-Monitor mit akustischen Alarmen für die MT5-Plattform, der präzise Erinnerungen an die Schlussmomente von Candlesticks in dem von Ihnen festgelegten Zeitrahmen liefert. Ausgestattet mit einem visuellen Globalschalter, unabhängigen Dual-Mode-Warnungen und Echtzeit-Datenanzeige, bietet er eine einfache Bedienung und volle Kompatibilität mit allen MT5-Handelszeitrahmen. Es verhindert effektiv, dass Sie wichtige Handelsgelegenheiten verpassen und dient al
FREE

ChannelRSI5 Der Relative Strength Index (RSI) Indikator mit dynamischen Niveaus von überkauften und überverkauften Zonen.
Dynamische Niveaus ändern sich und passen sich den aktuellen Veränderungen des Indikators und der Preise an und stellen eine Art Kanal dar.
Anzeigeeinstellungen period_RSI - Mittelungsperiode für die Berechnung des RSI-Index. angewandt_RSI - Der angewendete Preis. Es kann eine der Preiskonstanten sein: PRICE_CLOSE - Schlusskurs, PRICE_OPEN - Eröffnungspreis, PRICE_HIGH - Hö
FREE
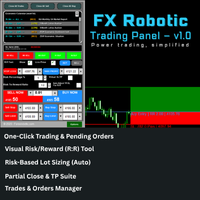
FX Robotic Handels-Panel - v1.0 von Forex Robotic All-in-one MT5-Panel für Ein-Klick-Ausführung, visuelle R:R-Kontrolle, risikobasierte Losgröße, Teilschließungen (inkl. virtuelle TPs), Nachrichten und MA-Signale - direkt auf Ihrem Chart. Übersicht FX Robotic Trading Panel ist ein professionelles Kontrollzentrum auf dem Chart für MetaTrader 5, das blitzschnelle Handelsausführung , visuelles Risiko/Belohnungsmanagement , automatisches Lot-Sizing auf Basis von Risikoprozenten , gestaffelte partiel
FREE
Der EA öffnet und schließt neue Aufträge rechtzeitig. Es kann verwendet werden, um Handelsszenarien beliebiger Komplexität zu implementieren, indem eine Liste von Aufgaben erstellt wird.
Es gibt zwei Möglichkeiten, die Aufgabe zu erledigen Die Aufgabe wird zum angegebenen Datum und zur angegebenen Uhrzeit ausgeführt - sie wird einmal ausgeführt und aus der Liste entfernt. Die Aufgabe wird mit Wiederholung am angegebenen Wochentag und Uhrzeit ausgeführt - die Aufgabe mit Wiederholungen wird nic

Zuerst habe ich mich in Dragon Ultra Expert Advisor verguckt. Nehmen Sie sich die Zeit, die Demo zu testen. Sie sollten mit Ihrem Expert Advisor immer perfekt vertraut sein , bevor Sie live handeln. Die Statistiken zeigen, dass Sie eher erfolgreich sind, wenn Sie aus Erfahrung lernen, diesen zu benutzen. Dragon Lite ist eine kostenlose Version, damit Sie verstehen, wie der Bot funktioniert. Parameter Handelsmodus: Wechseln Sie zu UNLIMITED. Bevor Sie den Dragon Ultra verwenden, sollten Sie das
FREE

Megatron Shark Indicator - MT5 Werkzeug zur Erkennung von harmonischen Mustern Der Megatron Shark Indicator ist ein MetaTrader 5-Tool zur Erkennung und Anzeige von harmonischen Shark-Mustern direkt auf dem Chart. Er identifiziert automatisch bullische und bearische Shark-Formationen, berechnet Einstiegs-, Stop-Loss- und Take-Profit-Levels und liefert Echtzeit-Warnungen. Auf diese Weise können Händler die Analyse harmonischer Muster schnell und ohne manuelles Zeichnen in ihren Handelsprozess int
FREE

Die offizielle automatisierte Version des zuverlässigen Indikators PipFinite Breakout EDGE EA Breakout EDGE übernimmt das Signal des PipFinite Breakout EDGE Indikators und verwaltet den Handel für Sie.
Aufgrund der zahlreichen Finanzinstrumente, die es zu berücksichtigen gilt, wünschen sich viele Trader, dass die Signale vollständig automatisiert werden.
Der EA sorgt dafür, dass alle Ihre Trades vom Einstieg bis zum Ausstieg ausgeführt werden. Das spart Ihnen Zeit und Mühe und maximiert gleich

Dieser Indikator basiert auf der ACD-Strategie von Herrn Mark Fisher, die auf dem Buch "The Logical Trader" basiert.
- OR-Linien - A-Linien - C-Linien - Täglicher Pivot-Bereich - N Tage Pivot-Bereich - Anpassbare Handelssitzung - Zeichnen von OR mit der gewünschten Zeit Zeichnungsniveaus A und C basierend auf täglicher ATR oder konstanter Zahl - Möglichkeit der Anzeige der täglichen und letzttägigen Pivots in der Farbzone - Anzeige des Status der täglichen PMAs (Layer 4) in der Ecke des Charts
FREE

Der Hull Moving Average reagiert empfindlicher auf die aktuelle Preisaktivität als ein traditioneller Moving Average. Er reagiert schneller auf Trendänderungen und zeigt die Preisbewegung genauer an. Dies ist eine Farbversion des Indikators. Dieser Indikator wurde auf der Grundlage der von Sergey <wizardserg@mail.ru> erstellten Originalversion entwickelt. Er ist für alle Zeitrahmen geeignet.
Parameter Periode - Glättungsperiode, empfohlene Werte sind 9 bis 64. Je größer die Periode, desto weich
FREE
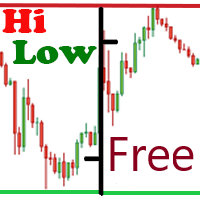
Die kostenlose Version des Hi Low Last Day Indikators . Der Indikator Hi Low Levels Last Day zeigt das Hoch und Tief des letzten Handelstages . Sie haben die Möglichkeit , die Farbe der Linien zu ändern . Testen Sie die vollständige Version des Hi Low Last Day Indikators , in der zusätzliche Indikator Funktionen zur Verfügung stehen : Anzeige des Minimums und des Maximums des vorletzten Tages Anzeige des Minimums und des Maximums der vorangegangenen Woche Tonsignal beim Überschreiten von max . u
FREE

Der Indikator sucht nach den Handelssignalen der "Fünften Dimension" und markiert sie auf dem Chart. Eine detaillierte Beschreibung der Chartmuster, die die Handelssignale generieren, finden Sie in Kapitel 8 "The Balance Line Trades" im Buch Williams' "New Trading Dimensions". Die Signalebenen mit Angabe des Einstiegs- oder Stop-Loss-Platzierungspreises werden direkt auf dem Chart angezeigt. Diese Funktion bietet dem Händler zusätzlichen Komfort bei der Platzierung von Pending Orders. Eine durch
FREE

Expert Advisor für Scalping BR-Futures an der MICEX. Intraday, schließt die Position bei 23=45. Er arbeitet auf 15 Minuten. Wenn ein durch Indikatoren gefiltertes Kauf-/Verkaufssignal erscheint, platziert er eine Pending Order. Ich empfehle nicht, eine Variante mit kürzerem Zeitrahmen zu wählen, da die Variablen in den verwendeten Indikatoren eingeschränkt sind. Martingale wird nicht angewendet, der EA wird auf dem MICEX auf dem Futures-Markt und nur auf BR-Futures getestet. Um die Ergebnisse a
FREE

Mit dem täglichen benutzerdefinierten Periodenseparator-Indikator können Sie Periodenseparatoren für Ihre unteren Zeitrahmen-Charts (H1 und darunter) zeichnen. Der Periodenseparator gibt Ihnen die Möglichkeit, verschiedene Farben einzustellen für: Wochenende - Samstag/Sonntag Montag und Freitag Wochenmitte - Dienstag bis Donnerstag.
Standardmäßig stellt der Indikator die Periodenabgrenzungslinie um 00:00 Uhr für die letzten 10 Tage dar.
Anwendungsfälle: Der Indikator kann als farbenfrohe Alter
FREE

Dieser EA wurde entwickelt, um die Slippage von Eröffnungs- und Schließungsaufträgen zu überwachen und die Datensätze in einer csv-Datei zu speichern. Er ist nützlich, um die Slippage aufzuzeichnen und Broker zu bewerten. Die Aufzeichnungsdateien werden im Ordner MT5_Data_Folder\MQL5\Files gespeichert. Gehen Sie auf "File " --> "Open Data Folder" . Warnung : Öffnen Sie die Dateien NICHT direkt, da sonst die Ausführung des EA beeinträchtigt wird, kopieren Sie sie einfach in einen anderen Ordner
FREE

Hochgradig konfigurierbarer Bollinger Bands Indikator. Merkmale: Hochgradig anpassbare Alarmfunktionen (bei Levels, Kreuzen, Richtungsänderungen per E-Mail, Push, Sound, Popup) Multi-Timeframe-Fähigkeit Farbanpassung (bei Niveaus, Kreuzen, Richtungswechseln) Option für lineare Interpolation Funktioniert im Strategie-Tester im Multi-Timeframe-Modus (auch am Wochenende ohne Ticks) Parameter:
Bollinger Bands Timeframe: Sie können den unteren/höheren Zeitrahmen für Bollinger Bands festlegen. Bollin
FREE
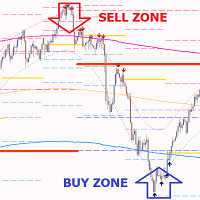
Gold PL MTF – dies ist ein hervorragender technischer Aktienindikator. Der Indikatoralgorithmus analysiert die Bewegung des Vermögenspreises und spiegelt automatisch die wichtigen Pivot-Levels des angegebenen Zeitrahmens (TF) mithilfe der Fibonacci-Methode (Goldener Schnitt) wider.
Der Indikator beschreibt die Preisentwicklung des ausgewählten Zeitrahmens (Tag, Woche, Monat, Jahr) perfekt, bestimmt den Beginn eines Trends und den Beginn einer Korrektur, die sich zu einem entgegengesetzten Tren

FiboEvo FX: Hybride Fibo & Adaptive Grid Strategie NUR AUF HEDGE-KONTEN VERWENDEN Kurzbeschreibung "Graybox" Expert Advisor spezialisiert auf Forex . Er kombiniert technische Fibonacci-Einträge, Flow-Filter (VWAP/ADX) und ein ATR Adaptive Grid-System zur Positionserholung. Übersicht FiboEvo FX wurde für dynamische Forex-Marktbedingungen entwickelt. Es handelt mit Ausbrüchen und Fibonacci-Retracements zugunsten des Trends. Sein Hauptunterscheidungsmerkmal ist das Auto-Adaptive (ATR) System: Ansta
FREE

Auto Fixed Range Volume Profile mit Warnungen für MT5
Dieser Indikator zeigt, wo der Preis mehr Zeit verbracht hat, und hebt wichtige Niveaus hervor, die beim Handel verwendet werden können.
und kann die Preisdichte im Laufe der Zeit anzeigen und die wichtigsten Preisniveaus, den Wertbereich und den Kontrollwert einer bestimmten Handelssitzung umreißen. Dieser Indikator kann an Zeitrahmen zwischen M1 und D1 angehängt werden und zeigt das Marktprofil für tägliche, wöchentliche, monatliche oder
Quantum DCA Trader ist ein leistungsstarkes, automatisiertes Trading-Tool für MetaTrader 5 (MT5), das für die effiziente Verwaltung von Trades mit Schwerpunkt auf Dollar Cost Averaging (DCA)-Strategien, Risikokontrolle und Leistungsoptimierung entwickelt wurde. Es basiert auf fortschrittlichen Algorithmen und kombiniert Auto-Entry-Mechanismen, Grid-Trading, Trailing-Stops und Nachrichtenfilter, um sich an volatile Märkte anzupassen und gleichzeitig Ihr Kapital zu schützen. Der EA unterstützt sow
FREE

Der POC_Levels-Indikator berechnet und zeigt die 3 am häufigsten auftretenden Kursniveaus (Points of Control - POC) auf der Grundlage historischer Kerzen an. Er ist nützlich, um Bereiche von hohem Marktinteresse (wie Unterstützungs-/Widerstandszonen) über jeden Zeitrahmen hinweg zu identifizieren. Wie funktioniert er?
Der Indikator analysiert die letzten LookbackBars-Kerzen . Er zählt, wie oft jedes Preisniveau (basierend auf dem ausgewählten Preistyp) erscheint. Dann wählt er die 3 häufigsten
FREE

Wenn der Markt über dem 4H- oder 1H-MA liegt, reduziert das Erwägen von Käufen, und wenn er darunter liegt, das Erwägen von Verkäufen, das Risiko großer Verluste. Es erhöht die Gewinnrate.
Es alarmiert Sie genau in dem Moment, in dem der Schlusskurs der 5-Minuten-Kerze den 20MA des 1-Stunden- (H1) oder 4-Stunden-Charts (H4) kreuzt.
Dieses Tool wurde für Trader entwickelt, die Bestätigungen auf höheren Zeitrahmen schätzen. Es überwacht den Markt im Hintergrund, sodass Sie sich auf jeden belie
FREE
Kerzen-Amplituden-Oszillator Erhalten Sie eine kristallklare Perspektive auf die Marktvolatilität mit dem Kerzen-Amplituden-Oszillator. Dieses leichtgewichtige und effiziente Werkzeug geht über die einfache Preisanalyse hinaus und zeigt Ihnen die wahre Energie in jeder Kerze, was Ihnen hilft, fundiertere Handelsentscheidungen zu treffen. Anstatt zu raten, ob ein Markt aktiv oder ruhig ist, gibt Ihnen dieser Indikator eine präzise, standardisierte Messung der Volatilität, die auf jedem Symbol und
FREE
Einfacher SuperTrend-Indikator, ähnlich dem von TradingView.
Er verfügt über Puffer für Kauf- und Verkaufssignale, falls Sie ihn in einen EA integrieren möchten.
Er hilft Händlern, Trends leicht zu erkennen, indem er klare Kauf- und Verkaufssignale auf der Grundlage von Kursbewegungen liefert. Der EA ist einfach zu bedienen und lässt sich gut in verschiedene Handelsstrategien integrieren, was ihn zu einer großartigen Option für Händler aller Stufen macht.
Viel Spaß beim Handeln!
FREE
Dieser Indikator überwacht die lebenswichtigen Konstanten Ihres Handelskontos, um es gesund und frei von übermäßigen Risiken zu halten. Er überwacht alle Trades, das absolute Risiko, den Kontostand und den derzeit verwendeten Hebel, wobei verschiedene Farbcodes für Ihre Interpretation verwendet werden. [ Installationsanleitung | Updateanleitung | Fehlerbehebung | FAQ | Alle Produkte ] Erstaunlich einfach zu verstehen Der Indikator ist sauber und einfach Er berechnet das Risiko nach Paaren und W
FREE

KDJ-Indikator für MT5 Der KDJ-Indikator für MT5 ist ein professionelles Momentum- und Trendanalyse-Tool, das Händlern hilft, Trendumkehrungen , überkaufte/überverkaufte Bedingungen und Einstiegs- oder Ausstiegsmöglichkeiten mit hoher Genauigkeit zu erkennen. Ursprünglich als Erweiterung des Stochastik-Oszillators entwickelt, fügt der KDJ eine leistungsstarke J-Linie hinzu, die schneller auf Kursbewegungen reagiert und Händler früher vor möglichen Umkehrungen warnt. Wichtigste Merkmale Drei-Linie
FREE

Adaptive Trend Master (ATM) - Kurze Zusammenfassung der Nutzung
CONTACT US FOR SET FILE Adaptive Trend Master ist ein trendorientiertes und risikokontrolliertes automatisches Handelssystem (Expert Advisor), das speziell für volatile Märkte wie BTC/USD und XAU (Gold) entwickelt wurde. Es arbeitet mit einem Multi-Indikator-geprüften Algorithmus, der sich je nach Marktbedingungen anpassen kann. Was macht es? Erkennt die Trendrichtung Startet nicht ohne ein starkes Signal Berechnet automatisch d
FREE

Dies ist Ihre Chance, mit dem Raten aufzuhören und Ihre Strategie zu verstehen. 281 Trades verfolgt | 64% Gewinnrate | 70% Risiko-zu-Rendite-Verhältnis in historischen Daten Dies sind nicht nur Zahlen – es sind echte Statistiken, die Ihnen zeigen, wie diese Strategie funktioniert. Wenn Sie nach einer Möglichkeit suchen, intelligenter zu handeln, ist dies das Werkzeug, das Sie dorthin bringt. Haben Sie gerne die Realität der Engulfing-Strategie gesehen? Nach Ihrem Kauf kontaktieren Sie uns , und

Glow Beyond Time Willkommen in einer neuen Ära des Handels. Glow Beyond Time ist nicht nur ein weiterer EA—es ist eine hochentwickelte Lösung, die Ihnen einen Vorteil in den sich ständig verändernden Märkten verschafft. Basierend auf einem fortschrittlichen Framework kombiniert dieser Expert Advisor modernste Strategien mit innovativen Risikomanagementsystemen, die es Ihnen ermöglichen, mit Vertrauen und Präzision zu handeln. Request a demo-exclusive trial by contacting me directly. Early acces
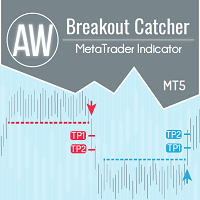
Aufschlüsselung der Preisniveaus, erweiterte Statistiken, TakeProfit-Berechnung und 3 Arten von Benachrichtigungen. Vorteile: Zeichnen Sie Ihre Ergebnisse nicht neu Signal ausschließlich am Ende der Kerze Filteralgorithmus für falsche Aufschlüsselung Es passt gut zu jeder Trendstrategie. Funktioniert mit allen Tools und Zeitreihen Handbuch und Anleitung -> HIER / Problemlösung -> HIER / MT4-Version -> HIER Wie man mit dem Indikator handelt Handeln Sie mit AW Breakout Catcher in nur dr

**"Multi Trendline Channel With Regression Bands" - Linearer Regressionskanal + Standardabweichungsband-Indikator (MT5)**
Dieser Indikator stellt automatisch mehrperiodige lineare Regressionskanäle zusammen mit Standardabweichungsbändern dar und bietet Händlern sofortige Klarheit über Trendrichtung, Preisstreuung und wichtige Unterstützungs-/Widerstandszonen. Durch die Umwandlung komplexer Analysen in einfache, intuitive Visualisierungen bietet er diskretionären Händlern einen klaren Marktkont
FREE

Verbessern Sie Ihren Handel mit diesem Metatrader 5-Experten - dem Positionsvolumen-Rechner. Dieses Tool nimmt Ihnen das Rätselraten beim Risikomanagement und der Gewinnoptimierung ab. Geben Sie einfach Ihre gewünschten Stop-Loss-Punkte ein, indem Sie die Stop-Loss-Linie ziehen, und lassen Sie den Expert Advisor das optimale Positionsvolumen für Ihren Handel berechnen. Und mit anpassbaren Reward Ratios ist es einfacher denn je, Ihre Take-Profit-Punkte für maximale Gewinne festzulegen. Handeln Si
FREE
Erfahren Sie, wie man einen Handelsroboter im MetaTrader AppStore, dem Shop für Applikationen für die MetaTrader Handelsplattform, kaufen kann.
Das Zahlungssystem der MQL5.community ermöglicht Zahlungen mit PayPal, Kreditkarten und den gängigen Zahlungssystemen. Wir empfehlen Ihnen eindringlich, Handelsroboter vor dem Kauf zu testen, um eine bessere Vorstellung von dem Produkt zu bekommen.
Sie verpassen Handelsmöglichkeiten:
- Freie Handelsapplikationen
- Über 8.000 Signale zum Kopieren
- Wirtschaftsnachrichten für die Lage an den Finanzmärkte
Registrierung
Einloggen
Wenn Sie kein Benutzerkonto haben, registrieren Sie sich
Erlauben Sie die Verwendung von Cookies, um sich auf der Website MQL5.com anzumelden.
Bitte aktivieren Sie die notwendige Einstellung in Ihrem Browser, da Sie sich sonst nicht einloggen können.