Regardez les tutoriels vidéo de Market sur YouTube
Comment acheter un robot de trading ou un indicateur
Exécutez votre EA sur
hébergement virtuel
hébergement virtuel
Test un indicateur/robot de trading avant d'acheter
Vous voulez gagner de l'argent sur Market ?
Comment présenter un produit pour qu'il se vende bien
Expert Advisors et indicateurs pour MetaTrader 5 - 58

Welcome to the Minions Labs' reinterpretation of the Classic Bulls & Bears Power , developed by Alexander Elder a long ago. Since the 2 indicators: Bull Power and Bear Power were histogram-based indicators and having 2 indicators in the same chart and occupy too much screen, we decided to mix them into ONE Line and Color-based indicator, which give us all the information we need. The Bull & Bear Power indicators help you determine the strength of BUYERS (Bulls) vs. SELLERS (Bears). Basically, it
FREE

A "simple design" trading panel, which is characterized by small byte size, low CPU usage, simple steps, and quick operation, 1 to 2 clicks to complete a functional operation,
saving time and increasing efficiency . The panel is easy to use, and it is not complicated to set parameters, which is in line with traders' habits. At the same time, its compact-
design, clear at a glance, and comprehensive functions are a powerful tool for manual trading! Key features of the panel:
Click "Bid/Ask Pri

Technical Description Daily Trend Lines Pro is an advanced indicator developed in MQL5, designed to provide accurate insights into the market’s daily movements. Based on the moving average calculated from the first candle of each day, the indicator plots a daily trend line that resets at the start of each new day, ensuring visual clarity and clearly delineating trading sessions. Main Features: Dynamic and Accurate Calculation:
The daily line is derived from the moving average value computed fr
FREE
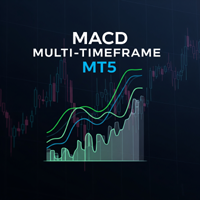
The Multi-Frame MACD Indicator is a robust MetaTrader 5 (MT5) indicator that utilizes the Moving Average Convergence Divergence (MACD) to analyze trends across multiple timeframes. This indicator synchronizes MACD-based trend signals from up to nine timeframes (M1, M5, M15, M30, H1, H4, D1, W1, MN1) and presents them with clear visual cues, including a colored MACD line, signal arrows, and a customizable dashboard. Perfect for traders seeking momentum and trend reversal insights. Features Multi-
FREE
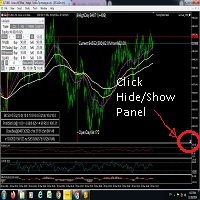
Introducing TEST Lek Trade ONE This EA is developed to meet various usage levels at all levels. Whether you are a new investor or an expert in graphs, various technical analysis, no matter what your trading style is, you can adjust the variable values in this EA to suit your needs. The EA is constantly being developed and updated to be in line with the current situation. This EA has special functions that allow users to design orders for both opening purchase orders, opening sales orders, clo
FREE

GoldMax EA est l'un des meilleurs conseillers experts pour MetaTrader 5. Son algorithme unique analyse l'évolution du prix des actifs en tenant compte des facteurs techniques et mathématiques, détermine les points d'entrée et de sortie rentables et utilise une gestion financière avancée, un multiplicateur de lots, une grille et un mécanisme de réduction des pertes.
Next price will be $699 etc.
After confirms the purchase of this EA via MQL5 you will receive = User Manual + Set file for real a

PropSurge One MT5 — Conseiller pour réussir les défis Prop Cet algorithme de trading est conçu avec un accent sur la discipline et la conformité aux exigences des Prop Firms. Son architecture est orientée vers des conditions d’entraînement, où le contrôle du risque et le respect des règles de capital sont des facteurs clés. L’algorithme est optimisé pour un fonctionnement stable dans le cadre des programmes d’évaluation. Attention ! Contactez-moi immédiatement après l’achat afin de recevoir les

As médias coiote automatizam a leitura de analise de médias rápidas e lentas no saldo do volume e preço. Quando as médias estão em modo compra, a coloração do candle fica azul.
Quando as médias estão em modo venda, a coloração do candle fica magenta. Quando a coloração fica verde ou vermelho, temos a tomada das médias no volume mas não no preço, quando isso ocorre é um sinal de atenção.
A concepção do indicador é ser utilizado para operações em saída de consolidações na direção da tendencia do
FREE

Gold Sniper EA is an automated Expert Advisor built for XAUUSD scalping under breakout conditions . It relies purely on price action logic and session filters , avoiding indicators for faster, cleaner execution. Less Executions but more sniper entries. The EA places pending orders only when momentum and swing zone criteria align, ensuring structured and disciplined trade entries. With dynamic trade management, flexible exits, and customizable risk, Gold Sniper EA is designed to deliver professi

Special offer in honor of the New Year and Christmas!! https://www.mql5.com/ru/users/bossik2810 Gold SniperX - Your best assistant in gold trading. Fully automatic advisor that does not require additional settings, designed for trading on the Gold (XAUUSD) M1 currency pair The strategy is based on breaking through important levels (fast scalping) Does not use dangerous trading methods, no grids, martingales, etc. This is a real trading algorithm - The results of this are a very stable growth cu

Cet indicateur est un outil simple mais extrêmement fiable pour prédire la direction de la tendance, conçu pour les traders qui préfèrent des signaux propres et précis plutôt que des graphiques bruyants. Caractéristiques principales Flèches de prédiction de tendance – signaux d’Achat/Vente clairs basés sur l’action du prix et le flux de tendance. Signaux peu fréquents mais très précis – en moyenne un signal par jour, avec une excellente fiabilité. Signaux de sortie intégrés – les flèches Exit in

This is MT5 version ,MT4 version: https://www.mql5.com/zh/market/product/135036 Expert Advisor (EA) is not omnipotent, using this EA means agreeing to bear the risk of all losses incurred by the EA Trading financial products such as foreign exchange and gold are high-risk products that may result in zero principal. Please be aware of the risks before trading
This is Moving Average 429 EA FREE! This is a Moving Average EA
FREE
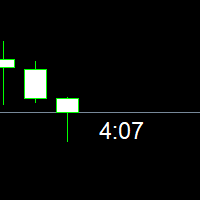
Contador de tempo que iniciará outro candle. Este indicador conta o tempo que falta para terminal um candle e iniciar outro, funciona em qualquer tempo gráfico. Em seus parametros de configurações permite alterar o tamanho e a cor da fonte da letra. Gratis para teste por 15 dias. Contador de tempo do candle. Permite alterar o tamanho e a cor da letra. Após baixar o contador de tempo de candle Flash arraste para o gráfico, configure o tamanho da fonte desejado e as cores preferidas.
FREE
The Sandman EA — MT5 Scalping Robot for Calm Precision in Chaos
“Others have seen what is and asked why. We have seen what could be and asked why not.” Introducing The Sandman — a high-precision, no-nonsense MT5 scalping robot designed to bring calm and control to your trading experience. Overview The market is chaotic and unpredictable — even experienced traders face losses. The Sandman was built to free you from emotional trading. It acts boldly and logically using a proven, fully automated
FREE
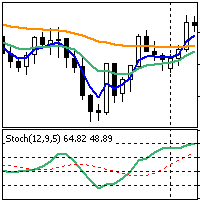
This is a simple trend strategy for Forex. Recommended timeframe is H1, the default settings are for the GBPUSD currency pairs (for other timeframes and currency pairs, it is necessary to select other indicator settings). The following indicators are used in the strategy: Exponential Moving Average: EMA (4) — blue Exponential Moving Average: EMA (13) — green Exponential Moving Average: EMA (50) — orange. Stochastic Oscillator (12,9,5), levels — 20, 40, 60, 80. A buy trade is opened at the openin
FREE

CandleScope Pro Demo – Candlestick Pattern Indicator CandleScope Pro Demo is a powerful and easy-to-use indicator for MetaTrader 5 that automatically detects and labels the most popular candlestick patterns directly on your chart. This tool is designed to help traders of all levels quickly identify key reversal and continuation signals, improving decision-making and trading accuracy. Key Features: Automatic Detection: Instantly scans and highlights the following candlestick patterns: Doji Spin
FREE

Cranberry Candle breakout strategy
Every candle breakout on the higher timeframe, it checks whether the first candle on the lower timeframe aligns with the direction and momentum of the breakout.
Uses ATR for dynamic calculations of trade levels and trail stops. Pure price action and breakouts Confirms with RSI momentum So that on every big move you'll always be there with Cranberry.
FREE

Description de SR Breakout Scalper SR Breakout Scalper : Capturez le marché avec des cassures confirmées par le volume Vous cherchez des points d'entrée clairs et à forte probabilité, sans le bruit du marché ? SR Breakout Scalper est un Expert Advisor de nouvelle génération qui automatise entièrement une stratégie éprouvée utilisée par les traders professionnels : les cassures de support et de résistance confirmées par le volume. Au lieu de se concentrer uniquement sur l'action des prix, cet EA
FREE

VWAP WAVE [Riz] - MT5 Indicator Advanced VWAP Divergence Detection System
VWAP Wave is a professional-grade Volume Weighted Average Price indicator with built-in divergence detection system. It identifies high-probability reversal and continuation signals by analyzing price-VWAP relationships across multiple timeframes.
FREE

Magic Trend
This MT5 indicator is a Moving Average with 3 signal colors. The 3 input parameters on this Indicator give you a chance to set any Moving Average of choice. A combination of 2 different exponential moving averages, relative strength index, commodity channel index, and William's percent range provide the signals.
White color = Null/No/Exit Signal Green color = Buy Signal Red color = Sell Signal
Point To Note: Confirm the color change only after the current candle closes to avoid
FREE

VeMAs est un outil de trading innovant conçu pour améliorer votre stratégie de trading en analysant la dynamique des volumes et la structure du marché. Que vous soyez un trader débutant ou expérimenté, VeMAs vous donne une longueur d'avance. L'indicateur VeMAs est disponible pour seulement 50 $. Le prix d'origine de l'indicateur est de 299 $.
OFFRE LIMITÉE DANS LE TEMPS. Contactez-moi après l'achat pour obtenir un bonus personnalisé ! Vous pouvez obtenir gratuitement un utilitaire (VeMAs Utility

Introducing TrendScope – a versatile trend analysis tool designed for traders who want clear, structured insights into market direction.
TrendScope is built to deliver precise trend identification across multiple markets and timeframes, helping traders filter noise and focus on clean opportunities. Check out our other indicators as well:
Profile: More Indicators
Key Features: Universal Compatibility : Works on Forex, synthetic indices, commodities, indices, and crypto pairs. Multi-Timeframe
FREE

It is a panel that seems common, however, far beyond those of additional buttons for closing multiple orders, it is essential for those using the offline charts generators for Renko, Range, Ticks, and similars because in the Metatrader 5 does not allow the manual operation of orders in these charts that are generated synthetically. The "TRADE PANEL" makes it very easy to handle both orders executed to the market and the placing of pending orders, offering practically the same immediate action
FREE

Golden Scalper EA – Expert Advisor Automatisé pour le Scalping avec Analyse des Figures de Chandeliers sur MetaTrader 5 DESCRIPTION Golden Scalper EA est un Expert Advisor (EA) entièrement automatisé pour la plateforme MetaTrader 5, spécialisé dans le trading à haute fréquence et le scalping, offrant une efficacité maximale avec des risques minimaux. L’EA utilise des algorithmes avancés d’analyse des figures de chandeliers et un filtrage des signaux via la moyenne mobile (MA – Moving Average) po

The indicator plots two lines by High and Low prices. The lines comply with certain criteria. The blue line is for buy. The red one is for sell. The entry signal - the bar opens above\below the lines. The indicator works on all currency pairs and time frames It can be used either as a ready-made trading system or as an additional signal for a custom trading strategy. There are no input parameters. Like with any signal indicator, it is very difficult to use the product during flat movements. You
FREE

A personal implementation of a famous trend principle known as higher high, higher close, lower low, lower close (HHHC - HHHL). It uses price action alone to determine trend direction, trend changes and pullback zones. [ Installation Guide | Update Guide | Troubleshooting | FAQ | All Products ] Customizable breakout period Customizable colors and sizes It is non-repainting and non-backpainting It implements alerts of all kinds The indicator defines three price zones: Buy zones are blue Sell zon
FREE

Introducing our latest innovation in MetaTrader 5 indicators, designed to dramatically improve your trading workflow with high functionality and ease-of-use. It features a robust collection of features designed to help you streamline chart analysis and make the most of your trading decisions. Here's a quick rundown of its incredible features: Fast Drawing of Objects : Save precious time with the quick draw feature. With just a click of a button, you can create various trading objects on your ch
FREE
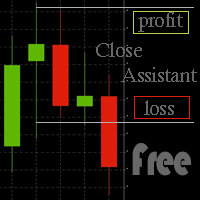
Simple program to automatically close positions by profit or loss.
User can select "Total Profit" to close all positions at the same time, once the total profit or loss is reached.
User can select "Single Profit" to close one by one positions, once single profit or loss is reached. Notes: 1. The assistant will not open any position.
2. The assistant only provide market orders, so due maket volatility positions can suffer slippage.
FREE

The SMTrendLine indicator is based on the principles of graphical construction of Bollinger bands.
Graphically, the Bollinger is two lines that limit the price dynamics from above and from below, respectively. These are a kind of support and resistance lines, which most of the time are located at levels far from the price.
As we know, the Bollinger bands are similar to the envelopes of moving averages. The difference between them is that the envelope boundaries are located above and below the
FREE

Magic History is a detailed trade visualization indicator designed to bring the full story of your trading activity directly onto the chart. If you’re a developer or trader who uses magic numbers, this is made for you. Smart pagination - never lose track of your trades again Pagination means dividing content into separate pages instead of showing everything all at once.
In the context of your Magic History indicator:
Pagination is a system that lets you view your trades in sections (pages) — fo
FREE

SAM Waves AutoTrader – Expert Advisor Multi-Devises de Précision pour Traders Intraday
(EA graphique M15 • Confirmation de tendance H4 • Robot Forex avec SL/TP fixes • Sans Grid / Sans Martingale / Sans Hedging • Analyse top-down • Meilleur EA MT5 2025 • Prop-Firm-Friendly & Bot de Trading Automatique Sécurisé) Offre de Lancement – Tarifs Spéciaux Early-Adopters
Valable jusqu’au 31 juillet 2025 ou jusqu’aux 15 premières ventes de juillet , selon la première éventualité. Type de licence Prix P

Cette stratégie est conçue pour le scalping rapide , en utilisant les niveaux Haut/Bas Quotidien et l’ Andean Oscillator pour identifier des opportunités de trading précises.
Comment Ça Marche : • Daily High/Low – Sert de support et résistance dynamique. • Andean Oscillator – Mesure les changements de momentum et la force de tendance. • Entrée en position : • Achat: Lorsque le prix rebondit sur le Bas Quotidien et que l’Andean Oscillator confirme un élan haussier. • Vente

FlatBreakout MT5 (Free Version) Flat Range Detector and Breakout Panel for MT5 — GBPUSD Only FlatBreakout MT5 is the free version of the professional FlatBreakoutPro MT5 indicator, specially designed for flat (range) detection and breakout signals on the GBPUSD pair only.
Perfect for traders who want to experience the unique fractal logic of FlatBreakout MT5 and test breakout signals on a live market without limitations. Who Is This Product For? For traders who prefer to trade breakout of
FREE

The Stretch is a Toby Crabel price pattern which represents the minimum average price movement/deviation from the open price during a period of time, and is used to calculate two breakout levels for every single trading day. It is calculated by taking the 10 period SMA of the absolute difference between the open and either the high or low, whichever difference is smaller. This value is used to calculate breakout thresholds for the current trading session, which are displayed in the indicator as
FREE

Découvrez les secrets que les grands acteurs ne veulent pas que vous voyiez. Vous êtes-vous déjà demandé si les « baleines » du marché entraient toujours à la même heure et dans la même direction ? Cet indicateur vous le montre. Il ne donne pas de signaux d'entrée, mais il révèle des modèles historiques de mouvement par heure ou par jour qui passeraient normalement inaperçus. Par exemple, vous pourriez découvrir que le jeudi à 15h00 , l' EURUSD a 80 % de chances de progresser . Il est idéal pour
FREE
Système commercial Vous choisissez une barre le jour pour trader, lorsque cette barre ferme le robot enverra deux ordres un au plus haut l'autre au plus bas de la bougie, qui récupère l'autre sera annulé StopLoss le stop sera un tick sous le plus bas en cas d'achat, ou un tick au-dessus du plus haut en cas de vente PrendreProfit La prise peut être définie à quel point vous voulez de la plage du stopLoss, elle peut être personnalisée dans l'optimisation de la stratégie Optimisation Ce robot a l'e
FREE

The name Aroon means “ Dawn's Early Light ” in Sanskrit. His creator Tushar Chande chose this name because the indicator is designed to catch the beginning of a new trend. At first sight it seems a little confusing all those jagged lines but after you understand the basics of it, you will find this indicator pretty cool and use it in a variety of ways, i.e.: Trigger, Trend Filtering System, and so on. The Aroon indicator was created in 1995 so it is a "modern" indicator compared to the Jurassic
FREE
XC Trade Manager for MT5 Manage Your Trades with Precision and Ease
Welcome to XC Trade Manager, the ultimate solution for traders seeking efficient and intuitive trade management on the MT5 platform. Developed by xignalcoding.com, our seventh product in the MQL5 Market lineup, the XC Trade Manager is designed to streamline your trading experience, allowing you to focus on what truly matters—making informed trading decisions. Key Features 1. Orders Tab Effortlessly place and manage your trades

Saw AI Trading - The Ultimate Trading Bot for Profits in All Market Conditions ️ Description: Saw AI Trading is an intelligent trading robot designed to perform efficiently in all market conditions. It stands out with its unique ability to generate profits whether the market is bullish or bearish, making it an ideal choice for both beginner and professional traders. What Makes Saw AI Trading Stand Out: Balanced Performance in Both Directions: Saw AI Trading can achieve profits regar
FREE
Flexible Elmex Grid EA Version: 1.05
Author: Olesia Lukian
Type: Fully Customizable Grid Trading System
Platform: MetaTrader 5
Overview Flexible Elmex Grid is a powerful and modular Expert Advisor designed to handle a wide range of grid trading strategies , from basic to advanced. Whether you're using Martingale, Fibonacci, or more subtle approaches, this EA has all the logic in place to support serious automation at scale . We built it to be general, solid, and customizable enough to cover
FREE

The statistical indicator for the metatrader 5 TradingStatisticPro collects statistical data on your trade, which makes it easier to assess the effectiveness of trading, the profit received and the risks. The indicator is compactly placed in the corner of the main chart of the terminal and displays the following information: 1. The profit earned. 2. Maximum drawdown. 3. The recovery factor. 4. Profit factor. 5. The ratio of profitable and unprofitable transactions (winrate). 6. Average profit a
FREE

Murderbot - Smart Money Breakout Automated breakout trading system designed for swing trading on GBPUSD H1 timeframe. This EA monitors price action around pivot points and enters positions when breakout conditions are confirmed with volatility filters. Core Trading Logic The EA identifies swing highs and swing lows using configurable lookback periods, then monitors price for breakouts beyond these levels. Entry signals require price movement exceeding the pivot level plus a confirmable thresh
FREE

Telegram Group: Find the link in my profile 4 days to pass MyForexFunds phase 1 evaluation.( see screenshot below )
HERE is a FREE file for use in a LIVE DEMO account.
Welcome. Virtual Trendline Scalper is a scalping machine (trades quite often) that uses virtual trades in virtual trendlines before it opens a real one in decent to perfect places.
IMPORTANT:Due to huge amount of variables that are used in the code of the EA and the many drawings in the chart,the EA's code became ver
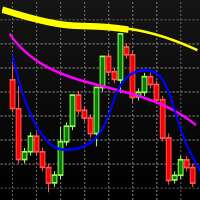
Baseado no indicador MIMA SAR, que é uma combinação dos indicadores MIMA Consolidação e MIMA Tendência, da metodologia Phicube. O indicador é composto pelos 8 fractais, 17,34.72.144.305,610.1292,2554. Sendo a tendência indicada pelas linhas finas e a consolidação pelas linhas mais espessas. Para usar o indicador de maneira adequada deve-se partir do princípio de que tudo na natureza segue o caminho que oferece menor resistência. Isso significa que para uma reversão da tendência ocorrer nesse mod
FREE

One of the most powerful and important ICT concepts is the Power of 3. It explains the IPDA (Interbank Price Delivery Algorithm) phases. PO3 simply means there are 3 things that the market maker's algorithm do with price:
Accumulation, Manipulation and Distribution
ICT tells us how its important to identify the weekly candle expansion and then try to enter above or below the daily open, in the direction of the weekly expansion.
This handy indicator here helps you keep track of the weekly and

Unveiling Momentum X, a uniquely designed, momentum-based Expert Advisor. Currently on a limited time offer, secure this meticulously crafted software at a special sales price before it escalates to its final price of $899. Seize this exceptional opportunity and experience the revolution in forex trading.
Unparalleled Functionality Momentum X works on key market momentum, ensuring trades are placed strategically. Unlike the risk-laden methods used in grid and martingale systems, Momentum X is b

This Free Version I separate from Paid version to whom is newbies here and don't have much money to buy good EA. This EA working on AUDCAD with very small Balance and no martingale , No grid its just hedge positions opposite side to cover loss side until trailing Profits and loss together, last I am not make sure this ea work on your broker too so test demo before running on live account. My recommendation for first use : Pair : GOLD Time Frames : M1 Balance : 1000$ or Above Use Force Trend MOD

This Strategy made for whom want to use robot but have a small balance or new on this market so you can try this one to absorb how the ea works. I use a very basic condition like HFT open position fast on swing trend. Careful and read my recommendation first before use on live account friend. If you want on XAUUSD contact me for the Setup. Robot functions: All my products click here : https://www.mql5.com/en/users/daosengathit/seller Trading Style there are 2 mode Swing trade and Force Trend.

This library allows you to automatically filter events by symbol. Additionally, it requires the use of "flags" to classify events based on their importance (high, low, etc.). Properties: Our library is simple and only requires the export of four functions to work properly. Requirements: The library uses OnTimer , so it is not compatible with programs that also use this event. If your bot utilizes OnTimer , this may interfere with the library’s functionality and prevent event filtering. We recomm
FREE

Libérez le Potentiel de vos Transactions avec l'Indicateur AlphaWave ! Apportez de la Sérénité à vos Transactions : L'Indicateur AlphaWave est conçu pour apporter du calme à vos transactions en lissant le graphique et en offrant une lecture précise de la direction de la tendance. Prendre des décisions de trading claires n'a jamais été aussi facile. Technologie de Lissage Révolutionnaire avec 10 Modes : Découvrez une présentation fluide et claire du graphique avec l'Indicateur AlphaWave. La techn

Ukeita Spike detector for All Gain and Pain Indices
Ukeita Spike Detector is a trend-sensitive indicator specially designed for Gain and Pain Indices
Gain and Pain synthetic indices are available 24/7 on Weltrade , similar to synthetic indices (Boom and Crash) offered by Deriv Broker .
This powerful tool helps detect incoming spike for Gain and Pain indices with high accuracy, making it a great addition to any strategy aimed at trading spikes safely.
Features
1) Detects incoming spikes f

============== Prop [AUREA] MT5 ============== - This is a WIP Project, so this FREE version have just a BACKTEST feature enabled. - Capitalize on daily volatility with this intelligent EA for XAUUSD. - It automatically defines the opening price channel and trades high-probability breakouts. - A smart adaptive exit strategy aims to let winners run, ensuring consistent performance in both trending and volatile markets.
FREE
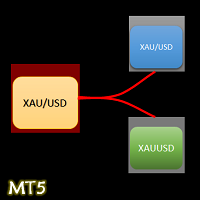
- The Symbol Changer Utility for MetaTrader is a tool that enables traders to switch between various symbols on the MetaTrader trading platform easily and quickly. - It is designed to change the symbol of the current and all open chart windows and the timeframe of the current chart window (by clicking the button). - The tool retrieves symbols from the Market Watch, displaying only the necessary symbols in the market watch.
FREE

Description :
Combination MT5 is a professional indicator based on the Stochastic Oscillator and Average True Range (ATR) technical indicators, thus, you can use it with any currency pair and any timeframe.Trade signals from Combination MT5 are drawn on the main chart in the form of arrows. When a blue arrow appears, then this is a signal to buy, when the red one appears then this is a signal to sell. You can set the alerts on/off. The Stochastic Oscillator and Average True Range (ATR) technica
FREE

IMPORTANT : When testing the EA or running it live, make sure to set "Activate MNG Martingale" to "True"
Hello & Welcome To MNG
MNG is a martingale EA that allows you to configure a lot of features that I'll detail below.
But first, I'd like to insist on the fact that a martingale EA is never safe, no matter if it has a good track record for 5+ years, if it shows incredible backtest results, if it's marketed as the best EA or whatever its price is ($30,000 or $50). A martingale EA might blow
FREE

Highly configurable Adx indicator.
Features: Highly customizable alert functions (at levels, crosses, direction changes via email, push, sound, popup) Multi timeframe ability Color customization (at levels, crosses, direction changes) Linear interpolation and histogram mode options Works on strategy tester in multi timeframe mode (at weekend without ticks also) Adjustable Levels Parameters:
ADX Timeframe: You can set the lower/higher timeframes for Adx. ADX Bar Shift: you can set the of
FREE

Macd Divergence with Smoothed Moving Averages. Divergence must occur when the moving averages are trending. Ea can ONLY open ONE long and one short trade at a time Please add smoothed averages to chart 30/60/100 in live chart VIEW COMMENTS SECTION FOR ALERT ONLY VERSION Test in strategy tester to visualize Ea setting
Default lot size 0.01 Default TP 50 pips Default SL 50 pips 2. Macd setting can be changed to default 12/26/9 Please backtest , for use in trending markets conditions .
FREE
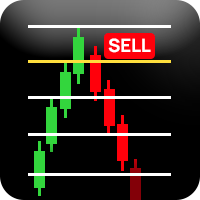
️ IMPORTANT: EVALUATION VERSION - LIMITED SYMBOL SUPPORT This indicator is currently available for EVALUATION PURPOSES ONLY and supports only: EURUSD Volatility 50 (1s) Index The indicator will not function on any other trading symbols. Richchild Quarters Theory Indicator EVALUATION Professional Market Structure Analysis Tool Overview This is a professional trading indicator designed to analyze market structure using dynamic range calculations and quarter-based price analysis. The indicator
FREE
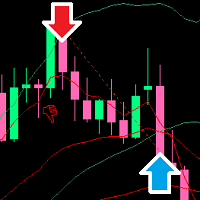
Trend Reversal Scalper EA is an automated trading system for MetaTrader 5.
The Expert Advisor opens positions when several conditions for a potential short-term trend reversal are met. The EA analyses every new bar and checks price behaviour relative to Bollinger Bands, a moving average, RSI and the recent price range. A trade is opened only when all required filters confirm a possible reversal. Strategy logic The following elements are used in the signal generation: Bollinger Bands – detection

A useful and convenient tool for traders when analyzing and making decisions.
Peculiarity
The main feature of this indicator is its fast algorithm . The gain in the speed of calculating the polynomial and its value of the standard deviation in comparison with classical algorithms reaches several thousand times. Also, this indicator includes a Strategy Tester with a clear visualization of transactions, an equity chart and simultaneous calculation and display of the following data in the form of

Seeing and interpreting a sequence of Candlesticks is easy to spot when you are a human... Higher Highs, Higher Lows, are the panorama of a Buying trend, at least in a short period of time... Seeing a current candlestick higher high and a lower candlestick low, as a human, you can immediately spot a "divergence", an "alert", a "starting range", but in the end and based on other analysis a human trader can understand and behave accordingly to this kind of candlestick data... But what about EAs (r
FREE
Simple Spread Indicator (SSI) is a simple and lightweight indicator that displays the current spread value directly on the main chart window.
It helps traders instantly recognize market liquidity conditions and trading costs without opening additional panels or tools. Features Real-time spread display on the main chart Customizable position and font size Minimal system load and no data buffering Useful for scalping and low-spread strategy monitoring How it works The indicator calculates the diff
FREE

Chart Analyzer Eval MT4 The Chart Analyzer is an interactive tool designed to help you assess market trends with precision. It enables real-time analysis of support and resistance levels, market phases, retracement points, and more. With fully adjustable input parameters, you can fine-tune your analysis while the application remains active. Built on a reliable engine, the Chart Analyzer allows you to leverage its capabilities for signal generation. The widget's flexible settings are divided int
FREE

Zenith Forcer Limited Free Version
Est un conseiller commercial puissant qui opère lors des publications de nouvelles économiques et réagit à la volatilité immédiate sur la paire EUR/USD. Il utilise une stratégie de trading à haute fréquence combinée à une gestion rigoureuse des risques et intègre une fonctionnalité ajustant la taille des positions en fonction d’un pourcentage du solde du compte, maximisant ainsi les bénéfices avec un dépôt minimal. Cet EA exploite sa grande efficacité sur les
FREE
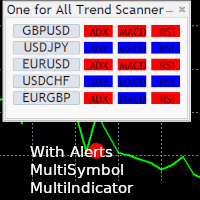
One for All Trend Scanner is a trend following multi-symbol indicator that can be used with any input: forex, stocks, commodities,... The panel shows three indicators and six symbols with the trend for every pair (symbol/indicator): up, down or no trend. The indicators are: Average Directional Movement Index (ADX) Moving Average Convergence Divergence (MACD) Relative Strength Index (RSI) You can choose which indicators will use for entry/exit and can adjust the parameters of each indicator sepa
FREE

Gold Swing Trader EA
Advanced Algorithmic Trading for XAUUSD on Higher Timeframes
The Gold News & Swing Trader EA is a specialized MetaTrader 5 Expert Advisor designed for trading XAUUSD (Gold). It operates on a swing trading strategy to capture medium- to long-term price movements on the H4 and Daily charts.
Key Features:
· Dedicated XAUUSD Strategy: Logic optimized for the unique volatility of Gold.
· Swing Trading Focus: Aims to capture significant price swings over several days.
· High
FREE
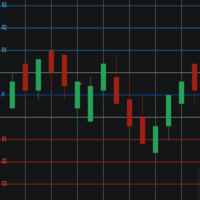
Pivot Points Levels Description The Pivot Points Levels indicator is an advanced and comprehensive tool for technical analysis based on support and resistance levels calculated from pivot points. This free indicator combines 6 different calculation methods with support for multiple timeframes, offering a robust solution for identifying key price reversal and continuation areas. Key Features 6 Calculation Methods : Traditional, Fibonacci, Woodie, Classic, DeMark (DM), and Camarilla Multi-Timefram
FREE
Breakout Shift Trader – MT5 Indicator Trade Like the Market Architects — Not the Victims. Most traders are fighting blind against a rigged game. Market makers engineer false breakouts, liquidity grabs, and “stop hunts” that wipe out retail accounts in seconds. Breakout Shift Trader flips the script. This MT5 indicator decodes the footprints left by institutional manipulation and aligns your trades with the power brokers driving real price action. Proven Results – Tested, Verified, Relentless N
FREE

L'indicateur montre des niveaux ronds sur le graphique. Ils sont également appelés niveaux psychologiques, niveaux de banque ou niveaux des principaux acteurs. À ces niveaux, il y a une véritable lutte entre les haussiers et les baissiers, une accumulation de nombreux ordres, ce qui entraîne une volatilité accrue. L'indicateur s'adapte automatiquement à tout instrument et à toute période. Si le niveau 80 est cassé puis testé, il faut acheter. Si le niveau 20 est cassé puis testé, vendre. L'obje
FREE
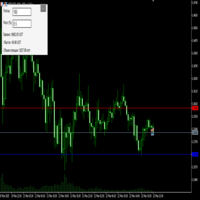
Преимущества и принцип работы индикатора "Risk end Lot Size Calculator" Преимущества : Простота использования :
Индикатор автоматически рассчитывает все необходимые параметры, вам нужно только ввести количество пипсов и риск.
Управление рисками :
Помогает определить, сколько вы можете потерять в сделке, и какой объем позиции (лот) выбрать, чтобы не превысить допустимый риск.
Визуализация :
На графике отображаются линии стоп-лосса для Buy и Sell, что позволяет быстро оценить уровни.
Удобство :
О
FREE
MetaTrader Market - les robots de trading et les indicateurs techniques pour les traders sont disponibles directement dans votre terminal de trading.
Le système de paiement MQL5.community est disponible pour tous les utilisateurs enregistrés du site MQL5.com pour les transactions sur les Services MetaTrader. Vous pouvez déposer et retirer de l'argent en utilisant WebMoney, PayPal ou une carte bancaire.
Vous manquez des opportunités de trading :
- Applications de trading gratuites
- Plus de 8 000 signaux à copier
- Actualités économiques pour explorer les marchés financiers
Inscription
Se connecter
Si vous n'avez pas de compte, veuillez vous inscrire
Autorisez l'utilisation de cookies pour vous connecter au site Web MQL5.com.
Veuillez activer les paramètres nécessaires dans votre navigateur, sinon vous ne pourrez pas vous connecter.