Fifth dimension
- Indikatoren
-
Gennadiy Stanilevych
 Developments in the field of the "Trading Chaos" strategy involve the use of big data processing technology to generate trading signals and automate order placement based on those signals. All my software products are available on the "Market" page, which can be found at
 - Version: 6.96
- Aktualisiert: 13 Dezember 2021
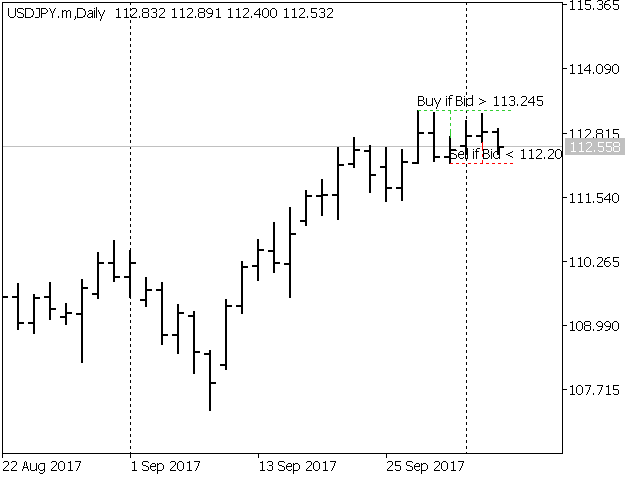
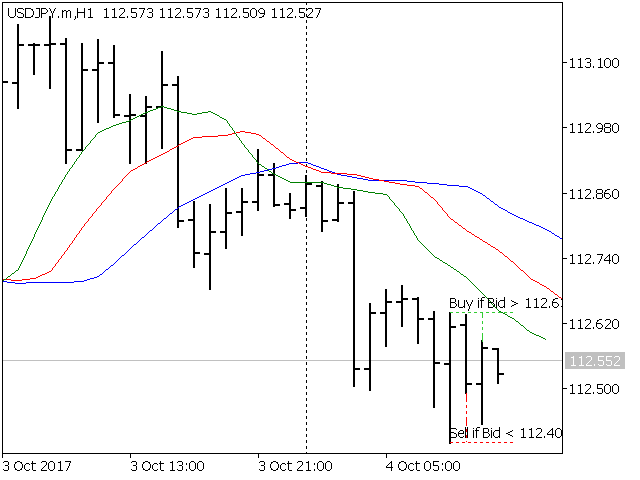
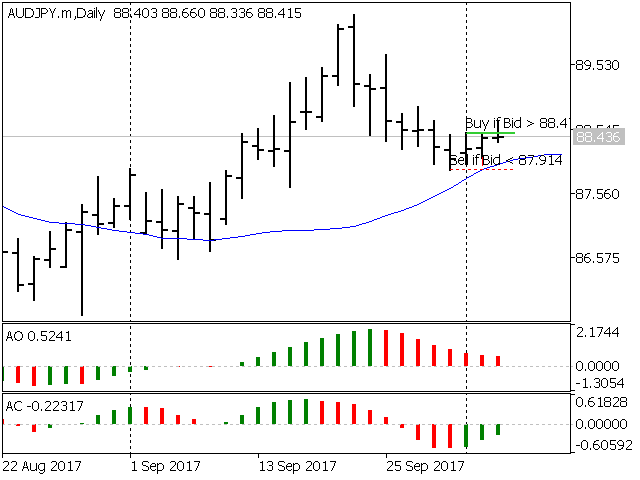
Der Indikator sucht nach den Handelssignalen der "Fünften Dimension" und markiert sie auf dem Chart. Eine detaillierte Beschreibung der Chartmuster, die die Handelssignale generieren, finden Sie in Kapitel 8 "The Balance Line Trades" im Buch Williams' "New Trading Dimensions". Die Signalebenen mit Angabe des Einstiegs- oder Stop-Loss-Platzierungspreises werden direkt auf dem Chart angezeigt. Diese Funktion bietet dem Händler zusätzlichen Komfort bei der Platzierung von Pending Orders. Eine durchgezogene horizontale Linie wird angezeigt, wenn ein Signalpegel durchbrochen wird. Eine gestrichelte Linie auf dem Chart zeigt ein Niveau an, dessen Durchbruch den Markttrend ändern kann. Eine vertikale gestrichelte Linie wird vom Hoch (Tief) des Basisbalkens zum Signalpegel gezogen.
Einstellungen
- bShowLine=true - zeigt die Signallinien an, false - blendet die Signallinien aus.
- bShowLevel=true - zeigt die Preise der Signalpegel an, false - blendet die Preise der Signalpegel aus.
- bAlert=true - zeigt Warnungen über einen Ausbruch des Signalpegels an, false - deaktiviert den Signalblock.
- bPush=false - sendet Push-Benachrichtigungen über einen Ausbruch des Signalpegels, false - deaktiviert die Signalsperre.
- bMail=false - sendet E-Mail-Benachrichtigungen über einen Ausbruch des Signalpegels. false - deaktiviert die Signalsperre.
- BuyLevel=clrLimeGreen - Farbe der Buy Level Linie.
- SellLevel=clrRed - Farbe der Linie für das Verkaufsniveau.
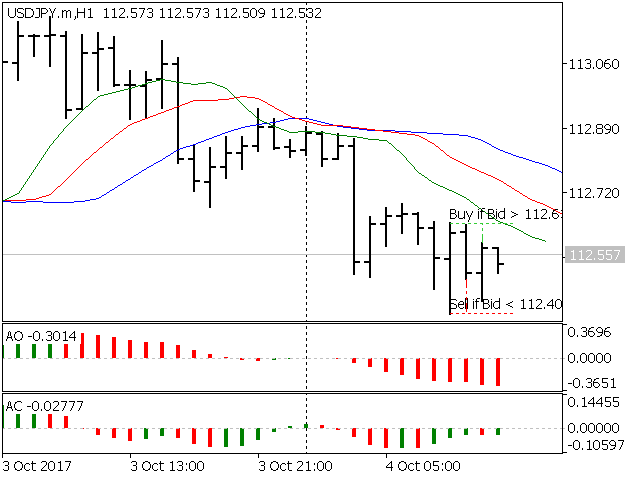
- BWZoneFilter=true - aktiviert den auf AO- und AC-Indikatoren basierenden Filter der Zonen.
- maPeriod=13 - Parameter der Gleichgewichtslinie, "Teeth"-Linie des Alligator-Indikators.
- maShift=8 - Parameter für die Verschiebung der Gleichgewichtslinie, "Zähne"-Linie des Alligator-Indikators.
- maMethod - geglättete Methode zum Zeichnen der Gleichgewichtslinie (Alligator "Kiefer"-Linie).
- maPrice - Medianpreis, Preis, der für die Gleichgewichtslinie verwendet wird.
- BWZoneFilter=true - ermöglicht die Berücksichtigung von Signalzonen, die auf den Indikatoren АО und АС basieren.
Die Balance Line Trades ("Die fünfte Marktdimension")
Die Gleichgewichtslinie zeigt die Richtung des aktuellen Weges des geringsten Widerstandes für die Bewegung der Preise auf dem Markt an. Daher wird der Kauf empfohlen, wenn der Kurs über der Gleichgewichtslinie liegt, und der Verkauf, wenn der aktuelle Kurs unter der Gleichgewichtslinie liegt. Ein entgegengesetztes Signal kann als Stop-Loss-Niveau für die offenen Geschäfte dienen. Darüber hinaus ist es vorteilhaft, nach Einstiegspunkten für Positionen zu suchen, wenn sich der Kurs in unmittelbarer Nähe der Gleichgewichtslinie befindet, während sich das Histogramm des Awesome Oscillator in der Nähe der Nulllinie befindet. Aus diesem Grund ist es empfehlenswert, die Indikatoren Alligator, Super AO und AC in der Vorlage zu verwenden. Ein zusätzlicher Zonenfilter, der im Indikator verfügbar ist, sollte beim Handel verwendet werden. Funktioniert auf allen Zeitrahmen. Der Autor der Strategie empfiehlt jedoch, den täglichen Bereich zu nutzen.


Good Indicator sir.