YouTube'dan Mağaza ile ilgili eğitici videoları izleyin
Bir alım-satım robotu veya gösterge nasıl satın alınır?
Uzman Danışmanınızı
sanal sunucuda çalıştırın
sanal sunucuda çalıştırın
Satın almadan önce göstergeyi/alım-satım robotunu test edin
Mağazada kazanç sağlamak ister misiniz?
Satış için bir ürün nasıl sunulur?
MetaTrader 5 için Uzman Danışmanlar ve göstergeler - 58
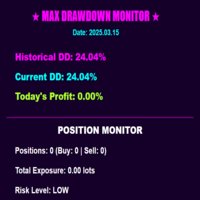
Monitor MaxDD Pro MaxDD Monitor Pro, profesyonel yatırımcılar için kapsamlı bir drawdown izleme aracıdır. Hem bakiye tabanlı hem de mevduat tabanlı drawdown metriklerini gerçek zamanlı olarak takip ederek riski etkili bir şekilde yönetmenize yardımcı olur. Özellikler arasında tarihi maksimum drawdown takibi, sembole özgü drawdown analizi, pozisyon izleme ve pozisyon hesaplama bulunur. Temel özellikler: Renkle kodlanmış uyarılarla gerçek zamanlı drawdown izleme Tarihi ve mevduat tabanlı drawdown'
FREE

Basic Support and Resistance Göstergimiz, teknik analizinizi artırmak için ihtiyacınız olan çözümdür.Bu gösterge, destek ve direnç seviyelerini grafikte yansıtmanıza olanak tanır/ MT4 sürümü
Özellikler
Fibonacci seviyelerinin entegrasyonu: Fibonacci seviyelerini destek ve direnç seviyelerinin yanı sıra görüntüleme seçeneğiyle, göstergemiz size piyasa davranışı ve olası tersine dönme alanları hakkında daha derin bir fikir verir.
Performans Optimizasyonu: Genişletilmiş satırları yalnızca her ç

Jackson Support and Resistance V it a powerful advance support and resistance indicator which provide signal base on price action, it Design to make things easy for everyone to draw support and resistance. we believe most strategies are built with support and resistance as a foundation .Having support and resistance perfect can be a game change to you way of trading. It flexible to all instrument .don't forget to watch our video on how to us this indicator prefect and progressive.
FREE

When prices breakout resistance levels are combined with momentum oscillator breaks out its historical resistance levels then probability emerges to record farther higher prices. It's strongly encouraged to confirm price breakout with oscillator breakout since they have comparable effects to price breaking support and resistance levels; surely, short trades will have the same perception. Concept is based on find swing levels which based on number of bars by each side to confirm peak or trough
FREE

Highly configurable Macd indicator.
Features: Highly customizable alert functions (at levels, crosses, direction changes via email, push, sound, popup) Multi timeframe ability Color customization (at levels, crosses, direction changes) Linear interpolation and histogram mode options Works on strategy tester in multi timeframe mode (at weekend without ticks also) Adjustable Levels Parameters:
Macd Timeframe: You can set the lower/higher timeframes for Macd. Macd Bar Shift: you can set the o
FREE

Account Info AS, MetaTrader 5 için güçlü bir bilgi komut dosyasıdır ve işlem hesabınız hakkında eksiksiz bilgileri doğrudan grafik üzerinde görüntüler. Komut dosyası, hesap analizi, risk yönetimi ve işlem kararı verme için gerekli tüm verileri sağlar.
Ana Özellikler Eksiksiz Finansal Bilgiler Hesap Türü (Demo/Gerçek/Yarışma)
Bakiye, Özkaynak ve Marj
Nakit ve Yüzde Olarak Serbest Marj
Marj Seviyesi
Mevcut Kar/Zarar
Risk Yönetimi Marj Çağrısı ve Stop Out Seviyeleri
Mevcut Sembolün 1 Lotu İ
FREE

1. Overview The Ichimoku Kinko Hyo (or Ichimoku Cloud) is a comprehensive, all-in-one technical analysis indicator designed to provide a deep understanding of market trends, momentum, and dynamic support and resistance levels. This indicator provides a clean, standard implementation of the five core Ichimoku lines. Its key feature is a non-intrusive Status Dashboard that gives you an at-a-glance summary of the current market situation according to the Ichimoku system, allowing for quick and effi
FREE

MaRSI Scalper & Trader The combination of moving averages and RSI This setting is flexible so it can be set with regards to user test uses 1. For scalping 2. For long time trading
features 1. Sends push notifications 2. Sends alerts on computers 3. Draws Arrows 4. Draws respective indicators (this feature will be edited in the future)
Have feedback https://t.me/Tz_Trade_Logics or just call +255766988200 (telegram/whatsApp) Head to discussion page to leave your comments Improvement are on the
FREE

Moving Average Convergence/Divergence — схождение/расхождение скользящих средних — технический индикатор, разработанный Джеральдом Аппелем (Gerald Appel), используемый в техническом анализе для проверки силы и направления тренда, а также определения разворотных точек. Встроенный в MetaTrader 5 индикатор MACD не соответствует задумке автора (Gerald Appel):
-линия MACD графически изображена в виде гистограммы, однако гистограммой отражается разница между линией MACD и сигнальной линией;
-сигнальн
FREE

Highly configurable Williams %R indicator. Features: Highly customizable alert functions (at levels, crosses, direction changes via email, push, sound, popup) Multi timeframe ability Color customization (at levels, crosses, direction changes) Linear interpolation and histogram mode options Works on strategy tester in multi timeframe mode (at weekend without ticks also) Adjustable Levels Parameters:
Williams %R Timeframe: You can set the current or a higher timeframes for Williams %R. Williams
FREE

Ladder Quant EA - Multi-Session Expert Advisor The Ladder Quant EA is an advanced Expert Advisor for MetaTrader 5, designed to optimize forex trading across major market sessions. It integrates multiple strategies, including breakout, reversal, and range-bound trading, into a robust system. Tailored for major currency pairs, it combines sophisticated risk management with customizable settings. Professional Multi-Session Forex Trading Robot Version: 1.06 - Enhanced Edition Category: Expert A
FREE
The Sandman EA — MT5 Scalping Robot for Calm Precision in Chaos
“Others have seen what is and asked why. We have seen what could be and asked why not.” Introducing The Sandman — a high-precision, no-nonsense MT5 scalping robot designed to bring calm and control to your trading experience. Overview The market is chaotic and unpredictable — even experienced traders face losses. The Sandman was built to free you from emotional trading. It acts boldly and logically using a proven, fully automated
FREE

Gold Swing Trader EA
Advanced Algorithmic Trading for XAUUSD on Higher Timeframes
The Gold News & Swing Trader EA is a specialized MetaTrader 5 Expert Advisor designed for trading XAUUSD (Gold). It operates on a swing trading strategy to capture medium- to long-term price movements on the H4 and Daily charts.
Key Features:
· Dedicated XAUUSD Strategy: Logic optimized for the unique volatility of Gold.
· Swing Trading Focus: Aims to capture significant price swings over several days.
· High
FREE

RTC ML AiBot | ML Signal Executor EA – Risk-Managed Single Entry System RTC ML AiBot is not a typical “plug-and-profit” robot.
It is a professional-grade execution and risk control engine, designed to work alongside an advanced machine-learning signal system.
This EA exists to solve one critical problem most traders face: protecting capital while executing signals with discipline and consistency. RTC ML AiBot is built as a dedicated execution and risk management layer for advanced signal-base

The RSI Divergence Indicator is a powerful tool designed to identify potential reversals in the market by spotting discrepancies between the Relative Strength Index (RSI) and price movement. Divergences can be a significant indication of an impending trend change, either from bullish to bearish or vice versa. This indicator is built for making the task of identifying potential trade opportunities more straightforward and efficient.
Features: Automatic Detection: The indicator scans the chart
FREE

Multi-TF Alert System - Profesyonel Çoklu Zaman Dilimi Uyarı Paneli AÇIKLAMA MetaTrader 5 için Profesyonel Çoklu Zaman Dilimi Uyarı Paneli Multi-TF Alert System, sürekli grafikler arasında geçiş yapmadan farklı zaman dilimlerinde birden fazla piyasayı takip etmesi gereken trader'lar için tasarlanmış kapsamlı bir izleme aracıdır. İster forex, ister altın, ister endeksler veya kripto paralar ile işlem yapın, bu panel fiyatın son yüksek ve düşük seviyelere göre nerede durduğuna dair net ve düzenli
FREE

Aurea Stella EA – Illuminate Your Trading Path Like the guiding stars that lead sailors through uncharted waters, Aurea Stella EA empowers you to navigate the unpredictable seas of the financial markets. Craft Your Own Constellation of Strategies: Endless Combinations – Weave together Bollinger Bands, Stochastic, RSI, MACD, Envelopes, and Donchian Channels to create your unique trading patterns.
Precision Control – Adjust stop loss, take profit, trailing stops, and choose whether to reverse
FREE

My other indicators https://www.mql5.com/en/market/product/156702 https://www.mql5.com/en/market/product/153968 (FREE) https://www.mql5.com/en/market/product/153960 (FREE)
MyFXRoom Vortex – Equal Highs & Lows Detector Recommended Settings Bars Between Touches: 6 Level Tolerance: 10
(A balanced starting point for most pairs/timeframes — adjust to match volatility and how you define “equal highs/lows.”) What it does
MyFXRoom Vortex automatically detects, validates, and draws Equal Highs and E
FREE

[ How to use the Demo version ] [ MT4 Version ] AO unpaid divergences MT5 AO unpaid divergences is the first indicator developed to detailed analyze Regular and Hidden Divergences. It uses this analysis to find out possible entry points and targets. Below some of the characteristics of this indicator: Time saving Highly customizable Working for all pairs (Crypto, Forex, Stocks, Indices, Commodities...) Suitable for Scalping or Swing trading Possible reversal swings Alerts and Notifications on M

The indicator displays the size of the spread for the current instrument on the chart. Very flexible in settings. It is possible to set the maximum value of the spread, upon exceeding which, the color of the spread label will change, and a signal will sound (if enabled in the settings). The indicator will be very convenient for people who trade on the news. You will never enter a trade with a large spread, as the indicator will notify you of this both visually and soundly. Input parameters: Aler
FREE

Bu ücretsiz aracı beğendiyseniz lütfen 5 yıldızlı bir derecelendirme bırakın! Çok teşekkür ederim :) "Risk Yönetimi Asistanı" Uzman Danışman Koleksiyonu, çeşitli piyasa koşullarında riski etkili bir şekilde yöneterek işlem stratejilerini geliştirmek için tasarlanmış kapsamlı bir araç paketidir. Bu koleksiyon, üç temel bileşenden oluşur: ortalama alma, değiştirme ve korunma uzman danışmanları, her biri farklı işlem senaryolarına göre uyarlanmış farklı avantajlar sunar.
Bu EA, piyasadaki standar
FREE

Murderbot - Smart Money Breakout Automated breakout trading system designed for swing trading on GBPUSD H1 timeframe. This EA monitors price action around pivot points and enters positions when breakout conditions are confirmed with volatility filters. Core Trading Logic The EA identifies swing highs and swing lows using configurable lookback periods, then monitors price for breakouts beyond these levels. Entry signals require price movement exceeding the pivot level plus a confirmable thresh
FREE
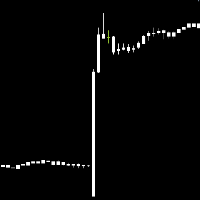
Have you ever seen Long candle sticks, quick price movements on the chart and feel like you missed out on a good trade. You can kiss that feeling goodbye with this Fundamental Expert. The ability to trade Economic events while asleep or watching Netflix or at work, has arrived. You will never miss out on big movements in forex trading with trading the news.
Why is the economic calendar important?
Economic indicators and events have the potential to significantly impact financial markets. Th
FREE
FOTSI – Forex Gerçek Güç Endeksi Her dövizin gerçek gücünü keşfedin ve avantajla işlem yapın. FOTSI Göstergesi , tüm ana dövizlerin (USD, EUR, GBP, JPY, CHF, AUD, CAD, NZD) momentumunu tüm paralar üzerinden ölçen bir çoklu döviz osilatörüdür . Tek bir grafiği analiz etmek yerine, FOTSI birden fazla paranın verilerini birleştirir, hareketleri düzeltir ve her dövizin göreli gücünü net, stabil ve gecikmesiz göstermek için True Strength Index (TSI) algoritmasını uygular. Temel Özellikler Çoklu döviz

Vantage FX Matrix Basic is a specialized market analysis dashboard designed for the MetaTrader 4 platform. It allows traders to monitor the relative strength and momentum of major global currencies in real-time. This edition is optimized for traders focusing on the four most liquid currencies: USD, GBP, JPY, and AUD . The dashboard combines multi-timeframe analysis with a proprietary RSI-based algorithm to identify potential trend continuations and reversals without switching charts. Functiona
FREE

A price increase indicator calculates range and price changes in percent. It is very useful when you look at the chart.
It helps you make decisions to open deals when the price is at the lowest level do not open sell deals and open buy deals and when it is at the highest level do not open buy deals open sell deals, it is not an entry signal for deals but to know the lowest and highest price that will reach in an hour or four hours a day or a week or a month as a whole for the period
FREE

Start earning profits by copying All trades are sent by our successful Forex trader & are extremely profitable. You can earn profits by copying trades daily Trial Period included You'll also get access to extremely powerful trading education which is designed in a simple way for you to become a profitable trader, even if you have no trading experience. https://ec137gsj1wp5tp7dbjkdkxfr4x.hop.clickbank.net/?cbpage=vip
FREE

SCALPER ROBOT: ALGOTRADER-Grade High-Frequency Trading System Engineered for precision scalping across FOREX, Metals, Indices, and Commodities. Built on institutional-grade validation standards with advanced risk controls and real-time market intelligence. Limited Offer : December Special 59.00 only LIMIT OFFER ON SALE: $79.00 ONLY - VALID FOR NEXT 10 SALES NEXT PRICE $399.00 HURRY After purchase for optimized SET FILE: MQL5 CHAT LINK
Market Intelligence Architecture SCALPER ROBOT repres

The ADX Histogram is a modern and visual upgrade of the classic Average Directional Index (ADX) .
It transforms the standard ADX and DI+ / DI– values into a color-coded histogram , making trend analysis much clearer and faster. Key Features: Histogram with four states : Blue = Normal Buy Trend Green = Strong Buy Trend Orange = Normal Sell Trend Red = Strong Sell Trend Automatic strength detection : uses the ADX line to separate “normal” vs. “strong” signals. Fully customizable: ADX
FREE

A comprehensive tool for determining the levels of support, resistance, reversals in relation to trading sessions. The indicator's thesis can be expressed as follows: "Support and resistance levels are undoubtedly formed by the psychological barriers of market participants, and influence the further behavior of the price. But these barriers are different for different groups of traders ( One man's meat is another man's poison ) and can be grouped by territory or by the trading time ". Follo
FREE

FVG Concept and Market Structure (MS) Indicator – Comprehensive Analysis with Interactive Control This is not just an indicator. It is a useful tool for market analysis. This indicator combines several analytical functions, making it one of the more complete solutions in its field. This tool represents a comprehensive solution for analyzing market behavior with the goal of forecasting the direction of price movement. The indicator is designed to assist the trader and not distract them with unnec
FREE
Advanced UT BOT ALERTS for MT5 Profesyonel Çok Katmanlı Trend Tespit Sistemi | Geliştirilmiş UT BOT Motoru Yalnızca yüksek kaliteli göstergeler sunuyoruz. Advanced UT BOT , profesyonel kullanım için tasarlanmıştır.
Kararlı sinyal mantığı ve güvenli hesaplama yapısı sayesinde gecikme veya hatalı güncelleme olmaz.
Geçmiş sinyalleri yeniden çizmez, değiştirmez veya silmez.
Tüm BUY ve SELL sinyalleri mum kapanışı gerçekleştikten sonra oluşturulur ve sabitlenir.
Canlı işlem sırasında repaint yoktur
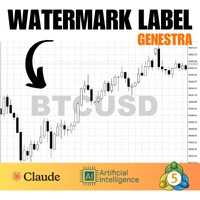
This indicator creates a watermark with the asset symbol (e.g., BTCUSD) in the center of the MetaTrader 5 chart. The text is displayed in Arial Black sans-serif font, with customizable size, color, and opacity through indicator settings. The watermark stays centered both horizontally and vertically on the chart, remaining behind candles and other elements to avoid interfering with visualization. By default, it uses light gray color with 30% opacity, creating a subtle effect that helps quickly id
FREE

I'm sure after a lot of research on the internet, you haven't found any indicator that can help you with forex or binary trading in the latest probability strategy created by famous trader Ronald Cutrim. The strategy is based on a simple count of green and red candles, checking for a numerical imbalance between them over a certain period of time on an investment market chart. If this imbalance is confirmed and is equal to or greater than 16%, according to trader Ronald Cutrim, creator of the pro
FREE

This is a usefull utility for monitoring spread and also for recording informations to a file. (Files will be placed into "Common\Files\Spread Monitor"). There is the possibility to let the indicator calculate high/low into the past thanks to downloading ticks. (It's a slow and approsimate thing! The best way to use it is to attach to a chart and let it recording spread in real time). There is also a buffer with the average of spread in latest X periods.
Easy and effective.
FREE

The Official Automated Version of the Powerful Indicator PipFinite Trend PRO EA Trend PRO trades the signal of PipFinite Trend PRO and manages the trade depending on the user's preference.
The EA includes many customizable features that can further enhance the Trend PRO trading strategy.
Features like Entry and Exit Filters, Higher Timeframe Filter, Stoploss, Takeprofit, Breakeven, Trailing Stop, News Filter and MORE!
The Innovative Solution
EA Trend PRO was created to make your trading more

The indicator is designed for building horizontal channels and signal zones, detecting breakouts of extremes, bounces and targets based on custom Fibonacci levels (with or without sound alerts). It automatically applies your chosen Fibonacci levels to those extremes. When price breaks the Fibonacci levels enabled in the settings, the indicator can play a sound, show a message, send a push notification to your mobile terminal or an email (if enabled). Features:
automatic channel building by time

Painel Boleta com botões BUY (COMPRA À MERCADO), SELL (VENDA À MERCADO) e CLOSE (FECHA TODAS AS OPERAÇÕES). Possui também CAIXAS de quantidade de LOTES, VALORES de STOPLOSS (PERDAS EM PONTOS) e TAKEPROFIT (GANHOS EM PONTOS). Com o Painel Boleta Flash é possivel arrastar o painel pelo gráfico, com um click do mouse, possicionando no melhor local. Para remove-lo do gráfico é só clicar no "x" do painel.
FREE

Hız için biraz değişti. ilgilenen yeni bir danışman için test ediciler gereklidir, bana e-posta ile yazın 777basil@mail.ru
https://backoffice.aurum.foundation/u/DHXP1U
Gösterge, geçmişteki fiyat değişikliklerine göre hesaplanır ve matematiksel olarak hesaplanır, veriler her tekrar alındığında yeniden hesaplanır. Farklı zaman dilimlerinde kullanılabilir. Göstergenin sınırlarından% 70 oranında fiyat hareketi veya konsolidasyon yönünde bir değişiklik var. Bu şekilde, tekneyi trendde ve kanalın
FREE

Price Volume Distribution
Fiyat seviyesine gore islem hacmi dagitimini analiz eden Volume Profile gostergesi. MT5 icin POC, Value Area, hacim zirvelerini ve bolge tabanli sinyal filtrelemeyi goruntular.
Genel Bakis
Price Volume Distribution, MetaTrader 5 icin bir hacim analiz gostergesidir. M1 zaman dilimi verilerini kullanarak fiyat seviyelerindeki hacim dagitimini hesaplar ve goruntular, histogram cubuklari ve referans cizgileri ile gorsel temsil saglar. Sistemi anlamak için kullanım kılavu

This is an exclusive candlestick closing monitor with audio alerts for the MT5 platform, designed to deliver precise reminders for the closing moments of candlesticks on your specified timeframe. Equipped with a visual global switch, independent dual-mode alerts and real-time data display, it features easy operation and full compatibility with all MT5 trading timeframes. It effectively prevents missing key trading opportunities and serves as a practical auxiliary tool for trading chart monitori
FREE

ChannelRSI5 The Relative Strength Index (RSI) indicator with dynamic levels of overbought and oversold zones.
Dynamic levels change and adjust to the current changes in the indicator and prices, and represent a kind of channel.
Indicator settings period_RSI - Averaging period for calculating the RSI index. applied_RSI - The applied price. It can be any of the price constants: PRICE_CLOSE - Closing price, PRICE_OPEN - Opening price, PRICE_HIGH - Maximum price for the period, PRICE_LOW - Minimum
FREE
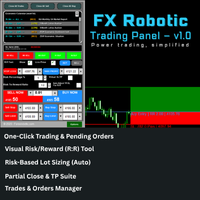
FX Robotic Trading Panel — v1.0 by Forex Robotic All-in-one MT5 panel for one-click execution, visual R:R control, risk-based lot sizing, partial closes (incl. virtual TPs), news, and MA signals—right on your chart. Overview FX Robotic Trading Panel is a professional, on-chart control center for MetaTrader 5 that blends lightning-fast trade execution , visual Risk/Reward management , auto lot sizing from risk% , staged partial take-profits (real or virtual ), an economic calendar , and a multi
FREE
The EA opens and closes new orders on time. It can be used to implement trading scenarios of any complexity by creating a list of tasks. There are two options for completing the task The task is executed on the specified date and time - it is executed once and is removed from the list. The task is executed with repetition on the specified day of the week and time - the task with repetitions is not removed from the list. Panel settings Symbol - select the symbol for the trade function. Time -

At first, I got my teeth into Dragon Ultra Expert Advisor. Take your time to test demo. You should be always perfectly familiar with your Expert Advisor before a live trading. Based on the statistics, you are more likely to succeed if you learn from experience to use this. Dragon Lite is a free version for you to understand how the bot works. Parameter Trading Mode: Change to UNLIMITED. You should use the Dragon Training proficiently before using the Dragon Ultra .
The Forex Tr
FREE

Megatron Shark Indicator – MT5 Harmonic Pattern Detection Tool The Megatron Shark Indicator is a MetaTrader 5 tool for detecting and displaying Shark harmonic patterns directly on the chart. It automatically identifies bullish and bearish Shark formations, calculates entry, stop-loss, and take-profit levels, and provides real-time alerts. This allows traders to quickly integrate harmonic pattern analysis into their trading process without manual drawing. Advantages * Automatic Pattern Detection
FREE
The Official Automated Version of the Reliable Indicator PipFinite Breakout EDGE EA Breakout EDGE takes the signal of PipFinite Breakout EDGE indicator and manages the trade for you.
Because of numerous financial instruments to consider, many traders want the signals to be fully automated.
The EA will make sure all your trades are executed from entry to exit. Saving you time and effort while maximizing your profits.
The Edge of Automation
Effortless price action trading is now possible acros

This indicator is based on Mr. Mark Fisher's ACD strategy, based on the book "The Logical Trader."
- OR lines - A lines - C lines - Daily pivot range - N days pivot range - Customizable trading session - Drawing OR with the desired time Drawing levels A and C based on daily ATR or constant number - Possibility to display daily and last day pivots in color zone - Displaying the status of daily PMAs (layer 4) in the corner of the chart - Show the order of daily pivot placement with multi-day piv
FREE

Hull Moving Average is more sensitive to the current price activity than a traditional Moving Average. It faster responds to trend change and more shows the price movement more accurately. This is a color version of the indicator. This indicator has been developed based in the original version created by Sergey <wizardserg@mail.ru>. Suitable for all timeframes.
Parameters Period - smoothing period, recommended values are 9 to 64. The larger the period, the softer the light. Method - smoothing m
FREE
The free version of the Hi Low Last Day indicator . The Hi Low Levels Last Day indicator shows the high and low of the last trading day . The ability to change the color of the lines is available . Try the full version of the Hi Low Last Day indicator , in which additional indicator features are available : Displaying the minimum and maximum of the second last day Displaying the minimum and maximum of the previous week Sound alert when crossing max . and min . levels Selecting an arbitrary audio
FREE

The indicator looks for the "Fifth dimension" trade signals and marks them on the chart. A detailed description of the chart patterns that generate the trade signals can be found in Chapter 8 "The Balance Line Trades" in the book Williams' "New Trading Dimensions". Signal levels with indication of the position entry or stop loss placement price are indicated directly on the chart. This feature creates additional convenience for the trader when placing pending orders. A solid horizontal line is d
FREE

Советник для скальпирования фьючерса BR на ММВБ. Внутридневный, в 23=45 закроет позицию. Работает на 15-ти минутках. По появлению отфильтрованного индикаторами сигнала на покупку/продажу выставляет отложенный ордер. Более короткий вариант таймфрейма выбирать не рекомендую из-за введенных ограничений для переменных в примененных индикаторов. Мартингейл не применён, EA тестирован на ММВБ на срочном рынке и только на фьючерсах BR. Для демонстрации результатов на склейке, параметры дооптимизир
FREE

The daily custom period seperator indicator allows you to draw period seperators for your lower time frame charts H1 and below. The period seperator gives you options to set different colors for: Weekend - saturday/sunday Monday and Friday Midweek - Tuesday to Thursday.
By default the indicator plots the period seperator line at 00:00 hours for the last 10 days.
Use Cases: The indicator can be used as a colourful alternative period seperator to the default MT5 period seperator. For those tha
FREE

This EA is designed to monitor the slippage of opening and closing orders, and save the records in csv file. It is useful to record the slippage and evaluate brokers. The record files are saved in the folder MT5_Data_Folder\MQL5\Files. Go to "File " --> "Open Data Folder" . Warning : Do NOT open the files directly, otherwise it will affect the exectution of EA, just copy them to another folder and open them.
Usage: Open a chart and load the EA on it, just need only one EA to run, it mo
FREE

Highly configurable Bollinger Bands indicator. Features: Highly customizable alert functions (at levels, crosses, direction changes via email, push, sound, popup) Multi timeframe ability Color customization (at levels, crosses, direction changes) Linear interpolation option Works on strategy tester in multi timeframe mode (at weekend without ticks also) Parameters:
Bollinger Bands Timeframe: You can set the lower/higher timeframes for Bollinger Bands. Bollinger Bands Bar Shift: Y ou can set th
FREE
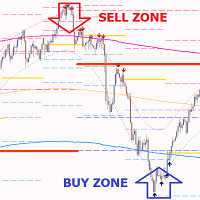
Gold PL MTF - bu iyi bir hisse senedi teknik göstergesidir. Gösterge algoritması varlık fiyatının hareketini analiz eder ve Fibonacci yöntemini (altın bölüm) kullanarak belirtilen zaman diliminin (TF) önemli Pivot Seviyelerini otomatik olarak yansıtır.
Gösterge, seçilen zaman diliminin (gün, hafta, ay, yıl) fiyat yörüngesini mükemmel bir şekilde tanımlar, bir trendin başlangıcını ve ters bir trende dönüşebilecek bir düzeltmenin başlangıcını belirler.
Gösterge ayrıca, fiyat mıknatısı görevi gö

FiboEvo FX: Hybrid Fibo & Adaptive Grid Strategy USE ON HEDGE ACCOUNTS ONLY Short Description "Graybox" Expert Advisor specialized in Forex . It combines technical Fibonacci entries, Flow Filters (VWAP/ADX), and an ATR Adaptive Grid system for position recovery. Overview FiboEvo FX was designed for dynamic Forex market conditions. It trades breakouts and Fibonacci retracements in favor of the trend. Its key differentiator is the Auto-Adaptive (ATR) system: instead of using fixed distances for th
FREE

MT5 için uyarılar içeren Otomatik Sabit Aralık Hacim Profili
Bu gösterge, fiyatın nerede daha fazla zaman harcadığını gösterir ve ticarette kullanılabilecek önemli seviyeleri vurgular.
ve belirli bir ticaret seansının en önemli fiyat seviyelerini, değer alanını ve kontrol değerini özetleyerek zaman içindeki fiyat yoğunluğunu gösterebilir. Bu gösterge, M1 ile D1 arasındaki zaman dilimlerine eklenebilir ve günlük, haftalık, aylık ve hatta gün içi oturumlar için Piyasa Profilini gösterir. Daha d
Quantum DCA Trader is a powerful, automated trading tool for MetaTrader 5 (MT5), designed to manage trades efficiently with a focus on Dollar Cost Averaging (DCA) strategies, risk control, and performance optimization. Built on advanced algorithms, it combines auto-entry mechanisms, grid trading, trailing stops, and news filters to adapt to volatile markets while protecting your capital. The EA supports both automated and manual orders, making it suitable for novice and experienced traders alike
FREE

The POC_Levels indicator calculates and displays the 3 most frequently occurring price levels (Points of Control – POC) based on historical candles. It is useful for identifying areas of high market interest (like support/resistance zones) across any timeframe. How It Works
The indicator analyzes the last LookbackBars candles. It counts how many times each price level (based on the selected price type) appears. Then it selects the top 3 most frequent prices and draws horizontal lines at those l
FREE

Piyasa 4H veya 1H hareketli ortalamanın (MA) üzerindeyken alış, altındayken satış yapmayı düşünmek büyük kayıp riskini azaltır. Kazanma oranını artırır.
5 dakikalık mum kapanışının 1 saatlik (H1) veya 4 saatlik (H4) 20MA'yı kestiği tam anda sizi uyarır.
Bu araç, yüksek zaman dilimi onayına önem veren yatırımcılar için tasarlanmıştır. Arka planda piyasayı izleyerek, kritik trend değişimlerini kaçırmadan istediğiniz grafiğe odaklanmanıza olanak tanır. Onay için M5 mum kapanışını kullanarak,
FREE
Mum Genlik Osilatörü Mum Genlik Osilatörü ile piyasa volatilitesi hakkında kristal berraklığında bir bakış açısı kazanın. Bu hafif ve verimli araç, her bir mumun içindeki gerçek enerjiyi size göstermek için basit fiyat analizinin ötesine geçer ve daha bilinçli alım satım kararları vermenize yardımcı olur. Bir piyasanın aktif mi yoksa durgun mu olduğunu tahmin etmek yerine, bu indikatör size her sembol ve her zaman diliminde çalışan hassas, standartlaştırılmış bir volatilite ölçümü sunar.
FREE
Simple SuperTrend indicator, similar to that of TradingView's.
It has buffers for buy and sell signal, if you want to integrate this into an EA.
It helps traders easily identify trends by providing clear buy and sell signals based on price movements. Designed for simplicity, it’s easy to use and integrates well with various trading strategies, making it a great option for traders of all levels.
Happy trading!
FREE
This indicator monitors the vital constants of your trading account to keep it healthy and away from excessive risks. It monitors all trades, absolute exposure, account floating point and leverage currently in use, using different color codes for your interpretation. [ Installation Guide | Update Guide | Troubleshooting | FAQ | All Products ] Amazingly easy to understand The indicator is clean and simple It calculates exposure by pairs and currencies Keep your used leverage controlled at all t
FREE

KDJ Indicator for MT5 The KDJ Indicator for MT5 is a professional-grade momentum and trend analysis tool designed to help traders identify trend reversals , overbought/oversold conditions , and entry or exit opportunities with high accuracy. Originally developed as an enhancement of the Stochastic Oscillator , the KDJ adds a powerful J-line that reacts faster to price movement, giving traders earlier warnings of potential reversals. Key Features Three-Line System (K, D, J):
The K and D lines r
FREE

Adaptive Trend Master(ATM)– Kısa Kullanım Özeti
SET DOSYASI ICIN ILETISIME GECIN Adaptive Trend Master , özellikle BTC/USD ve XAU (Altın) gibi volatil piyasalarda kullanılmak üzere tasarlanmış, trend odaklı ve risk kontrollü bir otomatik işlem (Expert Advisor) sistemidir. Piyasa koşullarına göre kendini uyarlayabilen, çoklu indikatör onaylı bir algoritma ile çalışır. Ne yapar? Trend yönünü tespit eder Güçlü sinyal oluşmadan işleme girmez Her işlemde riski otomatik hesaplar Stop Loss ve Take
FREE

Bu, tahmin etmeyi bırakıp stratejinizi anlama şansınız. 281 işlem takip edildi | %64 kazanma oranı | Geçmiş verilerde %70 risk-ödül oranı Bunlar sadece sayılar değil — bu stratejinin nasıl çalıştığını gösteren gerçek istatistikler. Daha akıllıca işlem yapmanın bir yolunu arıyorsanız, bu sizi oraya götürecek araçtır. Engulfing stratejisinin gerçeğini görmek hoşunuza gitti mi? Satın aldıktan sonra bize ulaşın , diğer ürünlerimizden birini ücretsiz olarak size sağlayalım.
Diğer ürünlerimize göz at

Glow Beyond Time Ticarete yeni bir döneme hoş geldiniz. Glow Beyond Time sadece bir EA değil—sürekli gelişen piyasalarda size avantaj sağlamak için tasarlanmış sofistike bir çözümdür. Gelişmiş bir çerçeve üzerine inşa edilen bu Uzman Danışman, son teknoloji stratejileri yenilikçi risk yönetim sistemleriyle birleştirerek, güvenle ve hassasiyetle işlem yapmanızı sağlar. Request a demo-exclusive trial by contacting me directly. Early access pricing: 100. Just 9 users have purchased so far. Once 10
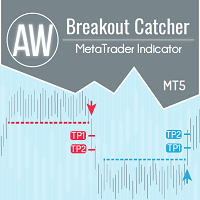
Fiyat seviyelerinin dökümü, gelişmiş istatistikler, TakeProfit hesaplaması ve 3 tür bildirim. Faydalar: Sonuçlarınızı yeniden çizmeyin Kesinlikle mumun kapanışında sinyal verin Yanlış Arıza Filtreleme Algoritması Herhangi bir trend stratejisiyle iyi gider. Tüm araçlarda ve zaman serilerinde çalışır Kılavuz ve talimat -> BURAYA / Problem çözme -> BURAYA / MT4 versiyonu -> BURAYA Gösterge ile nasıl ticaret yapılır? AW Breakout Catcher ile sadece üç kolay adımda işlem yapın: Adım 1 - Pozi

**“Multi Trendline Channel With Regression Bands” – Linear Regression Channel + Standard Deviation Band Indicator (MT5)**
This indicator automatically plots multi‑period linear regression channels together with standard deviation bands, giving traders instant clarity on trend direction, price dispersion, and key support/resistance zones. By turning complex analysis into simple, intuitive visuals, it provides discretionary traders with a clear market context at a glance.
### Key Features
FREE
MetaTrader mağazasının neden alım-satım stratejileri ve teknik göstergeler satmak için en iyi platform olduğunu biliyor musunuz? Reklam veya yazılım korumasına gerek yok, ödeme sorunları yok. Her şey MetaTrader mağazasında sağlanmaktadır.
Alım-satım fırsatlarını kaçırıyorsunuz:
- Ücretsiz alım-satım uygulamaları
- İşlem kopyalama için 8.000'den fazla sinyal
- Finansal piyasaları keşfetmek için ekonomik haberler
Kayıt
Giriş yap
Gizlilik ve Veri Koruma Politikasını ve MQL5.com Kullanım Şartlarını kabul edersiniz
Hesabınız yoksa, lütfen kaydolun
MQL5.com web sitesine giriş yapmak için çerezlerin kullanımına izin vermelisiniz.
Lütfen tarayıcınızda gerekli ayarı etkinleştirin, aksi takdirde giriş yapamazsınız.