Professional Pivot Points
- Indikatoren
-
Simon Busley
 Hallo!
Hier finden Sie eine Liste meiner Produkte: https://www.mql5.com/en/users/nomico/seller - Version: 2.81
- Aktualisiert: 23 August 2020
Mit diesem Tool können Sie die Unterstützungs- und Widerstandsniveaus der Pivot-Punkte sowie die täglichen Eröffnungs-, wöchentlichen und monatlichen Schlussniveaus auf Ihrem Diagramm anzeigen lassen und dabei ein hohes Maß an Anpassungsfähigkeit erreichen.
Pivot-Punkte sind wichtige horizontale Unterstützungs- und Widerstandsniveaus, die anhand des Höchst-, Tiefst- und Schlusskurses der vorangegangenen Periode (z. B. D1) berechnet werden. Bei diesem Indikator können Sie zwischen stündlichen und monatlichen Zeitrahmen wählen, auf denen die Pivot-Punkt-Berechnung basiert.
Es gibt eine Vielzahl von Handelsstrategien, die Pivot-Punkte und tägliche Eröffnungen, wöchentliche Schlusskurse und monatliche Schlusskurse nutzen, und das ist auch der Grund, warum sie so wichtig sind: Sie werden einfach von vielen Händlern verwendet!
Warum "Professionelle Pivot-Punkte"?
Wie ich bereits erwähnt habe, sind Pivot-Punkte sehr wichtige Unterstützungs- und Widerstandsniveaus. Da aber jeder Chart unterschiedlich auf die oft gleichen Signale reagiert, ist es extrem wichtig zu verstehen, wie Sie diese Signale für jeden Chart individuell handeln können.
Die meisten anderen Pivot-Point-Indikatoren bieten nicht die Möglichkeit, historische Niveaus anzuzeigen oder eine Zeitverschiebung auszuwählen, obwohl dies für Ihr Verständnis der Märkte und damit für Ihren Handelserfolg von entscheidender Bedeutung sein kann, um eine Handelsstrategie zu finden, die am besten zu Ihnen und dem Markt passt.
Dieser Indikator bietet verschiedene Möglichkeiten der Personalisierung, um ihn an Ihren Geschmack anzupassen. Alles, was Sie über die Anpassungsmöglichkeiten wissen müssen, werde ich weiter unten im Abschnitt "Eingabeparameter" erklären.
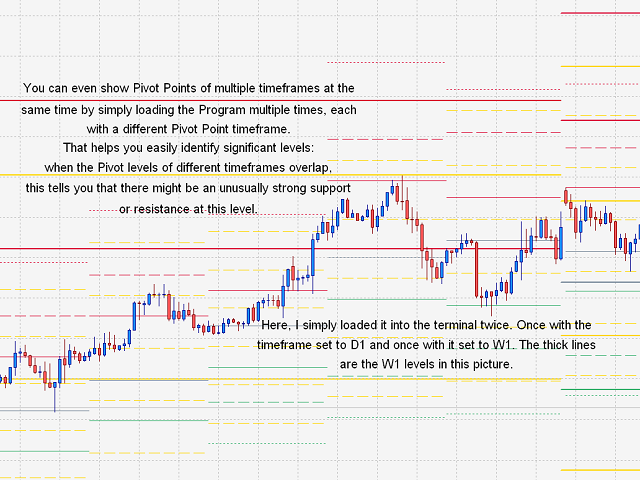
Sie können sogar ganz einfach verschiedene Niveaus mehrerer Zeitrahmen und Pivot-Berechnungsmodi auf einem Chart anzeigen, indem Sie das Programm so oft wie Sie wollen gleichzeitig nebeneinander laufen lassen, jedes Mal mit unterschiedlichen Einstellungen (siehe Screenshots). Wenn sich die Niveaus verschiedener Zeitrahmen oder Berechnungsmethoden überschneiden, bedeutet dies, dass sich in diesem Bereich eine besonders starke Unterstützung oder ein Widerstand befindet.
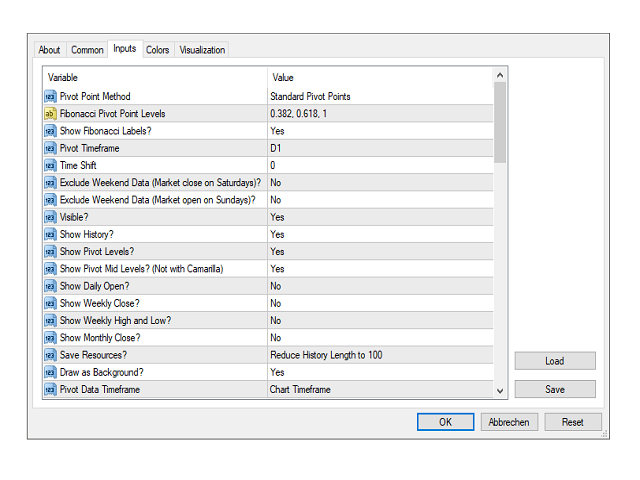
Eingabe-Parameter
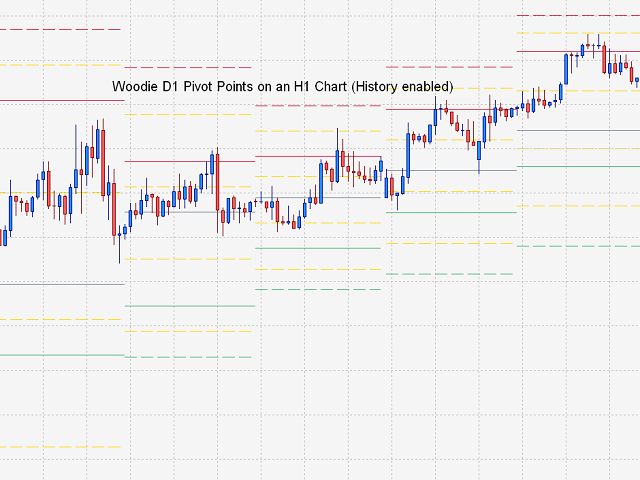
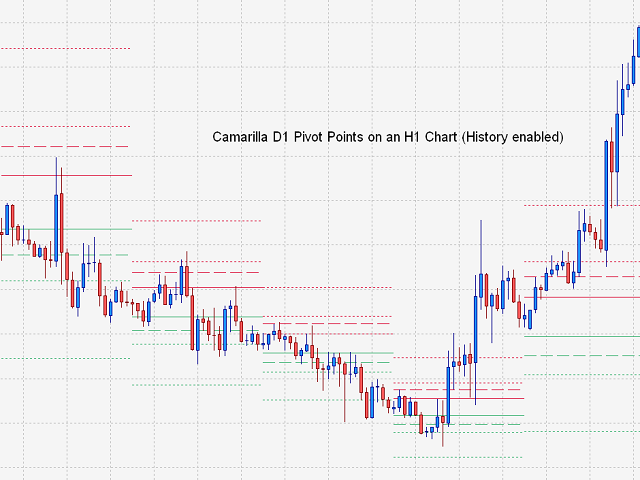
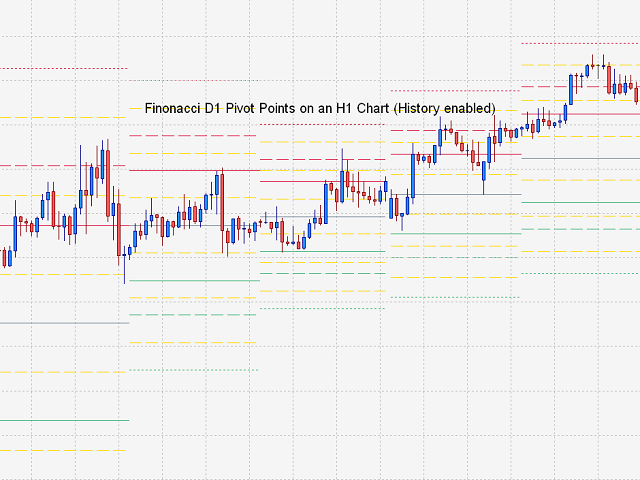
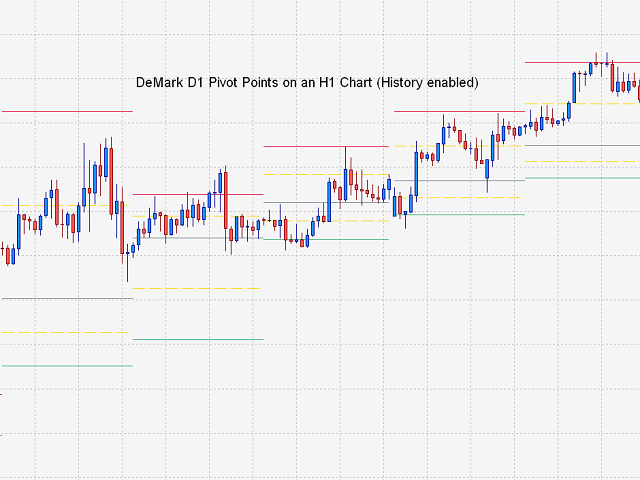
- Pivotpunkt-Methode - Wählen Sie eine Methode zur Berechnung der Pivotpunkte (Standard, Woodie, Camarilla, Fibonacci und DeMark).
- Fibonacci Pivot Points Levels - Wählen Sie, auf welchen Fibonacci-Levels Ihre Fibonacci-Pivots basieren sollen.
- Fibonacci-Levels anzeigen - Wählen Sie aus, ob Sie Beschriftungen für jedes Fibonacci-Level haben möchten, um anzuzeigen, um welches Level es sich handelt oder nicht.
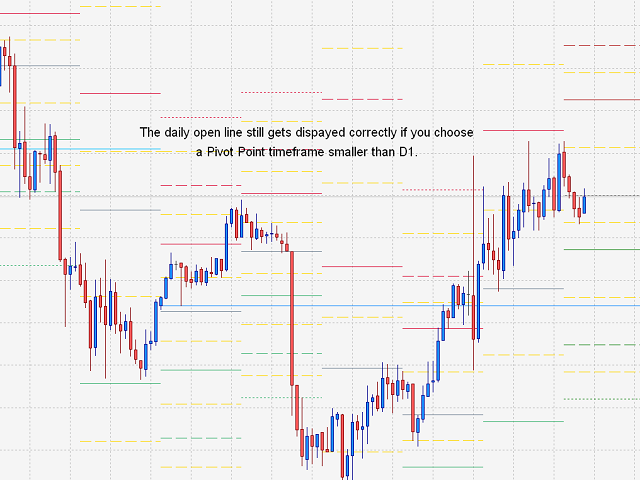
- Pivot-Zeitrahmen - Wählen Sie einen Zeitrahmen für die Berechnung der Pivot-Punkte (H4, D1, W1, MN1).
- Zeitverschiebung - Mit dieser Option können Sie die Art und Weise nachahmen, wie die täglichen Pivot-Punkte in verschiedenen Zeitzonen angezeigt werden würden. Eine Zeitverschiebung von 1 würde zum Beispiel Pivot-Punkte aus einer Zeitzone simulieren, die eine Stunde hinter Ihrer eigenen Zeitzone liegt.
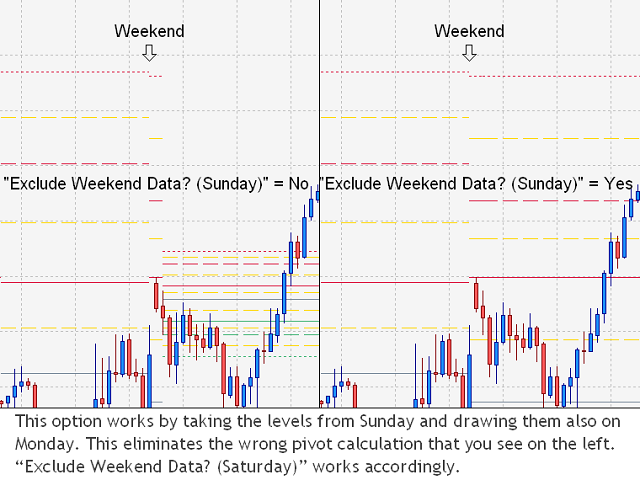
- Exclude Weekend Data (Market open on Sundays) - Wenn der (Devisen-)Markt sonntags öffnet, verhindert diese Option, dass Sie montags falsche Pivot-Punkte angezeigt bekommen, indem Daten von vor dem Wochenende verwendet werden.
- Wochenenddaten ausschließen (Markt schließt samstags) - Wenn der (Devisen-)Markt samstags schließt, können Sie diese Option verwenden, um die Pivot-Punkte über das Wochenende zu zeichnen.
- Sichtbar - Legen Sie fest, ob die Levels sichtbar sein sollen.
- Show History - Legen Sie fest, ob historische Levels auf Ihrem Chart angezeigt werden sollen.
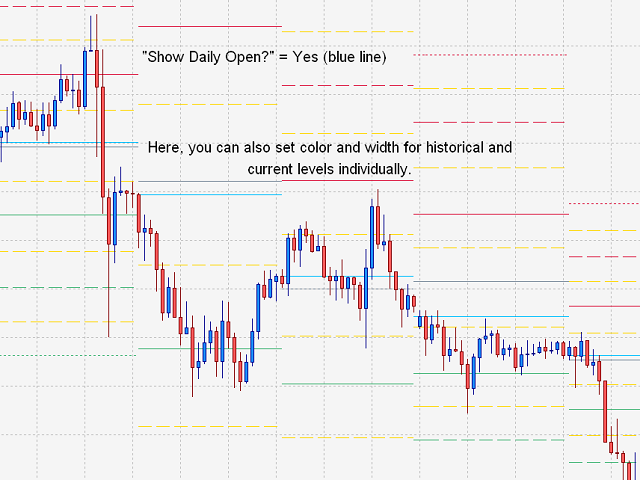
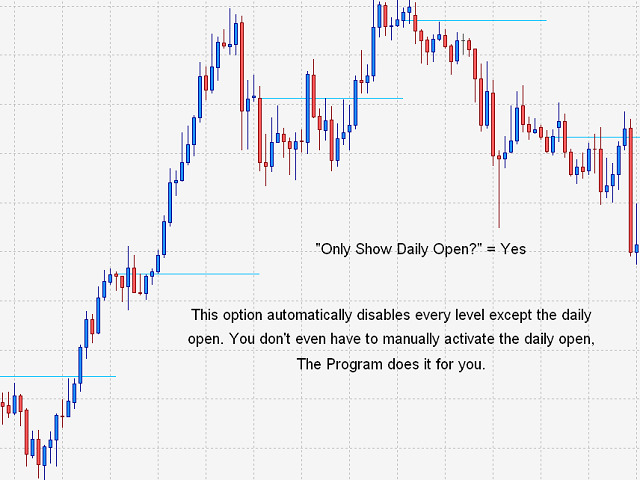
- Pivot-Levels anzeigen / Tägliches Öffnen / Wöchentliches Schließen / Wöchentliches Hoch und Tief / Monatliches Schließen - Legen Sie fest, ob der Pivot-Punkt, das tägliche Öffnen, das wöchentliche Schließen, das wöchentliche Hoch/Tief und das monatliche Schließen in Ihrem Chart angezeigt werden sollen.
- Mittlere Pivot-Levels anzeigen - Wenn Sie Pivot-Punkte in Ihrem Chart anzeigen, können Sie auswählen, ob auch mittlere Pivot-Levels angezeigt werden sollen.
- Objektressourcen sparen - Mit dieser Option können Sie die Größe der Historie (Anzahl der Ebenen im Diagramm) reduzieren und so die Ladezeiten und den Verbrauch von Ressourcen verringern.
- Als Hintergrund zeichnen - Mit dieser Option können Sie die Pivot-Ebenen als Hintergrund des Diagramms zeichnen, so dass sie das Diagramm nicht verdecken.
- Pivot-Daten-Zeitrahmen - Wenn die Ebenen nicht korrekt angezeigt werden, können Sie versuchen, diese Option zu ändern, um das Problem zu beheben.
Manchmal können die Daten eines Zeitrahmens unvollständig oder anderweitig beschädigt sein.
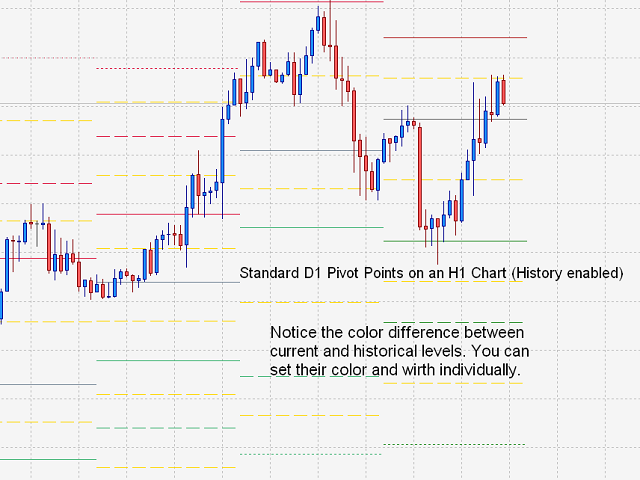
- Breite, Stil und Farbe der aktuellen und historischen Ebenen - Wählen Sie die Breite, den Stil und die Farbe der aktuellen und historischen Ebenen individuell aus.
Hinweis
- Wenn Sie einen Eindruck davon bekommen möchten, wie es funktioniert, können Sie mein Produkt "Easy Daily Open" kostenlos herunterladen. Es verwendet im Wesentlichen die gleichen Algorithmen und ist nur auf die Daily Open Funktion reduziert.
- Sollten Sie Probleme mit dem Programm haben, senden Sie mir bitte eine Nachricht, damit wir das Problem lösen können.


THANKS