
Expert Advisor für das Trading in dem Kanal
Einführung
Ich möchte meine Erfahrung mit Neulingen im Trading teilen, welche die MQL4 Grundlagen kennen, und ich werde ein Programm vorstellen das hilfreich während des Trading in einem Kanal hilfreich sein kann. Bevor Sie anfangen in dem Kanal zu handeln, müssen Sie ein klares Verständnis der dem Kanal zugrunde liegenden Prinzipien haben und wie sich Kanal-Größe und -Richtung ändern, in Abhängigkeit von der Kursbewegung. Jede Kanal-Linie wird basierend auf vollständig gebildete Fractale innerhalb des Bereichs der sichtbaren Balken im Chart gezeichnet.
Halb-Automatischer Expert Advisor für das Trading in dem Kanal
Ich werde den Standard-Programmstart hier auslassen, Sie finden ihn in den angehangenen Dateien.
Lassen Sie uns zuerst über die Anzahl der Balken für die Fractal-Suche nach Zeitrahmen entscheiden. Hier stellen wir auch den Raumwert für Pfeile zur Anzeige in dem Chart ein.
switch (Period())
{
case 1:     B_F=12; space=0.0002; break;
case 5:     B_F=48; space=0.0003; break;
case 15:    B_F=24; space=0.0004; break;
case 30:    B_F=24; space=0.0004; break;
case 60:    B_F=12; space=0.0007; break;
case 240:   B_F=15; space=0.0012; break;
case 1440:  B_F=10; space=0.0030; break;
case 10080: B_F=6;  space=0.0040; break;
}
Wir beginnen das Erstellen des Kanals mit der Suche nach Bezugspunkten (Balken), durch die Kanal-Linien gezogen werden. Für obere oder untere ermittelte Punkte, werden wir die folgenden Bedingungen auf der Ebene von globalen Variablen einführen:
- Extrem = (0) - Fractal nicht gefunden,
- Extrem = (1) - oberes Fractal gefunden, // jede positive Zahl
- Extrem = (-1) - unteres Fractal gefunden // jede negative Zahl
Lassen Sie uns die anfänglich unbestimmten Werte für Bezugspunkte und deren Positionen im Chart wie folgt festlegen:
NB1=-1; NB2=-1; Extrem=0;
Testing will start from the third bar (counted as "0") in view of the possible "fractal formation".
TestBar=2; // number of the bar being tested
Um die Fälle zu ermitteln, wo der getestete Balken mit dem maximalen oder dem minimalen Wert innerhalb den oben definierten Bereichen liegend übereinstimmt, werden wir eine 'while' Schleife hinzufügen. Die Schleifen-Bedingung wird ein Ausdruck mit negativen Werten an Balken-Nummern sein. Zusätzlich muss die Nummer des getesteten Balken kleiner sein als die Gesamtzahl der getesteten Balken.
while(((NB1==-1) || (NB2==-1)) && (TestBar<AllB))
Nehmen wir zunächst an, dass die Punkte des Extremum niedrig liegen und testen die Balken, um zu sehen, ob sie mit den minimalen Werten übereinstimmen. Wenn zwei Punkte ermittelt sind werden die Schleifen-Bedingungen falsch und die Ausführung des Operators wird beendet.
Unten ist der Ausschnitt der 'while' Schleife zum Ermitteln unterer Chartpunkte. Das Ermitteln oberer Bezugspunkte wird auf ähnliche Weise umgesetzt.
//start counting from the third bar (counted as "0") to be able to "identify the fractal"
TestBar=2;  // number of the bar being tested
NB1=-1; NB2=-1; Extrem=0;   // assume that the numbers of bars and the extremum are not determined
while(((NB1==-1) || (NB2==-1)) && (TestBar<AllB))
  {//w1
// -------------------------------------------------------------------------------------+
//  If: - the Extrem value is smaller than (1)(two possible options are: "0" and "-1"),
//  and the index of the smallest price value coincides with the index of bar under consideration
// -------------------------------------------------------------------------------------+
   if((Extrem<1) && (TestBar==iLowest(Symbol(),Period(),MODE_LOW,B_F*2+1,TestBar-B_F)))
     {//w2
      // if "0" when there was no extremum at that moment,
      if(Extrem==0)
        {//w3
         // assign: the value of (-1) to the identified point of extremum, thus indicating
         // that this is the lower extremum; the number to the determined bar (NB1) and the price value (Pr1).
         Extrem=-1; NB1=TestBar; Pr1=Low[NB1];
        }//-w3
      else  if(Extrem!=0) // the first point was found earlier
                          // otherwise the number and the price value will be assigned to point 2
        {//w4
         NB2=TestBar; Pr2=Low[NB2];
        }//-w4
      // for control purposes, the values can be printed - Print("   bar #= ",NB2," price value= ",Pr2);
     }//-w2
// -------------------------------------------------------------------------------------+
Wenn nur ein Punkt ermittelt wird, bleiben die Schleifen-Bedingungen wahr und der Operator wird fortfahren zu höheren Extrema. Wenn keine 2 höheren Punkte ermittelt werden können, bedeutet dies, dass es aktuell keine Punkte zum Erstellen eines Kanals gibt.
if((NB1==-1) || (NB2==-1)) // no datum points are found on the last AllB bars
Mit zwei verfügbaren Bezugspunkten, berechnen wir die Rate der Kursänderung:
RatePr=(Pr2-Pr1)/(NB2-NB1);
Dann ermitteln wir den ersten Bezugspunkt der Kanal-Linie als eine Projektion des ersten Bezugspunkts auf dem "0" Balken:
double Tk1=Pr1-NB1*RatePr;
Der zweite Bezugspunkt der Kanal-Linie wird innerhalb des sichbaren Bereichs auf der linken Seite des Charts ermittelt, z.B. 50 Balken links von dem zweiten Bezugspunkt.
double Tk2=Tk1+(NB2+50)*RatePr;
Zeichnen wir nun die gegenüber liegende Kanal-Linie, parallel zu der bestimmten Linie:
Um den dritten Bezugspunkt zu ermitteln, werden wir die Balken zwieschen den anderen zwei Bezugspunkten testen vonNB1 zu NB2 (oder von "0" zu NB2, und von dem zweiten Balken zu NB2). Der Test wird basierend auf Extrema ausgeführt werden die in der Richtung gegenüber zu den gefundenen Punkten liegen. Zum Beispiel, wenn die von uns bestimmten Punkte höhere Chartpunkte sind, werden die Balken auf Tiefs getestet. Nach dem Ermitteln des dritten Bezugspunkts werden die zwei anderen Bezugspunkte für die gegenüber liegende Kanal-Linie in dem gleichen Abschnitt bestimmt.
Der Ausschnitt unten wir mit ausführlichen Kommentaren breitgestellt.
// Plot the opposite channel line parallel to the determined line.
// Find the datum point for the opposite channel line:
// Take the minimum price of the 2nd bar as the origin of search.
Tk3=Low[2]-2*RatePr; // projection of the 2nd bar on the "0" bar
for(i=3;i<=NB2;i++) // start searching from the 3rd bar
  {//2(1)Up
   if(Low[i]<Tk3+i*RatePr) // using the minimum value of the price projection on the "0" bar
     {//3(1)Up
      Tk3=Low[i]-i*RatePr; // third reference point (projection on the "0" bar)
      Pr5=Low[i];          // the third datum point for the lower channel line
      NB5=i;               // number of the bar of the third datum point
     }//-3(1)Up
  }//-2(1)Up
Nachdem der dritte Bezugspunkt gefunden wurde, können Sie diese Punkte in das Chart zeichnen, nachdem Sie die existierenden vorher gelöscht haben.
Der Ausschnitt des Programms zum Zeichnen von Bezugspunkten, ist unten bereitgestellt.
ObjectDelete("Rep1"); ObjectDelete("Rep2"); ObjectDelete("Rep3"); ObjectDelete("Rep5");
   ObjectCreate("Rep1",OBJ_ARROW, 0, TmR1, Pr1+2*space);
      ObjectSet("Rep1", OBJPROP_COLOR, Yellow);
      ObjectSet("Rep1", OBJPROP_ARROWCODE,72);
   ObjectCreate("Rep2",OBJ_ARROW, 0, TmR2, Pr2+2*space);
      ObjectSet("Rep2", OBJPROP_COLOR, Yellow);
      ObjectSet("Rep2", OBJPROP_ARROWCODE,72);
   ObjectCreate("Rep5",OBJ_ARROW, 0, TmR5, Pr5-space);
      ObjectSet("Rep5", OBJPROP_COLOR, Yellow);
      ObjectSet("Rep5", OBJPROP_ARROWCODE,71);
  ObjectDelete("Cross2");
Als Ergebnis sollten Sie in der Lage sein Markierungen oberhalb/unterhalb der Bezugspunkte im Chat zu sehen (bitte sehen Sie unten).
Nach dem Bestimmen von drei Bezugspunkten und vier Refenrenzpunkten, können die Linien in das Chart gezeichnet werden:
DelObj1();
ObjectCreate("Tr1",OBJ_TREND,0,Tm2,Tk2,Tm1,Tk1);
  ObjectSet("Tr1",OBJPROP_COLOR,Lime);
  ObjectSet("Tr1",OBJPROP_WIDTH,1); //2
  ObjectSet("Tr1",OBJPROP_STYLE,STYLE_SOLID);
ObjectCreate("Tr2",OBJ_TREND,0,Tm2,Tk4,Tm1,Tk3);
  ObjectSet("Tr2",OBJPROP_COLOR,Lime);
  ObjectSet("Tr2",OBJPROP_WIDTH,1); //2
  ObjectSet("Tr2",OBJPROP_STYLE,STYLE_SOLID);
ObjectCreate("Med",OBJ_TREND,0,Tm2,(Tk2+Tk4)/2,Tm1,(Tk1+Tk3)/2);
  ObjectSet("Med",OBJPROP_COLOR,Lime);
  ObjectSet("Med",OBJPROP_WIDTH,1);
  ObjectSet("Med",OBJPROP_STYLE,STYLE_DOT);
Berechnen wir die Mittelwerte des Kanals und der Kanalgrenzen auf den letzten 6 Balken:
for(int i=0;i<6;i++)
  {
   TLUp_[i]=Tk1+i*RatePr;
   TLDn_[i]=Tk3+i*RatePr;
   Med_[i]=(TLUp_[i]+TLDn_[i])/2;
  }
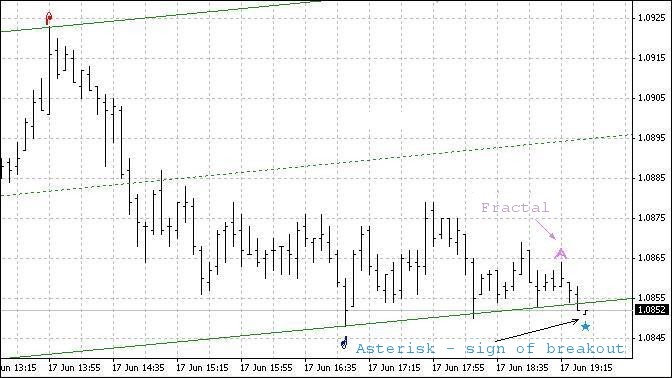
Wenn der Kurs die Kanal-Linie gekreuzt hat, markieren Sie es mit einem Stern und fügen Sie eine akustische Benachrichtigung hinzu:
if(Bid>TLUp_[0])
  {
   bool TrUp=true; //bool TrDn=false;
   ObjectDelete("Cross1");  ObjectDelete("Cross2");
   ObjectCreate("Cross1",OBJ_ARROW,0,Tm1,High[1]+2*space);
   ObjectSet("Cross1",OBJPROP_COLOR,DeepPink);
   ObjectSet("Cross1",OBJPROP_ARROWCODE,171);
   PlaySound("alert.wav"); // The file must be located under terminal_directory\sounds
  }
Wenn es ein vollständig gebildetes Fractal auf den letzten Balken gibt, markieren Sie in dem Chart:
ObjectDelete("Fraktal"+(q-1));  //ObjectDelete("Frakt"+(w-1));
ObjectCreate("Fraktal"+q,OBJ_ARROW, 0, Time[2], High[2]+2*space+0.0002);
ObjectSet   ("Fraktal"+q, OBJPROP_COLOR, Orchid);
ObjectSet   ("Fraktal"+q, OBJPROP_ARROWCODE,217);
Wir haben gerade bestimmte Besonderheiten und Programm-Ausschnitte betrachtet, bezogen auf das Erstellen des Kanals an sich.
Sagen wir nun ein paar worte zu der Möglichkeit des Trading in diesem Kanal.
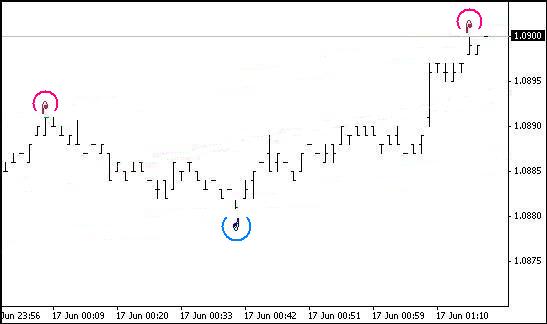
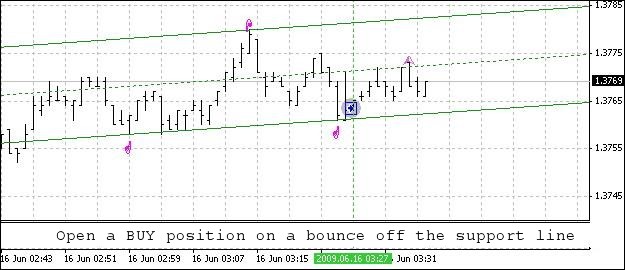
Angenommen, der Kanal ist aufwärts ausgerichtet und der aktuelle Candlestick hat sich nah an die untere Grenze des Kanals bewegt oder diese gekreuzt. Bei diesem Ereignis, kann das mögliche Verhalten wie folgt sein:
- der Kurs wird aufwärts drehen, bevor er die untere Grenze erreicht,
- der Kurs wird die untere Grenze erreichen und aufwrts drehen,
- der Kurs wird die untere Grenze überkreuzen und dann aufwärts drehen,
- nach dem Überkreuzen der unteren Grenze setzt der Kurs die Abwärtsbewegung fort (Abwärtsausbruch).
Hier ist zu beachten, dass wir minimalen Balkenwert meinen, wenn wir von der Überkreuzung der unteren Grenze durch den Balken sprechen.
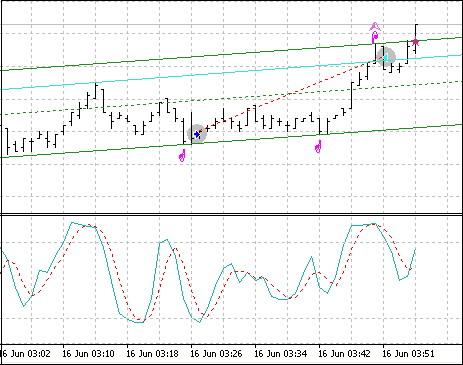
Auf den ersten Blick eignen sich die ersten drei Kurs-Bewegungsmuster zum Öffnen einer BUY Position. Sehen wir sie uns an. Wir sollten bedenken, dass der in diesem Expert Advisor erstellte Kanal auf voll ausgebildeten Fractalen basiert. Daher gibt es die Möglichkeit, dass der Kanal seine Richtung ändern kann, wenn das Fractal festgelegt wurde. d.h. auf den letzten drei Balken und wir müssen das berücksichtigen.
Bewerten wir das erste Muster. Hier wird der Balken, der dem Balken mit dem Minimum-Wert folgt, höher als der Minimum-Wert des vorherigen Balken öffnen. Und der Minimum-Wert des dritten (gezählt von links nach rechts) Balkenwird auch höher sein als das Minimum des ersten Balkens. Also, Balken 3 (gezählt von links nach rechts) ist der Minimum-Wert für die Bildung des Fractals. Und wenn die Aufwärtsrichtung des Kanals sich nicht geändert hat, können wir eine BUY Position öffnen.
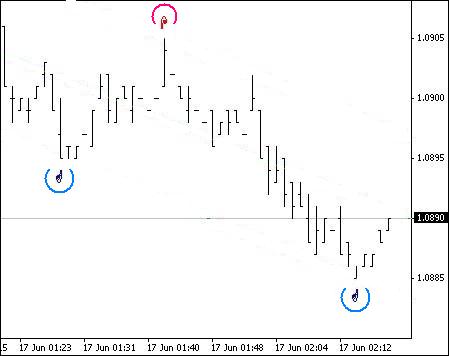
Jetzt ein paar Worte bezüglich der Änderung in der Richtung des Kanals. Wenn der Kanal basierend auf unteren Bezugspunkten gezeichnet wurde, wird die Kanalrichtung sich nicht ändern, weil der minimale Fractalpunkt oberhalb der unteren Kanal-Linie liegt.
Wurde der Kanal basierend auf höheren Bezugspunkten gezeichnet, wird die Kanalrichtung die gleiche bleiben. Die Frage, die aus den Mustern heraus aufkommt ist, welches Maß Differenz zwischen der unteren Kanalgrenze und dem Minimum-Wert des am nächsten zu dieser Grenze gebildeten Fractal kann als ausreichend betrachtet werden. Dieses Maß hängt in erster Linie von der Größe des Kanals ab.
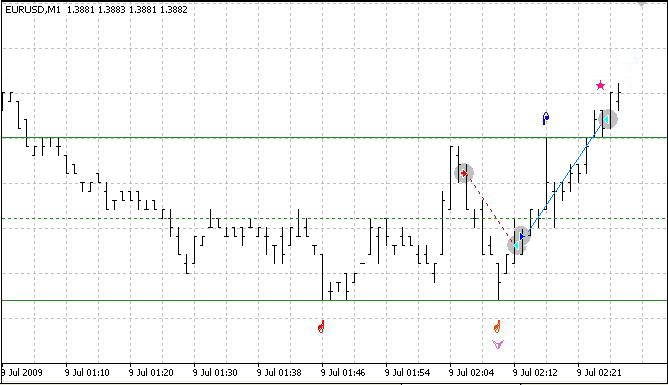
Das dritte Kurs-Bewegungsmuster führt in der Regel zu der Änderung in der Neigung des Kanals und manchmal resultiert es sogar in der Änderung der Kanalrichtung, da das Fractal unterhalb der unteren Kanalgrenze gebildet wurde. Wurde der Kanal basierend auf Minimum-Werte der ersten zwei Bezugspunkte erstellt, während der Wert des gebildeten Fractals sich als niedriger als der erste Referenzpunkt und höher als der zweite Referenzpunkt, wird die Kanalneigung angepasst und die Richtung wird aufwärts bleiben.
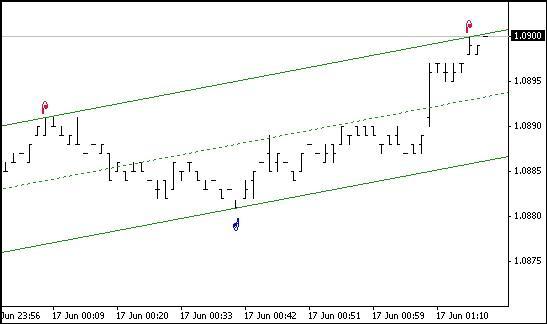
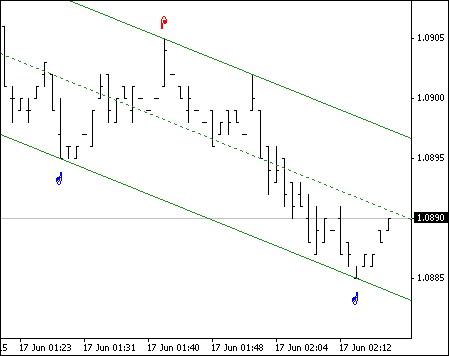
Sollte der Minimum Balkenwert des gebildeten Fractals auch niedriger als der zweite Referenzpunkt sein, wird die Kanalrichtung abwärts werden. Das gleiche gilt für SELL Positionen, nur im gegenteiligen Weg. Unten befinden sich Beispiele des Trading mit dem vorgeschlagenen Expert Advisor.
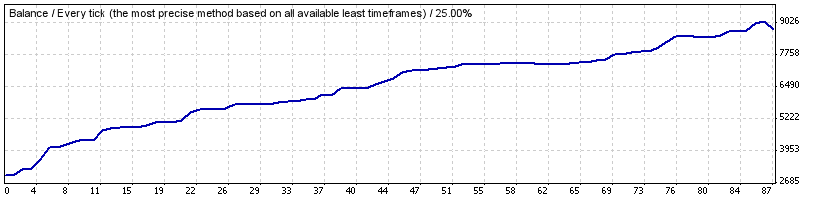
In den Order Öffnen und Tracking Blöcken, finden Sie ein Beispiel von Position Öffnung- und Schließ-Bedingungen, getestet im Demo-Modus. Testergebnis:
Der volle Programmcode steht unten bereit:
//+------------------------------------------------------------------+
//|                                             Expert_Ch_v83_2_.mq4 |
//|                                            2009, author - Genkov |
//|                                                     Genkov@bk.ru |
//+------------------------------------------------------------------+
#property copyright "2009, author - Genkov"
#property link      "Genkov@bk.ru"
//+------------------------------------------------------------------+
extern double SL_B=200;
extern double TP_B=50;
extern double SL_S=200;
extern double TP_S=50;
extern double Lots=1.0;
double TrailingStop=40;
int Magic,i;
extern int AllB=240;        // number of bars for calculations
int TestBar=0;              // index of the bar being tested
double RatePr=0;            // rate of price change - pips/bars
int NB1=-1,NB2=-1,NB3,NB5;  // numbers of bars of datum points
int Extrem=0;               // indices of the points of extremum:
/* Extrem = (0)  - fractal not found,
     Extrem = (1)  - upper fractal found, (any positive number)
     Extrem = (-1) - lower fractal found   (any negative number)
  */
double Pr1=0,Pr2=0,Pr3,Pr5,// prices of datum bars with fractals
Tk1,Tk2,Tk3,Tk4,Tk5; // prices of reference points for plotting the channel lines
double space;               // distance from the price to the "arrow"
double TLUp_[10],TLDn_[10],// values of channel boundaries
Med_[10];
int B_F=0;                  // number of bars for fractals in a period
datetime Tm1,Tm2,Tm3,Tm5;   // time of bars of reference points
string SH;                  // channel slope
bool FraktUp=false;         // flag of the upper fractal mark
bool FraktDn=false;         // flag of the lower fractal mark
int q,w;
//+------------------------------------------------------------------+

//+------------------------------------------------------------------+
void DelObj1()
  {
   ObjectDelete("Tr1");
   ObjectDelete("Tr2");
   ObjectDelete("Med");
  }
//+------------------------------------------------------------------+
void Op_Sell_Ch()
  {
   if(!OrderSend(Symbol(),OP_SELL,Lots,Bid,2,Ask+SL_S*Point,Bid-TP_S*Point," ",Magic,0,Red))
     { Print("  Error when opening a SELL order  # ",GetLastError()); }
   return(0);
  }
//+------------------------------------------------------------------+
void Op_Buy_Ch()
  {
   if(!OrderSend(Symbol(),OP_BUY,Lots,Ask,2,Bid-SL_B*Point,Ask+TP_B*Point," ",Magic,0,Blue))
     { Print("  Error when opening a SELL order  # ",GetLastError()); }
   return(0);
  }
//+------------------------------------------------------------------+
void Close_B_lot()
  {
   if(!OrderClose(OrderTicket(),OrderLots(),Bid,2,HotPink)) // closing 0.1 lot
     {
      Print(" Closed order #= ",OrderTicket(),"Error #= ",GetLastError());
      RefreshRates();
     }
  }
//+------------------------------------------------------------------+
void Close_S_lot()
  {
   if(!OrderClose(OrderTicket(),OrderLots(),Ask,2,Aqua)) // closing 0.1 lot
     {
      Print(" Closed order #= ",OrderTicket(),"Error #= ",GetLastError());
      RefreshRates();
     }
  }
// ===================================================================+
int start()
  {
   int StopLevel=MarketInfo(Symbol(),MODE_STOPLEVEL);
// number of bars for fractal search by periods
   switch(Period())
     {
      case 1:     B_F=12; space=0.0002; break;
      case 5:     B_F=48; space=0.0003; break;
      case 15:    B_F=24; space=0.0004; break;
      case 30:    B_F=24; space=0.0004; break;
      case 60:    B_F=12; space=0.0007; break;
      case 240:   B_F=15; space=0.0012; break;
      case 1440:  B_F=10; space=0.0030; break;
      case 10080: B_F=6;  space=0.0040; break;
     }
// ====================================================================================+
// create a channel:
//start counting from the third bar (counted as "0") to be able to "identify the fractal"
   TestBar=2;  // number of the bar being tested
   NB1=-1; NB2=-1; Extrem=0;   // assume that the numbers of bars and the extremum are not determined
   while(((NB1==-1) || (NB2==-1)) && (TestBar<AllB))
     {//w1
      // -------------------------------------------------------------------------------+
      //  If: - the Extrem value is smaller than (1)(two possible options are: "0" and "-1"),
      //  and the index of the smallest price value coincides with the index of bar under consideration
      // -------------------------------------------------------------------------------+
      if((Extrem<1) && (TestBar==iLowest(Symbol(),Period(),MODE_LOW,B_F*2+1,TestBar-B_F)))
        {//w2
         // if "0" when there was no extremum at that moment,
         if(Extrem==0)
           {//w3
            // assign: the value of (-1) to the identified point of extremum, thus indicating
            // that this is the lower extremum; the number to the determined bar (NB1) and the price value (Pr1).
            Extrem=-1; NB1=TestBar; Pr1=Low[NB1];
           }//-w3
         else  if(Extrem!=0) // the first point was found earlier
                             // otherwise the number and the price value will be assigned to point 2
           {//w4
            NB2=TestBar; Pr2=Low[NB2];
           }//-w4
         // for control purposes, the values can be printed - Print("   bar #= ",NB2," price value= ",Pr2);
        }//-w2
      // -------------------------------------------------------------------------------+
      //  If: - the Extrem value is greater than (-1)(possible options are: 0 and 1), and the index of the highest price
      //  value coincides with the number of the bar under consideration - (similar to the above)
      // -------------------------------------------------------------------------------+
      if((Extrem>-1) && (TestBar==iHighest(Symbol(),Period(),MODE_HIGH,B_F*2+1,TestBar-B_F)))
        {//w5
         // if Extrem==0
         if(Extrem==0)
           {//w6
            // store the bar number (NB1) and the price value (Pr1).
            Extrem=1; NB1=TestBar; Pr1=High[NB1];
           }//-w6
         else // otherwise the number and the price value will be assigned to point 2
           {//w7
            NB2=TestBar; Pr2=High[NB2];
           }//-w7
        }//-w5
      TestBar++;
     }//-w1
// -----------------------------------------------------------------------------------+
   if((NB1==-1) || (NB2==-1)) // no datum points found on the last AllB bars
     {
      DelObj1(); ObjectDelete("Cross1"); ObjectDelete("Cross2");  ObjectDelete("Rep1");
      ObjectDelete("Rep2"); ObjectDelete("Rep3"); ObjectDelete("Rep5");
      // Print(" === > no bars for the channel "); // for control purposes only (can be deleted)
      return(-1);
     }
// ---------------------------------
// Calculate the rate of price change.
   RatePr=(Pr2-Pr1)/(NB2-NB1);
// if the value is positive, we are dealing with a downward channel, otherwise - upward.
   if(RatePr>0) SH="downward"; else  SH="upward";
// determine the time of datum points for the channel lines
   Tm1=Time[0];    Tm2=Time[NB2+50];
// **************************************************************************************
   if(Extrem==1) // if a higher extremum has been found first
     {//1(Extrem=1)
      // with two datum points and the rate of price change available,
      // determine reference points of this line:
      // the first reference point is the projection of the datum point on the "0" bar
      double Tk1=Pr1-NB1*RatePr;
      // the second reference point is the projection on the left-hand side of the chart
      double Tk2=Tk1+(NB2+50)*RatePr;
      // Plot the opposite channel line parallel to the determined line.
      // Find the datum point for the opposite channel line:
      // Take the minimum price of the 2nd bar as the origin of search.
      Tk3=Low[2]-2*RatePr; // projection of the 2nd bar on the "0" bar
      for(i=3;i<=NB2;i++) // start searching from the 3rd bar
        {//2(1)Up
         if(Low[i]<Tk3+i*RatePr) // using the minimum value of the price projection on the "0" bar
           {//3(1)Up
            Tk3=Low[i]-i*RatePr; // third reference point (projection on the "0" bar)
            Pr5=Low[i];          // the third datum point for the lower channel line
            NB5=i;               // number of the bar of the third datum point
           }//-3(1)Up
        }//-2(1)Up
      // now take a look at the first two bars: "0" and "1"; their Min values may turn out to be lower than the 2nd bar
      // if we consider adjustment of the channel using these two bars, the channel will be
      // becoming wider following the downward price movement; if this is ignored, the downward price movement
      // can be considered as the channel line breakout (possible beginning of the trend!)
      // if(Low[0]<Tk3) {Tk3=Low[0]; Pr5=Low[0]; NB5=0;}
      // if(Low[1]<Tk3+RatePr) {Tk3=Tk3+RatePr; Pr5=Low[1]; NB5=1;}
      datetime TmR1=Time[NB1];    datetime TmR2=Time[NB2];   datetime TmR5=Time[NB5];
      // -------------------------------------------------------------------------------------
      // the following operators are intended for visual control of the program performance only (they can be deleted)
      // and display the channel slope value, speed rate, numbers and time of the datum points at Extrem=1
      string TNB1=TimeToStr(TmR1,TIME_DATE|TIME_MINUTES);
      string TNB2=TimeToStr(TmR2,TIME_DATE|TIME_MINUTES);
      string TNB5=TimeToStr(TmR5,TIME_DATE|TIME_MINUTES);
      //   Print(" channel- ",SH," ; speed = ",DoubleToStr(NormalizeDouble(RatePr,8),8),
      //         " pip / bar"," ; Extrem= ",Extrem);
      //   Print(" NB2= ",NB2," ; time= ",TNB2," ; NB5= ",NB5,
      //         " ; time= ",TNB5," ; NB1= ",NB1," ; time= ",TNB1);
      // --------------------------------------------------------------------------------------
      // for clarity of the program performance, mark the datum points on the channel lines in the chart
      ObjectDelete("Rep1"); ObjectDelete("Rep2"); ObjectDelete("Rep3"); ObjectDelete("Rep5");
      ObjectCreate("Rep1",OBJ_ARROW,0,TmR1,Pr1+2*space);
      ObjectSet("Rep1",OBJPROP_COLOR,Yellow);
      ObjectSet("Rep1",OBJPROP_ARROWCODE,72);
      ObjectCreate("Rep2",OBJ_ARROW,0,TmR2,Pr2+2*space);
      ObjectSet("Rep2",OBJPROP_COLOR,Yellow);
      ObjectSet("Rep2",OBJPROP_ARROWCODE,72);
      ObjectCreate("Rep5",OBJ_ARROW,0,TmR5,Pr5-space);
      ObjectSet("Rep5",OBJPROP_COLOR,Yellow);
      ObjectSet("Rep5",OBJPROP_ARROWCODE,71);
      ObjectDelete("Cross2");
      // -------------------------------------------------------------------------------------
      // calculate prices for coordinates of reference points on the lower channel boundary:
      double Tk3=Pr5-RatePr*NB5; // price of the lower channel boundary in the "0" point
      double Tk4=Tk3+RatePr*(NB2+50);// price of the lower channel boundary in the left-hand side of the chart
     }//- 1(Extrem=1)
// ******************************************************************************************
   else  if(Extrem==-1)// if a lower extremum has been found first
     {//1(Extrem= -1)
                                     // prices of reference points on the lower channel boundary:
      Tk3=Pr1-NB1*RatePr;      // in the "0" point
      Tk4=Tk3+(NB2+50)*RatePr; // in the left-hand side point
                               // Plot the opposite channel line parallel to the determined line.
      // Find the datum point for the opposite channel line.
      // Take the price of the 2nd bar as the origin of search.
      Tk1=High[2]-2*RatePr; // projection of the 2nd bar on the "0" bar
      for(i=3;i<=NB2;i++) // start searching from the 3rd bar
        {//2(-1)
         if(High[i]>Tk1+i*RatePr)
           {//3(-1)
            Tk1=High[i]-i*RatePr; // the third reference point (projection on the "0" bar)
            Pr3=High[i];          // the third datum point for the upper channel line
            NB3=i;                // number of the bar of the third datum point
           }//-3(-1)
         // now take a look at the first two bars: "0" and "1"
         // if(High[0]>Tk1) {Tk1=High[0]; Pr3=High[0]; NB3=0;}
         // if(High[1]>Tk1+RatePr) {Tk1=Tk1+RatePr; Pr3=High[1]; NB3=1;}
         TmR1=Time[NB1];    TmR2=Time[NB2];   datetime TmR3=Time[NB3];
        }//- 2(-1)
      // ---------------------------------------------------------------------------------
      // add the following operators to monitor the performance results
      //(they do not affect the program performance and can be deleted),
      // they display the channel (speed) slope value, speed rate, as well as numbers
      // and time of the datum points at Extrem = -1
      // TNB1=TimeToStr(TmR1,TIME_DATE|TIME_MINUTES);
      // TNB2=TimeToStr(TmR2,TIME_DATE|TIME_MINUTES);
      // string TNB3=TimeToStr(TmR3,TIME_DATE|TIME_MINUTES);
      // Print(" channel- ",SH," ; price speed rate= ",DoubleToStr(NormalizeDouble(RatePr,8),8),
      //       " pip / bar"," ; Extrem= ",Extrem);
      // Print(" ; NB2= ",NB2," ; time= ",TNB2," ; NB3= ",NB3,
      //       " ; time= ",TNB3," ; NB1= ",NB1," ; time= ",TNB1);
      // ----------------------------------------------------------------------------------
      // for clarity, mark the datum points on the channel lines in the chart
      ObjectDelete("Rep1"); ObjectDelete("Rep2");
      ObjectDelete("Rep3"); ObjectDelete("Rep5");
      ObjectCreate("Rep1",OBJ_ARROW,0,TmR1,Pr1-space);
      ObjectSet("Rep1",OBJPROP_COLOR,Yellow);
      ObjectSet("Rep1",OBJPROP_ARROWCODE,71);
      ObjectCreate("Rep2",OBJ_ARROW,0,TmR2,Pr2-space);
      ObjectSet("Rep2",OBJPROP_COLOR,Yellow);
      ObjectSet("Rep2",OBJPROP_ARROWCODE,71);
      ObjectCreate("Rep3",OBJ_ARROW,0,TmR3,Pr3+2*space);
      ObjectSet("Rep3",OBJPROP_COLOR,Yellow);
      ObjectSet("Rep3",OBJPROP_ARROWCODE,72);
      ObjectDelete("Cross1");
      // ---------------------------------------------------------------------------------
      // calculate prices of the reference points on the upper channel boundary:
      Tk1=Pr3-RatePr*NB3; // price of the upper channel boundary in the "0" point
      Tk2=Tk1+RatePr*(NB2+50);// price of the upper channel boundary in the left-hand side point
     }//-1(Extrem= -1)
// ---------------------------------======================================================
// calculate the median values of the channel and channel boundaries on the last 6 bars
   for(int i=0;i<6;i++)
     {
      TLUp_[i]=Tk1+i*RatePr;
      TLDn_[i]=Tk3+i*RatePr;
      Med_[i]=(TLUp_[i]+TLDn_[i])/2;
     }
// --------------------------------------------------------------------
//If the price has crossed the upper channel line, mark it with an asterisk and add a sound notification
   if(Bid>TLUp_[0])
     {
      bool TrUp=true; //bool TrDn=false;
      ObjectDelete("Cross1");  ObjectDelete("Cross2");
      ObjectCreate("Cross1",OBJ_ARROW,0,Tm1,High[1]+2*space);
      ObjectSet("Cross1",OBJPROP_COLOR,DeepPink);
      ObjectSet("Cross1",OBJPROP_ARROWCODE,171);
      PlaySound("alert.wav"); // The file must be located under terminal_directory\sounds
     }
//If the price has crossed the lower channel line, mark it with an asterisk and add a sound notification
   if(Bid<TLDn_[0])
     {
      ObjectDelete("Cross2");  ObjectDelete("Cross1");
      /// Print(" there was a crossover of the lower channel line ");
      ObjectCreate("Cross2",OBJ_ARROW,0,Tm1,Low[1]-space);
      ObjectSet("Cross2",OBJPROP_COLOR,DodgerBlue);
      ObjectSet("Cross2",OBJPROP_ARROWCODE,171);
      PlaySound("alert.wav"); // The file must be located under terminal_directory\sounds
     }
// -------------------------------------------------------------------------------------
// plot the channel boundaries in the chart, having deleted the existing ones beforehand
   DelObj1();
   ObjectCreate("Tr1",OBJ_TREND,0,Tm2,Tk2,Tm1,Tk1);
   ObjectSet("Tr1",OBJPROP_COLOR,Lime);
   ObjectSet("Tr1",OBJPROP_WIDTH,1); //2
   ObjectSet("Tr1",OBJPROP_STYLE,STYLE_SOLID);
   ObjectCreate("Tr2",OBJ_TREND,0,Tm2,Tk4,Tm1,Tk3);
   ObjectSet("Tr2",OBJPROP_COLOR,Lime);
   ObjectSet("Tr2",OBJPROP_WIDTH,1); //2
   ObjectSet("Tr2",OBJPROP_STYLE,STYLE_SOLID);
   ObjectCreate("Med",OBJ_TREND,0,Tm2,(Tk2+Tk4)/2,Tm1,(Tk1+Tk3)/2);
   ObjectSet("Med",OBJPROP_COLOR,Lime);
   ObjectSet("Med",OBJPROP_WIDTH,1);
   ObjectSet("Med",OBJPROP_STYLE,STYLE_DOT);
// ---- Block of marking fractals in the chart ---------------------------------
   if((High[2]>High[1] && Bid<High[2] && High[2]>High[3] && High[2]>High[4]) ||
      (High[2]==High[1] && Bid<High[1] && High[2]>High[3] && High[2]>High[4]))
     {
      double FraktalUp=High[2]; // upper fractal
      double FraktalDn=0;
      // if the fractal has formed, put a mark, and if this fractal caused
      // a new datum point - delete the mark for the crossover of the upper channel line by the price.
      if(High[2]>=TLUp_[i]) ObjectDelete("Cross1");
      ObjectDelete("Fraktal"+(q-1));  //ObjectDelete("Frakt"+(w-1));
      ObjectCreate("Fraktal"+q,OBJ_ARROW,0,Time[2],High[2]+2*space+0.0002);
      ObjectSet("Fraktal"+q,OBJPROP_COLOR,Orchid);
      ObjectSet("Fraktal"+q,OBJPROP_ARROWCODE,217);
      bool FraktUp=true; //bool FraktDn=false;// it will be useful when trading
      q++;
     }
   if((Low[2]<Low[1] && Bid>Low[2] && Low[2]<Low[3] && Low[2]<Low[4]) ||
      (Low[2]==Low[1] && Bid>Low[1] && Low[2]<Low[3] && Low[2]<Low[4]))
     {
      FraktalDn=Low[2]; // lower fractal
      FraktalUp=0;
      if(Low[2]>=TLUp_[i]) ObjectDelete("Cross2");
      ObjectDelete("Frakt"+(w-1)); //ObjectDelete("Fraktal"+(q-1));
      ObjectCreate("Frakt"+w,OBJ_ARROW,0,Time[2],Low[2]-2*space);
      ObjectSet("Frakt"+w,OBJPROP_COLOR,Orchid);
      ObjectSet("Frakt"+w,OBJPROP_ARROWCODE,218);
      FraktDn=true; FraktUp=false;
      w++;
     }
// ---------------------------------------------------------------+
// Block of position opening conditions.   This is just an example  +
// and it should not be deemed a recommendation for use!+
// ---------------------------------------------------------------+
   if(OrdersTotal()<1) // trade one position
     {
      // - 16- SELL ---
      if(Extrem==1 && // two upper datum points
         RatePr>0 && // channel directed downwards
         (Tk1-Tk3)>20*Point && // channel size > 20pip
         Bid<High[1] && // the price is lower than the previous bar
         (TLUp_[1]-High[1])<3*Point) // the first bar is within 3pip from the upper channel line
        {
         Print(" Open - 16-SELL === ");
         //   SL_S=50;
         //   if(SL_S<StopLevel) SL_S=StopLevel;
         //   TP_S=80;
         Op_Sell_Ch();
         return(0);
        }
      // - 18- BUY ---
      if(Extrem==-1 && // two lower datum points
         RatePr<0 && // channel directed upwards
         (Tk1-Tk3)>20*Point && // channel size > 20pip
         Bid>Low[1] && // the price is higher than the previous bar
         (Low[1]-TLDn_[1])<3*Point) // the 1st bar is within 3pip from the lower channel line
        {
         Print(" Open - 18-BUY === ");
         //    SL_B=50;
         //    if(SL_B<StopLevel) SL_B=StopLevel;
         //    TP_B=80;
         Op_Buy_Ch();
         return(0);
        }
     }
//------------------------------------------------------------------------+
// Tracking open SELL positions                                    |
//+=======================================================================+
   for(i=OrdersTotal()-1;i>=0;i--) // SELL order selection loop
     {//1-position selection loop
      if(!OrderSelect(i,SELECT_BY_POS,MODE_TRADES))
        {Print("Order selection error = ",GetLastError()); }
      if(OrderType()==OP_SELL) // if there is an open Sell order
        { //2-type_Sell
         if((FraktalDn<=TLDn_[2] ||
            Low[2]<=TLDn_[2]) &&
            (Bid>Low[1] && Low[1]<=TLDn_[1]) &&
            (OrderOpenPrice()-Bid)*Point>0) // not at a loss!
           {//5
            Print(" close by the lower channel line ");
            Close_S_lot();
            // and if the channel is directed upwards
            if(RatePr<0)
              {
               Print(" Open a Buy position ");
               Op_Buy_Ch();
              }
           }//-5
        }//-2 type_Sell
      //------------------------------------------------------------------------+
      // Tracking open BUY positions                   |
      //+=======================================================================+
      else
      if(OrderType()==OP_BUY) // if there is an open Buy order
        { //4-type_Buy
         if((FraktalUp>=TLUp_[2] ||
            High[2]>=TLUp_[2]) &&
            // If the channel is created based on the lower datum points and is directed upwards,
            // while the price has crossed the upper boundary,  and is about to move down,
            //bar "1" was higher than bar "0" and higher than bar "2" which was situated on the upper channel line,
            // this looks like the upper fractal formation and channel size increase.
            // At the same time, Stochastic is above 80.0
            // and it starts going down to cross the signal line.
            // So we should not expect bar "0" to get fully formed as it is highly likely
            // that the price will go down. Therefore close the BUY position.
            (Bid<High[1] && High[1]>=TLUp_[1]) &&
            (Ask-OrderOpenPrice())*Point>0) // not at a loss!
           {//5
            Print(" close by the upper channel line ");
            Close_B_lot();
            // and if the channel is directed downwards
            if(RatePr>0)
              {
               Print(" Open a Sell position ");
               Op_Sell_Ch();
              }
           }//-5
        }//-4-type_Buy
     }//-1 position selection loop
//----------------
   return(0);
  }
//+------------------------------------------------------------------+
Fazit
Ich glaube, dass die Frage bezüglich des Trading innerhalb des Kanals positiv beantwortet werden muss. Ich freue mich über jedes kritische Feedback, um in der Lage zu sein den Expert Advisor weiter zu verbessern. Und ich bin zuversichtlich, dass meine Erfahrung nicht nur für Neulinge im Trading nützlich sein wird.
Übersetzt aus dem Russischen von MetaQuotes Ltd.
Originalartikel: https://www.mql5.com/ru/articles/1375
Warnung: Alle Rechte sind von MetaQuotes Ltd. vorbehalten. Kopieren oder Vervielfältigen untersagt.
Dieser Artikel wurde von einem Nutzer der Website verfasst und gibt dessen persönliche Meinung wieder. MetaQuotes Ltd übernimmt keine Verantwortung für die Richtigkeit der dargestellten Informationen oder für Folgen, die sich aus der Anwendung der beschriebenen Lösungen, Strategien oder Empfehlungen ergeben.
 EA Status SMS Benachrichtigung
 Einfache Methoden zur Prognose der Richtungen von Japanischen Candlesticks
 Lite_EXPERT2.mqh: Functionales Kit für Entwickler von Expert Advisors
 Wie Zuverlässig ist Nacht-Trading?
- Freie Handelsapplikationen
- Über 8.000 Signale zum Kopieren
- Wirtschaftsnachrichten für die Lage an den Finanzmärkte
Sie stimmen der Website-Richtlinie und den Nutzungsbedingungen zu.