
用于在通道中进行交易的 Expert Advisor
简介
我很乐意与了解 MQL4 基础知识的新手交易者们分享我的经验,我将介绍一个在通道中进行交易时会很有用的程序。 在通道中进行交易之前,你应清楚地了解通道的基本原则以及通道大小和方向会如何随着价格变动而发生变化。 每条通道线都是基于图表中可视条柱范围内完全形成的分形而绘制的。
用于在通道中进行交易的半自动 Expert Advisor
这里我将略去标准程序启动。 你可以在随附文件中找到这部分内容。
首先,让我们确定分形按周期搜索的条柱数量。 这里我们还将设置要显示在图表中的箭头的空间值。
switch (Period())
{
case 1:     B_F=12; space=0.0002; break;
case 5:     B_F=48; space=0.0003; break;
case 15:    B_F=24; space=0.0004; break;
case 30:    B_F=24; space=0.0004; break;
case 60:    B_F=12; space=0.0007; break;
case 240:   B_F=15; space=0.0012; break;
case 1440:  B_F=10; space=0.0030; break;
case 10080: B_F=6;  space=0.0040; break;
}
我们搜索作为通道线绘制依据的基准点(条柱),从该处开始绘制通道线。 对于已确定的较上或较下的点,我们将在全局变量级别引入以下条件:
- Extrem = (0) - 未找到分形,
- Extrem = (1) - 找到上分形 // 任何正值
- Extrem = (-1) - 找到下分形 // 任何负值
让我们设置基准点的初始不确定性值及其在图表中的位置,如下所示:
NB1=-1; NB2=-1; Extrem=0;
考虑到可能的“分形形态”,测试将从第三个条柱(计为“0”)开始。
TestBar=2; // number of the bar being tested
为了确定测试条柱与上述定义范围内的最大值还是最小值匹配,我们将添加一个“while”循环。 此循环条件将是一个带负条柱编号值的表达式。 此外,要测试的条柱编号必须小于测试条柱的总数。
while(((NB1==-1) || (NB2==-1)) && (TestBar<AllB))
首先让我们假设极值点较低,并测试条柱以查看它们是否与最小值匹配。 如果找到两个点,则循环条件将变为 false,运算符的执行将被终止。
以下是“while”循环的一个片段,用于确定图表较低点。 搜索高基准点的方式也是类似的。
//start counting from the third bar (counted as "0") to be able to "identify the fractal"
TestBar=2;  // number of the bar being tested
NB1=-1; NB2=-1; Extrem=0;   // assume that the numbers of bars and the extremum are not determined
while(((NB1==-1) || (NB2==-1)) && (TestBar<AllB))
  {//w1
// -------------------------------------------------------------------------------------+
//  If: - the Extrem value is smaller than (1)(two possible options are: "0" and "-1"),
//  and the index of the smallest price value coincides with the index of bar under consideration
// -------------------------------------------------------------------------------------+
   if((Extrem<1) && (TestBar==iLowest(Symbol(),Period(),MODE_LOW,B_F*2+1,TestBar-B_F)))
     {//w2
      // if "0" when there was no extremum at that moment,
      if(Extrem==0)
        {//w3
         // assign: the value of (-1) to the identified point of extremum, thus indicating
         // that this is the lower extremum; the number to the determined bar (NB1) and the price value (Pr1).
         Extrem=-1; NB1=TestBar; Pr1=Low[NB1];
        }//-w3
      else  if(Extrem!=0) // the first point was found earlier
                          // otherwise the number and the price value will be assigned to point 2
        {//w4
         NB2=TestBar; Pr2=Low[NB2];
        }//-w4
      // for control purposes, the values can be printed - Print("   bar #= ",NB2," price value= ",Pr2);
     }//-w2
// -------------------------------------------------------------------------------------+
如果只找到一个点,则循环条件将保持为 true,运算符将继续处理较高极值。 如果找不到 2 个较高点,则意味着当前没有点可用于创建通道。
if((NB1==-1) || (NB2==-1)) // no datum points are found on the last AllB bars
利用两个可用基准点,我们计算价格变动率:
RatePr=(Pr2-Pr1)/(NB2-NB1);
然后我们找出通道线的第一个参考点,作为“0”条柱上第一个基准点的投影:
double Tk1=Pr1-NB1*RatePr;
通道线的第二个参考点位于图表左侧的可视范围内,例如从第二个基准点往左 50 根条柱之处。
double Tk2=Tk1+(NB2+50)*RatePr;
现在让我们绘制与已确定线平行但方向相反的通道线:
为了找到第三个基准点,我们将测试从 NB1 到 NB2(或从“0”到 NB2,和从第二个条柱到 NB2)的其他两个基准点之间的条柱。 将基于已找到的点的反方向上的极值执行测试。 例如,如果我们已确定的点是较高的图表点,则将基于较低图表点测试条柱。 找到第三个基准点后,在同一部分中确定反方向通道线的其他两个参考点。
以下片段都有详细的注释。
// Plot the opposite channel line parallel to the determined line.
// Find the datum point for the opposite channel line:
// Take the minimum price of the 2nd bar as the origin of search.
Tk3=Low[2]-2*RatePr; // projection of the 2nd bar on the "0" bar
for(i=3;i<=NB2;i++) // start searching from the 3rd bar
  {//2(1)Up
   if(Low[i]<Tk3+i*RatePr) // using the minimum value of the price projection on the "0" bar
     {//3(1)Up
      Tk3=Low[i]-i*RatePr; // third reference point (projection on the "0" bar)
      Pr5=Low[i];          // the third datum point for the lower channel line
      NB5=i;               // number of the bar of the third datum point
     }//-3(1)Up
  }//-2(1)Up
找到第三个基准点后,你可在图表中绘制这些点,当然先要删除图表中现有的点。
以下是用于在图表中绘制基准点的程序的片段。
ObjectDelete("Rep1"); ObjectDelete("Rep2"); ObjectDelete("Rep3"); ObjectDelete("Rep5");
   ObjectCreate("Rep1",OBJ_ARROW, 0, TmR1, Pr1+2*space);
      ObjectSet("Rep1", OBJPROP_COLOR, Yellow);
      ObjectSet("Rep1", OBJPROP_ARROWCODE,72);
   ObjectCreate("Rep2",OBJ_ARROW, 0, TmR2, Pr2+2*space);
      ObjectSet("Rep2", OBJPROP_COLOR, Yellow);
      ObjectSet("Rep2", OBJPROP_ARROWCODE,72);
   ObjectCreate("Rep5",OBJ_ARROW, 0, TmR5, Pr5-space);
      ObjectSet("Rep5", OBJPROP_COLOR, Yellow);
      ObjectSet("Rep5", OBJPROP_ARROWCODE,71);
  ObjectDelete("Cross2");
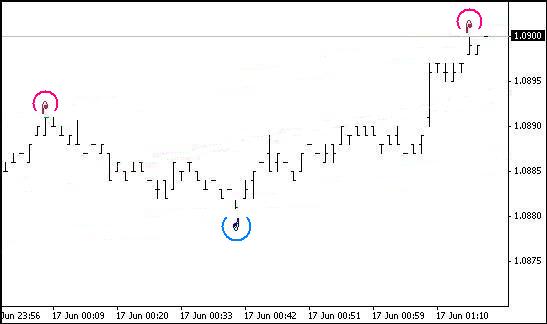
结果,你应该可以看到图表中基准点上方/下方的标记(见下文)。
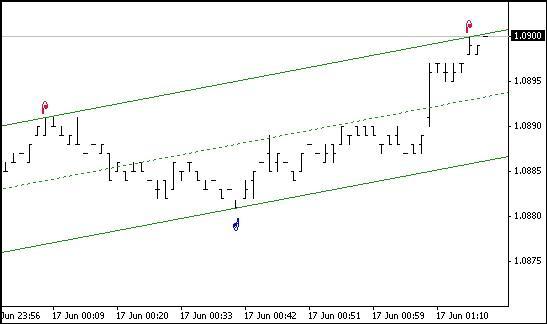
在确定三个基准点和四个参考点后,便可在图表中绘制线条:
DelObj1();
ObjectCreate("Tr1",OBJ_TREND,0,Tm2,Tk2,Tm1,Tk1);
  ObjectSet("Tr1",OBJPROP_COLOR,Lime);
  ObjectSet("Tr1",OBJPROP_WIDTH,1); //2
  ObjectSet("Tr1",OBJPROP_STYLE,STYLE_SOLID);
ObjectCreate("Tr2",OBJ_TREND,0,Tm2,Tk4,Tm1,Tk3);
  ObjectSet("Tr2",OBJPROP_COLOR,Lime);
  ObjectSet("Tr2",OBJPROP_WIDTH,1); //2
  ObjectSet("Tr2",OBJPROP_STYLE,STYLE_SOLID);
ObjectCreate("Med",OBJ_TREND,0,Tm2,(Tk2+Tk4)/2,Tm1,(Tk1+Tk3)/2);
  ObjectSet("Med",OBJPROP_COLOR,Lime);
  ObjectSet("Med",OBJPROP_WIDTH,1);
  ObjectSet("Med",OBJPROP_STYLE,STYLE_DOT);
让我们计算最后 6 个条柱上的通道中值和通道边界中值:
for(int i=0;i<6;i++)
  {
   TLUp_[i]=Tk1+i*RatePr;
   TLDn_[i]=Tk3+i*RatePr;
   Med_[i]=(TLUp_[i]+TLDn_[i])/2;
  }
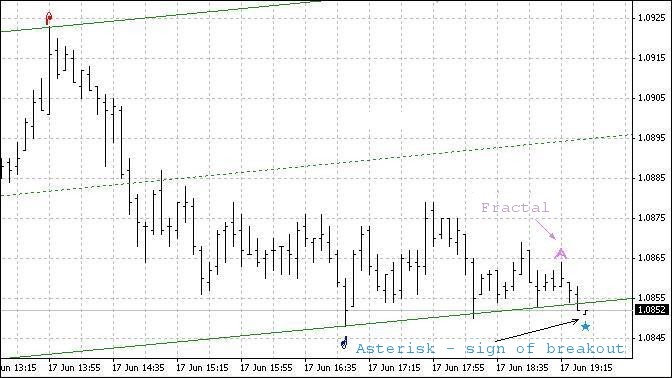
如果价格穿过通道线,用星号进行标记,并添加一个声音通知:
if(Bid>TLUp_[0])
  {
   bool TrUp=true; //bool TrDn=false;
   ObjectDelete("Cross1");  ObjectDelete("Cross2");
   ObjectCreate("Cross1",OBJ_ARROW,0,Tm1,High[1]+2*space);
   ObjectSet("Cross1",OBJPROP_COLOR,DeepPink);
   ObjectSet("Cross1",OBJPROP_ARROWCODE,171);
   PlaySound("alert.wav"); // The file must be located under terminal_directory\sounds
  }
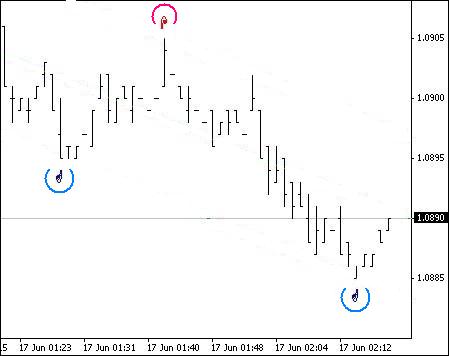
如果最后一个条柱上有完全形成的分形,在图表中标记它:
ObjectDelete("Fraktal"+(q-1));  //ObjectDelete("Frakt"+(w-1));
ObjectCreate("Fraktal"+q,OBJ_ARROW, 0, Time[2], High[2]+2*space+0.0002);
ObjectSet   ("Fraktal"+q, OBJPROP_COLOR, Orchid);
ObjectSet   ("Fraktal"+q, OBJPROP_ARROWCODE,217);
我们刚才讨论了与创建通道本身相关的某些特性和程序片段。
现在让我们谈谈在此通道中进行交易的可能性。
假设此通道方向朝上,而当前蜡烛图向下移动,靠近或穿过通道的下边界。 在这种情况下,可能的价格行为如下:
- 价格在到达下边界之前掉头朝上;
- 价格到达下边界,然后掉头朝上;
- 价格穿过通道线,然后掉头朝上;
- 穿过下边界后,价格将继续向下(向下突破)。
这里要注意,我们说条柱穿过下边界,其实是说最小条柱值。
从表面来看,前三个价格移动模式适用于买入交易。 让我们来看一看它们。 我们应记住,此 Expert Advisor 中的通道是基于完全形成的分形而创建的。 因此,分形固定后,通道可能会改变其方向,即在最后三个条柱上,我们需要考虑到这种情况。
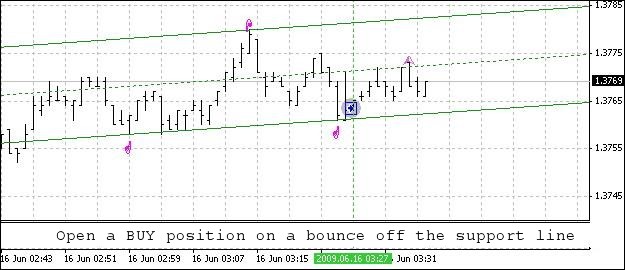
让我们回顾第一个模式。 在这个模式中,具有最小值的条柱之后的条柱的开始价格就高于上一个条柱的最小值。 第三个(从左到右数起的)条柱的最小值也将高于第一个条柱的最小值。 那么,条柱 3(从右到左数起,即从 0 条柱数起)是分形形态的最小值。 如果通道的向上方向未改变,我们可以打开一个买入仓位。
现在我们谈一谈通道方向变更问题。 如果通道是基于较低基准点绘制的,则通道方向将不会更改,因为最小分形点将在较低通道线的上方。
如果通道是基于较高基准点绘制的,则通道方向将保持不变。 第一个模式中出现的问题是,较低通道边界与该边界旁形成的分形的最小值之间的差距要达到多少才能被视为是足够的差距。 这个差额主要取决于通道的大小。
第三个价格变动模式通常会导致通道坡度发生变化,如果分形在较低通道边界下方形成,有时甚至会导致通道方向发生变化。 如果通道是基于前两个基准点的最小值创建的,而形成的分形的值低于第一个参考点且高于第二个参考点,则通道坡度将被调整,而方向保持向上。
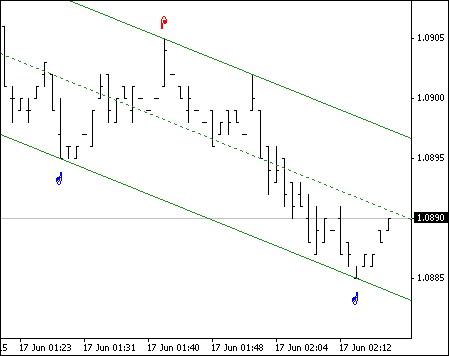
要是已形成的分形的最小条柱值也低于第二个参考点,通道方向将变为向下。 这同样适用于卖出交易,只是方向相反。 以下是使用文中提出的 Expert Advisor 进行交易的示例:
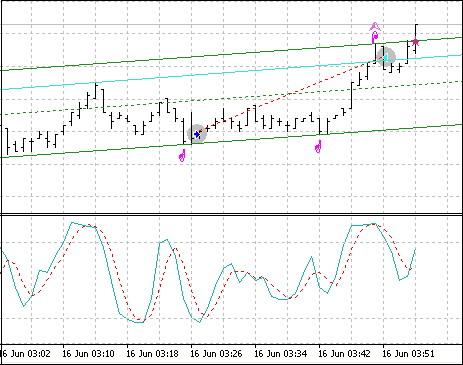
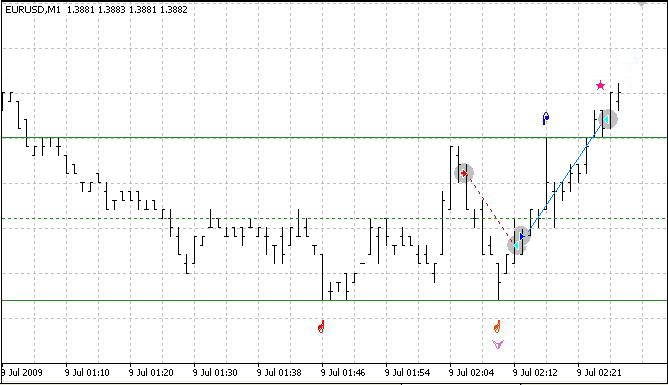
在建仓块和仓位跟踪块中,可以找到演示模式下测试的建仓和平仓条件示例。 测试结果:
以下是完整的程序代码:
//+------------------------------------------------------------------+
//|                                             Expert_Ch_v83_2_.mq4 |
//|                                            2009, author - Genkov |
//|                                                     Genkov@bk.ru |
//+------------------------------------------------------------------+
#property copyright "2009, author - Genkov"
#property link      "Genkov@bk.ru"
//+------------------------------------------------------------------+
extern double SL_B=200;
extern double TP_B=50;
extern double SL_S=200;
extern double TP_S=50;
extern double Lots=1.0;
double TrailingStop=40;
int Magic,i;
extern int AllB=240;        // number of bars for calculations
int TestBar=0;              // index of the bar being tested
double RatePr=0;            // rate of price change - pips/bars
int NB1=-1,NB2=-1,NB3,NB5;  // numbers of bars of datum points
int Extrem=0;               // indices of the points of extremum:
/* Extrem = (0)  - fractal not found,
     Extrem = (1)  - upper fractal found, (any positive number)
     Extrem = (-1) - lower fractal found   (any negative number)
  */
double Pr1=0,Pr2=0,Pr3,Pr5,// prices of datum bars with fractals
Tk1,Tk2,Tk3,Tk4,Tk5; // prices of reference points for plotting the channel lines
double space;               // distance from the price to the "arrow"
double TLUp_[10],TLDn_[10],// values of channel boundaries
Med_[10];
int B_F=0;                  // number of bars for fractals in a period
datetime Tm1,Tm2,Tm3,Tm5;   // time of bars of reference points
string SH;                  // channel slope
bool FraktUp=false;         // flag of the upper fractal mark
bool FraktDn=false;         // flag of the lower fractal mark
int q,w;
//+------------------------------------------------------------------+

//+------------------------------------------------------------------+
void DelObj1()
  {
   ObjectDelete("Tr1");
   ObjectDelete("Tr2");
   ObjectDelete("Med");
  }
//+------------------------------------------------------------------+
void Op_Sell_Ch()
  {
   if(!OrderSend(Symbol(),OP_SELL,Lots,Bid,2,Ask+SL_S*Point,Bid-TP_S*Point," ",Magic,0,Red))
     { Print("  Error when opening a SELL order  # ",GetLastError()); }
   return(0);
  }
//+------------------------------------------------------------------+
void Op_Buy_Ch()
  {
   if(!OrderSend(Symbol(),OP_BUY,Lots,Ask,2,Bid-SL_B*Point,Ask+TP_B*Point," ",Magic,0,Blue))
     { Print("  Error when opening a SELL order  # ",GetLastError()); }
   return(0);
  }
//+------------------------------------------------------------------+
void Close_B_lot()
  {
   if(!OrderClose(OrderTicket(),OrderLots(),Bid,2,HotPink)) // closing 0.1 lot
     {
      Print(" Closed order #= ",OrderTicket(),"Error #= ",GetLastError());
      RefreshRates();
     }
  }
//+------------------------------------------------------------------+
void Close_S_lot()
  {
   if(!OrderClose(OrderTicket(),OrderLots(),Ask,2,Aqua)) // closing 0.1 lot
     {
      Print(" Closed order #= ",OrderTicket(),"Error #= ",GetLastError());
      RefreshRates();
     }
  }
// ===================================================================+
int start()
  {
   int StopLevel=MarketInfo(Symbol(),MODE_STOPLEVEL);
// number of bars for fractal search by periods
   switch(Period())
     {
      case 1:     B_F=12; space=0.0002; break;
      case 5:     B_F=48; space=0.0003; break;
      case 15:    B_F=24; space=0.0004; break;
      case 30:    B_F=24; space=0.0004; break;
      case 60:    B_F=12; space=0.0007; break;
      case 240:   B_F=15; space=0.0012; break;
      case 1440:  B_F=10; space=0.0030; break;
      case 10080: B_F=6;  space=0.0040; break;
     }
// ====================================================================================+
// create a channel:
//start counting from the third bar (counted as "0") to be able to "identify the fractal"
   TestBar=2;  // number of the bar being tested
   NB1=-1; NB2=-1; Extrem=0;   // assume that the numbers of bars and the extremum are not determined
   while(((NB1==-1) || (NB2==-1)) && (TestBar<AllB))
     {//w1
      // -------------------------------------------------------------------------------+
      //  If: - the Extrem value is smaller than (1)(two possible options are: "0" and "-1"),
      //  and the index of the smallest price value coincides with the index of bar under consideration
      // -------------------------------------------------------------------------------+
      if((Extrem<1) && (TestBar==iLowest(Symbol(),Period(),MODE_LOW,B_F*2+1,TestBar-B_F)))
        {//w2
         // if "0" when there was no extremum at that moment,
         if(Extrem==0)
           {//w3
            // assign: the value of (-1) to the identified point of extremum, thus indicating
            // that this is the lower extremum; the number to the determined bar (NB1) and the price value (Pr1).
            Extrem=-1; NB1=TestBar; Pr1=Low[NB1];
           }//-w3
         else  if(Extrem!=0) // the first point was found earlier
                             // otherwise the number and the price value will be assigned to point 2
           {//w4
            NB2=TestBar; Pr2=Low[NB2];
           }//-w4
         // for control purposes, the values can be printed - Print("   bar #= ",NB2," price value= ",Pr2);
        }//-w2
      // -------------------------------------------------------------------------------+
      //  If: - the Extrem value is greater than (-1)(possible options are: 0 and 1), and the index of the highest price
      //  value coincides with the number of the bar under consideration - (similar to the above)
      // -------------------------------------------------------------------------------+
      if((Extrem>-1) && (TestBar==iHighest(Symbol(),Period(),MODE_HIGH,B_F*2+1,TestBar-B_F)))
        {//w5
         // if Extrem==0
         if(Extrem==0)
           {//w6
            // store the bar number (NB1) and the price value (Pr1).
            Extrem=1; NB1=TestBar; Pr1=High[NB1];
           }//-w6
         else // otherwise the number and the price value will be assigned to point 2
           {//w7
            NB2=TestBar; Pr2=High[NB2];
           }//-w7
        }//-w5
      TestBar++;
     }//-w1
// -----------------------------------------------------------------------------------+
   if((NB1==-1) || (NB2==-1)) // no datum points found on the last AllB bars
     {
      DelObj1(); ObjectDelete("Cross1"); ObjectDelete("Cross2");  ObjectDelete("Rep1");
      ObjectDelete("Rep2"); ObjectDelete("Rep3"); ObjectDelete("Rep5");
      // Print(" === > no bars for the channel "); // for control purposes only (can be deleted)
      return(-1);
     }
// ---------------------------------
// Calculate the rate of price change.
   RatePr=(Pr2-Pr1)/(NB2-NB1);
// if the value is positive, we are dealing with a downward channel, otherwise - upward.
   if(RatePr>0) SH="downward"; else  SH="upward";
// determine the time of datum points for the channel lines
   Tm1=Time[0];    Tm2=Time[NB2+50];
// **************************************************************************************
   if(Extrem==1) // if a higher extremum has been found first
     {//1(Extrem=1)
      // with two datum points and the rate of price change available,
      // determine reference points of this line:
      // the first reference point is the projection of the datum point on the "0" bar
      double Tk1=Pr1-NB1*RatePr;
      // the second reference point is the projection on the left-hand side of the chart
      double Tk2=Tk1+(NB2+50)*RatePr;
      // Plot the opposite channel line parallel to the determined line.
      // Find the datum point for the opposite channel line:
      // Take the minimum price of the 2nd bar as the origin of search.
      Tk3=Low[2]-2*RatePr; // projection of the 2nd bar on the "0" bar
      for(i=3;i<=NB2;i++) // start searching from the 3rd bar
        {//2(1)Up
         if(Low[i]<Tk3+i*RatePr) // using the minimum value of the price projection on the "0" bar
           {//3(1)Up
            Tk3=Low[i]-i*RatePr; // third reference point (projection on the "0" bar)
            Pr5=Low[i];          // the third datum point for the lower channel line
            NB5=i;               // number of the bar of the third datum point
           }//-3(1)Up
        }//-2(1)Up
      // now take a look at the first two bars: "0" and "1"; their Min values may turn out to be lower than the 2nd bar
      // if we consider adjustment of the channel using these two bars, the channel will be
      // becoming wider following the downward price movement; if this is ignored, the downward price movement
      // can be considered as the channel line breakout (possible beginning of the trend!)
      // if(Low[0]<Tk3) {Tk3=Low[0]; Pr5=Low[0]; NB5=0;}
      // if(Low[1]<Tk3+RatePr) {Tk3=Tk3+RatePr; Pr5=Low[1]; NB5=1;}
      datetime TmR1=Time[NB1];    datetime TmR2=Time[NB2];   datetime TmR5=Time[NB5];
      // -------------------------------------------------------------------------------------
      // the following operators are intended for visual control of the program performance only (they can be deleted)
      // and display the channel slope value, speed rate, numbers and time of the datum points at Extrem=1
      string TNB1=TimeToStr(TmR1,TIME_DATE|TIME_MINUTES);
      string TNB2=TimeToStr(TmR2,TIME_DATE|TIME_MINUTES);
      string TNB5=TimeToStr(TmR5,TIME_DATE|TIME_MINUTES);
      //   Print(" channel- ",SH," ; speed = ",DoubleToStr(NormalizeDouble(RatePr,8),8),
      //         " pip / bar"," ; Extrem= ",Extrem);
      //   Print(" NB2= ",NB2," ; time= ",TNB2," ; NB5= ",NB5,
      //         " ; time= ",TNB5," ; NB1= ",NB1," ; time= ",TNB1);
      // --------------------------------------------------------------------------------------
      // for clarity of the program performance, mark the datum points on the channel lines in the chart
      ObjectDelete("Rep1"); ObjectDelete("Rep2"); ObjectDelete("Rep3"); ObjectDelete("Rep5");
      ObjectCreate("Rep1",OBJ_ARROW,0,TmR1,Pr1+2*space);
      ObjectSet("Rep1",OBJPROP_COLOR,Yellow);
      ObjectSet("Rep1",OBJPROP_ARROWCODE,72);
      ObjectCreate("Rep2",OBJ_ARROW,0,TmR2,Pr2+2*space);
      ObjectSet("Rep2",OBJPROP_COLOR,Yellow);
      ObjectSet("Rep2",OBJPROP_ARROWCODE,72);
      ObjectCreate("Rep5",OBJ_ARROW,0,TmR5,Pr5-space);
      ObjectSet("Rep5",OBJPROP_COLOR,Yellow);
      ObjectSet("Rep5",OBJPROP_ARROWCODE,71);
      ObjectDelete("Cross2");
      // -------------------------------------------------------------------------------------
      // calculate prices for coordinates of reference points on the lower channel boundary:
      double Tk3=Pr5-RatePr*NB5; // price of the lower channel boundary in the "0" point
      double Tk4=Tk3+RatePr*(NB2+50);// price of the lower channel boundary in the left-hand side of the chart
     }//- 1(Extrem=1)
// ******************************************************************************************
   else  if(Extrem==-1)// if a lower extremum has been found first
     {//1(Extrem= -1)
                                     // prices of reference points on the lower channel boundary:
      Tk3=Pr1-NB1*RatePr;      // in the "0" point
      Tk4=Tk3+(NB2+50)*RatePr; // in the left-hand side point
                               // Plot the opposite channel line parallel to the determined line.
      // Find the datum point for the opposite channel line.
      // Take the price of the 2nd bar as the origin of search.
      Tk1=High[2]-2*RatePr; // projection of the 2nd bar on the "0" bar
      for(i=3;i<=NB2;i++) // start searching from the 3rd bar
        {//2(-1)
         if(High[i]>Tk1+i*RatePr)
           {//3(-1)
            Tk1=High[i]-i*RatePr; // the third reference point (projection on the "0" bar)
            Pr3=High[i];          // the third datum point for the upper channel line
            NB3=i;                // number of the bar of the third datum point
           }//-3(-1)
         // now take a look at the first two bars: "0" and "1"
         // if(High[0]>Tk1) {Tk1=High[0]; Pr3=High[0]; NB3=0;}
         // if(High[1]>Tk1+RatePr) {Tk1=Tk1+RatePr; Pr3=High[1]; NB3=1;}
         TmR1=Time[NB1];    TmR2=Time[NB2];   datetime TmR3=Time[NB3];
        }//- 2(-1)
      // ---------------------------------------------------------------------------------
      // add the following operators to monitor the performance results
      //(they do not affect the program performance and can be deleted),
      // they display the channel (speed) slope value, speed rate, as well as numbers
      // and time of the datum points at Extrem = -1
      // TNB1=TimeToStr(TmR1,TIME_DATE|TIME_MINUTES);
      // TNB2=TimeToStr(TmR2,TIME_DATE|TIME_MINUTES);
      // string TNB3=TimeToStr(TmR3,TIME_DATE|TIME_MINUTES);
      // Print(" channel- ",SH," ; price speed rate= ",DoubleToStr(NormalizeDouble(RatePr,8),8),
      //       " pip / bar"," ; Extrem= ",Extrem);
      // Print(" ; NB2= ",NB2," ; time= ",TNB2," ; NB3= ",NB3,
      //       " ; time= ",TNB3," ; NB1= ",NB1," ; time= ",TNB1);
      // ----------------------------------------------------------------------------------
      // for clarity, mark the datum points on the channel lines in the chart
      ObjectDelete("Rep1"); ObjectDelete("Rep2");
      ObjectDelete("Rep3"); ObjectDelete("Rep5");
      ObjectCreate("Rep1",OBJ_ARROW,0,TmR1,Pr1-space);
      ObjectSet("Rep1",OBJPROP_COLOR,Yellow);
      ObjectSet("Rep1",OBJPROP_ARROWCODE,71);
      ObjectCreate("Rep2",OBJ_ARROW,0,TmR2,Pr2-space);
      ObjectSet("Rep2",OBJPROP_COLOR,Yellow);
      ObjectSet("Rep2",OBJPROP_ARROWCODE,71);
      ObjectCreate("Rep3",OBJ_ARROW,0,TmR3,Pr3+2*space);
      ObjectSet("Rep3",OBJPROP_COLOR,Yellow);
      ObjectSet("Rep3",OBJPROP_ARROWCODE,72);
      ObjectDelete("Cross1");
      // ---------------------------------------------------------------------------------
      // calculate prices of the reference points on the upper channel boundary:
      Tk1=Pr3-RatePr*NB3; // price of the upper channel boundary in the "0" point
      Tk2=Tk1+RatePr*(NB2+50);// price of the upper channel boundary in the left-hand side point
     }//-1(Extrem= -1)
// ---------------------------------======================================================
// calculate the median values of the channel and channel boundaries on the last 6 bars
   for(int i=0;i<6;i++)
     {
      TLUp_[i]=Tk1+i*RatePr;
      TLDn_[i]=Tk3+i*RatePr;
      Med_[i]=(TLUp_[i]+TLDn_[i])/2;
     }
// --------------------------------------------------------------------
//If the price has crossed the upper channel line, mark it with an asterisk and add a sound notification
   if(Bid>TLUp_[0])
     {
      bool TrUp=true; //bool TrDn=false;
      ObjectDelete("Cross1");  ObjectDelete("Cross2");
      ObjectCreate("Cross1",OBJ_ARROW,0,Tm1,High[1]+2*space);
      ObjectSet("Cross1",OBJPROP_COLOR,DeepPink);
      ObjectSet("Cross1",OBJPROP_ARROWCODE,171);
      PlaySound("alert.wav"); // The file must be located under terminal_directory\sounds
     }
//If the price has crossed the lower channel line, mark it with an asterisk and add a sound notification
   if(Bid<TLDn_[0])
     {
      ObjectDelete("Cross2");  ObjectDelete("Cross1");
      /// Print(" there was a crossover of the lower channel line ");
      ObjectCreate("Cross2",OBJ_ARROW,0,Tm1,Low[1]-space);
      ObjectSet("Cross2",OBJPROP_COLOR,DodgerBlue);
      ObjectSet("Cross2",OBJPROP_ARROWCODE,171);
      PlaySound("alert.wav"); // The file must be located under terminal_directory\sounds
     }
// -------------------------------------------------------------------------------------
// plot the channel boundaries in the chart, having deleted the existing ones beforehand
   DelObj1();
   ObjectCreate("Tr1",OBJ_TREND,0,Tm2,Tk2,Tm1,Tk1);
   ObjectSet("Tr1",OBJPROP_COLOR,Lime);
   ObjectSet("Tr1",OBJPROP_WIDTH,1); //2
   ObjectSet("Tr1",OBJPROP_STYLE,STYLE_SOLID);
   ObjectCreate("Tr2",OBJ_TREND,0,Tm2,Tk4,Tm1,Tk3);
   ObjectSet("Tr2",OBJPROP_COLOR,Lime);
   ObjectSet("Tr2",OBJPROP_WIDTH,1); //2
   ObjectSet("Tr2",OBJPROP_STYLE,STYLE_SOLID);
   ObjectCreate("Med",OBJ_TREND,0,Tm2,(Tk2+Tk4)/2,Tm1,(Tk1+Tk3)/2);
   ObjectSet("Med",OBJPROP_COLOR,Lime);
   ObjectSet("Med",OBJPROP_WIDTH,1);
   ObjectSet("Med",OBJPROP_STYLE,STYLE_DOT);
// ---- Block of marking fractals in the chart ---------------------------------
   if((High[2]>High[1] && Bid<High[2] && High[2]>High[3] && High[2]>High[4]) ||
      (High[2]==High[1] && Bid<High[1] && High[2]>High[3] && High[2]>High[4]))
     {
      double FraktalUp=High[2]; // upper fractal
      double FraktalDn=0;
      // if the fractal has formed, put a mark, and if this fractal caused
      // a new datum point - delete the mark for the crossover of the upper channel line by the price.
      if(High[2]>=TLUp_[i]) ObjectDelete("Cross1");
      ObjectDelete("Fraktal"+(q-1));  //ObjectDelete("Frakt"+(w-1));
      ObjectCreate("Fraktal"+q,OBJ_ARROW,0,Time[2],High[2]+2*space+0.0002);
      ObjectSet("Fraktal"+q,OBJPROP_COLOR,Orchid);
      ObjectSet("Fraktal"+q,OBJPROP_ARROWCODE,217);
      bool FraktUp=true; //bool FraktDn=false;// it will be useful when trading
      q++;
     }
   if((Low[2]<Low[1] && Bid>Low[2] && Low[2]<Low[3] && Low[2]<Low[4]) ||
      (Low[2]==Low[1] && Bid>Low[1] && Low[2]<Low[3] && Low[2]<Low[4]))
     {
      FraktalDn=Low[2]; // lower fractal
      FraktalUp=0;
      if(Low[2]>=TLUp_[i]) ObjectDelete("Cross2");
      ObjectDelete("Frakt"+(w-1)); //ObjectDelete("Fraktal"+(q-1));
      ObjectCreate("Frakt"+w,OBJ_ARROW,0,Time[2],Low[2]-2*space);
      ObjectSet("Frakt"+w,OBJPROP_COLOR,Orchid);
      ObjectSet("Frakt"+w,OBJPROP_ARROWCODE,218);
      FraktDn=true; FraktUp=false;
      w++;
     }
// ---------------------------------------------------------------+
// Block of position opening conditions.   This is just an example  +
// and it should not be deemed a recommendation for use!+
// ---------------------------------------------------------------+
   if(OrdersTotal()<1) // trade one position
     {
      // - 16- SELL ---
      if(Extrem==1 && // two upper datum points
         RatePr>0 && // channel directed downwards
         (Tk1-Tk3)>20*Point && // channel size > 20pip
         Bid<High[1] && // the price is lower than the previous bar
         (TLUp_[1]-High[1])<3*Point) // the first bar is within 3pip from the upper channel line
        {
         Print(" Open - 16-SELL === ");
         //   SL_S=50;
         //   if(SL_S<StopLevel) SL_S=StopLevel;
         //   TP_S=80;
         Op_Sell_Ch();
         return(0);
        }
      // - 18- BUY ---
      if(Extrem==-1 && // two lower datum points
         RatePr<0 && // channel directed upwards
         (Tk1-Tk3)>20*Point && // channel size > 20pip
         Bid>Low[1] && // the price is higher than the previous bar
         (Low[1]-TLDn_[1])<3*Point) // the 1st bar is within 3pip from the lower channel line
        {
         Print(" Open - 18-BUY === ");
         //    SL_B=50;
         //    if(SL_B<StopLevel) SL_B=StopLevel;
         //    TP_B=80;
         Op_Buy_Ch();
         return(0);
        }
     }
//------------------------------------------------------------------------+
// Tracking open SELL positions                                    |
//+=======================================================================+
   for(i=OrdersTotal()-1;i>=0;i--) // SELL order selection loop
     {//1-position selection loop
      if(!OrderSelect(i,SELECT_BY_POS,MODE_TRADES))
        {Print("Order selection error = ",GetLastError()); }
      if(OrderType()==OP_SELL) // if there is an open Sell order
        { //2-type_Sell
         if((FraktalDn<=TLDn_[2] ||
            Low[2]<=TLDn_[2]) &&
            (Bid>Low[1] && Low[1]<=TLDn_[1]) &&
            (OrderOpenPrice()-Bid)*Point>0) // not at a loss!
           {//5
            Print(" close by the lower channel line ");
            Close_S_lot();
            // and if the channel is directed upwards
            if(RatePr<0)
              {
               Print(" Open a Buy position ");
               Op_Buy_Ch();
              }
           }//-5
        }//-2 type_Sell
      //------------------------------------------------------------------------+
      // Tracking open BUY positions                   |
      //+=======================================================================+
      else
      if(OrderType()==OP_BUY) // if there is an open Buy order
        { //4-type_Buy
         if((FraktalUp>=TLUp_[2] ||
            High[2]>=TLUp_[2]) &&
            // If the channel is created based on the lower datum points and is directed upwards,
            // while the price has crossed the upper boundary,  and is about to move down,
            //bar "1" was higher than bar "0" and higher than bar "2" which was situated on the upper channel line,
            // this looks like the upper fractal formation and channel size increase.
            // At the same time, Stochastic is above 80.0
            // and it starts going down to cross the signal line.
            // So we should not expect bar "0" to get fully formed as it is highly likely
            // that the price will go down. Therefore close the BUY position.
            (Bid<High[1] && High[1]>=TLUp_[1]) &&
            (Ask-OrderOpenPrice())*Point>0) // not at a loss!
           {//5
            Print(" close by the upper channel line ");
            Close_B_lot();
            // and if the channel is directed downwards
            if(RatePr>0)
              {
               Print(" Open a Sell position ");
               Op_Sell_Ch();
              }
           }//-5
        }//-4-type_Buy
     }//-1 position selection loop
//----------------
   return(0);
  }
//+------------------------------------------------------------------+
总结
我相信,有关能否在通道中进行交易的问题应该已经有了明确的答案。 我期待大家的批评和指正,以便能够进一步改进 Expert Advisor。 我也衷心希望能够从我的经验中受惠的不仅仅是新手交易者。
本文由MetaQuotes Ltd译自俄文
原文地址: https://www.mql5.com/ru/articles/1375
注意: MetaQuotes Ltd.将保留所有关于这些材料的权利。全部或部分复制或者转载这些材料将被禁止。
本文由网站的一位用户撰写,反映了他们的个人观点。MetaQuotes Ltd 不对所提供信息的准确性负责,也不对因使用所述解决方案、策略或建议而产生的任何后果负责。


 Lite_EXPERT2.mqh: Expert Advisor 开发人员的功能套件
 夜间交易的可靠度如何?