SQ Tactic Tracker
- 实用工具
- 版本: 3.26
- 更新: 29 八月 2026
- 激活: 5

SQ TACTIC TRACKER — Multi-Bot Performance & Risk Dashboard for MT5
KNOW YOUR EDGE. DON'T GUESS IT.
Every bot, every symbol, every session, every open position — decoded on one chart.
Your equity curve tells you IF you're making money. It never tells you WHERE it comes
from, WHEN you actually win, WHICH bot is quietly bleeding the account, or WHAT you're
exposed to right now.
SQ Tactic Tracker puts your entire trading account on a single chart and answers those
questions at a glance — live. It reads every position on the account, groups it by magic
number, and turns it into a full analytics command center. One manual trade, one EA, or
fifty bots running at once — it all lands in one panel.
SIX TABS, ONE CHART
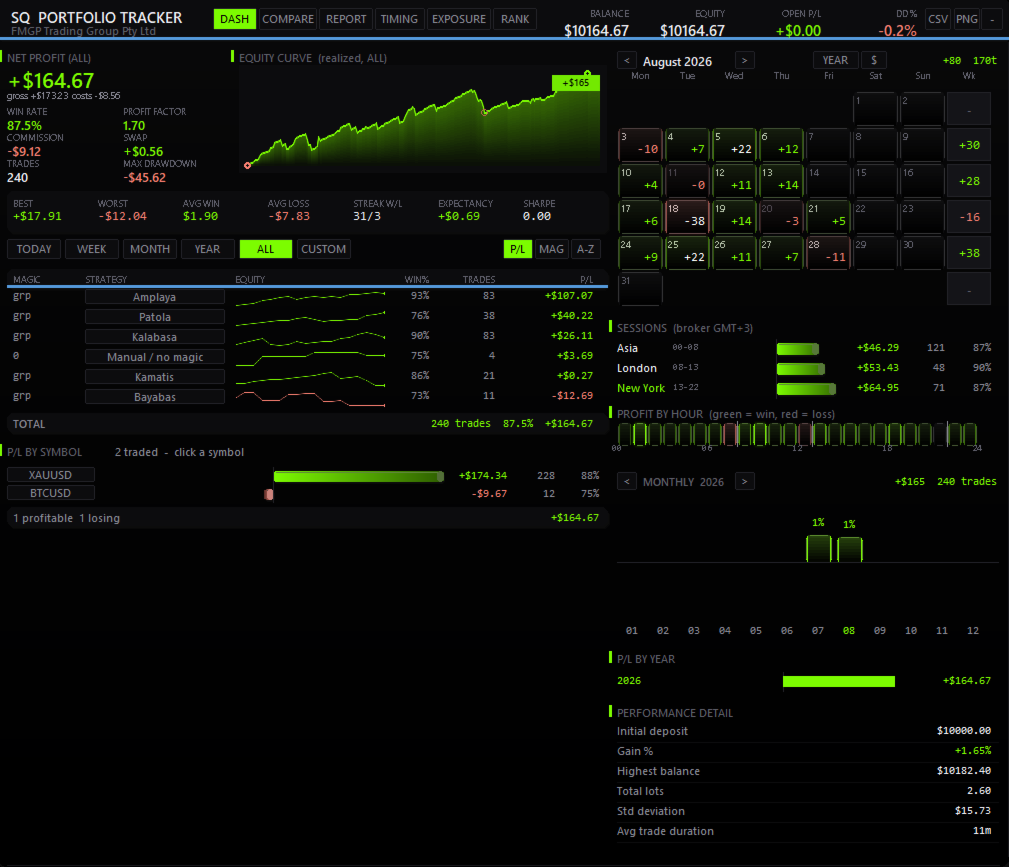
▪ DASHBOARD — THE FULL SCORECARD
Balance, equity, open P/L and drawdown up top. A realized equity curve with maximum
drawdown marked and a crosshair that names the trade under your cursor. Net profit, win
rate, profit factor, expectancy, recovery factor, Sharpe, Sortino, best and worst trade,
win/loss streaks — always in view. Each strategy row carries its own equity sparkline.
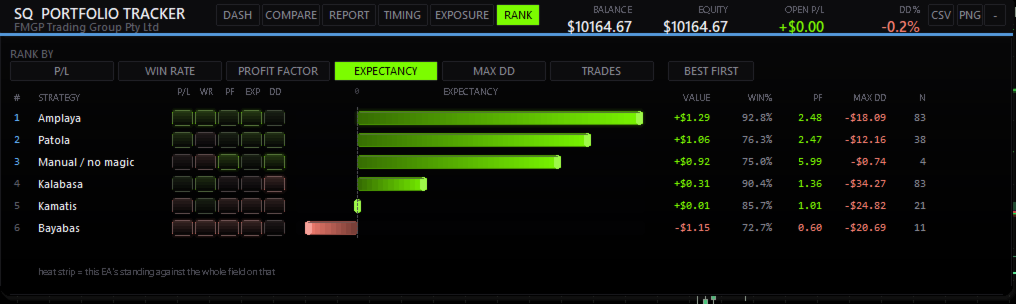
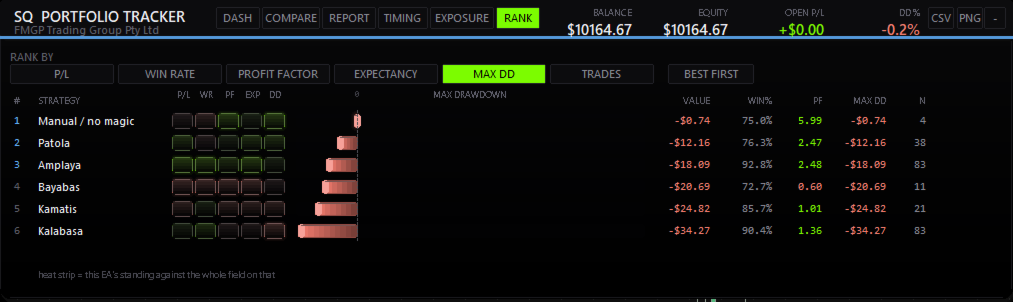
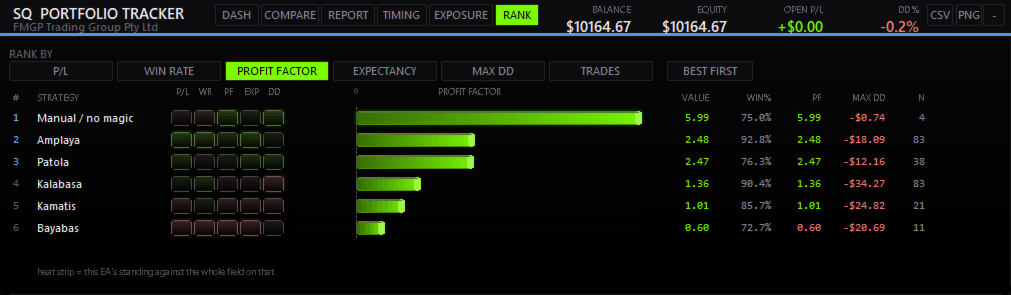
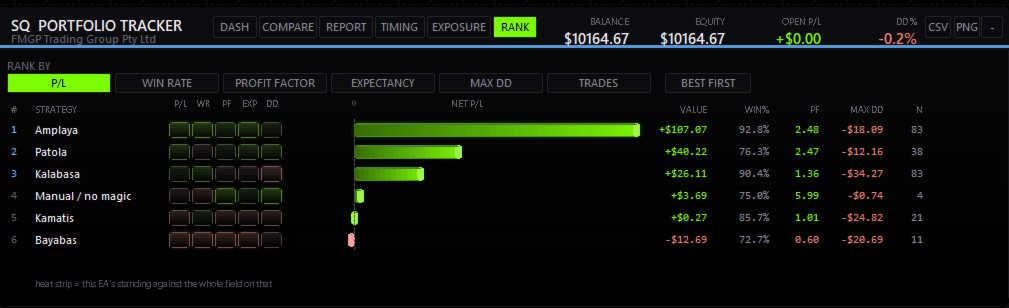
▪ RANK — EVERY EA, HEAD TO HEAD
The league table. Sort by net P/L, win rate, profit factor, expectancy, drawdown or trade
count with one click. A horizontal bar chart ranks them visually, and a five-cell heat
strip shows where each EA stands against the entire field on every metric at once — so a
bot that earns well but risks badly is obvious instantly.
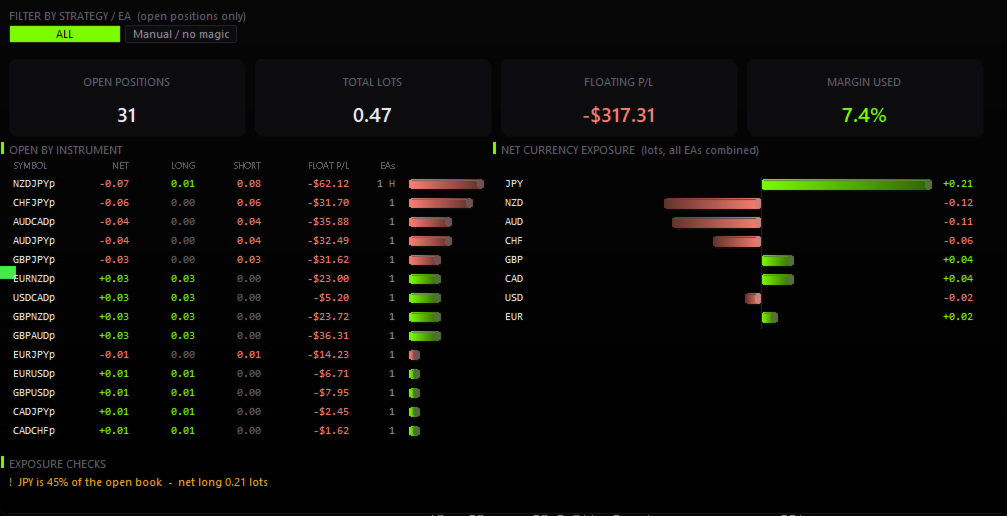
▪ EXPOSURE — LIVE RISK, RIGHT NOW
The tab most dashboards don't have. Open lots per instrument, floating P/L, margin used —
and net currency exposure aggregated across ALL your EAs. Five JPY crosses from four
different bots is one yen bet, and this shows you that number. Automatic warnings when two
EAs stack the same direction on one symbol, or when a single currency dominates your book.
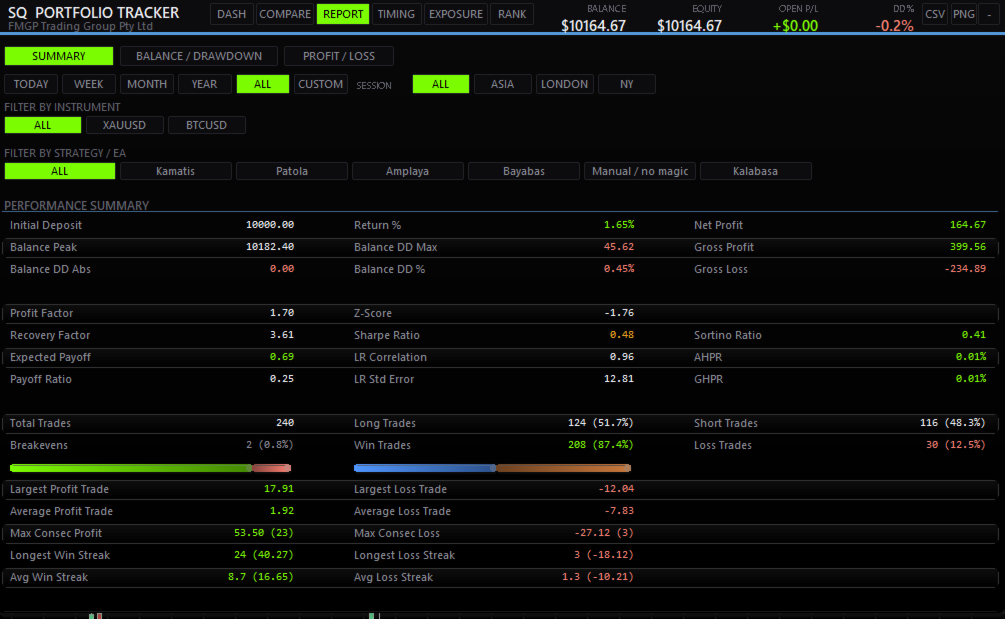
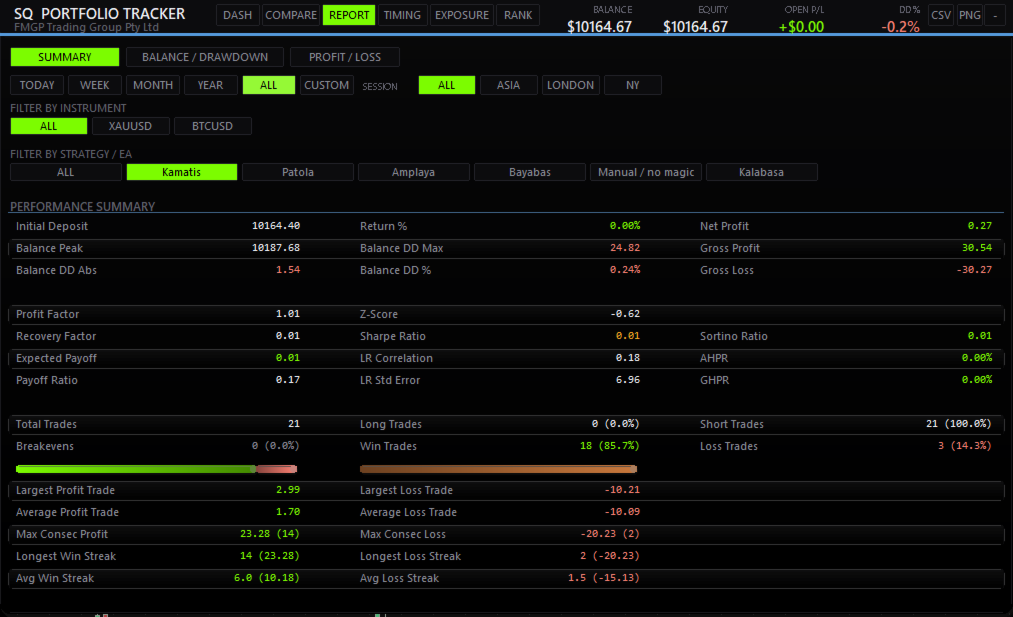
▪ REPORT — THE FULL STATEMENT
Performance summary, balance and drawdown curves with underwater shading, and a per-trade
P/L chart with MFE/MAE on hover. Every stat a prop firm would ask for, in one place.
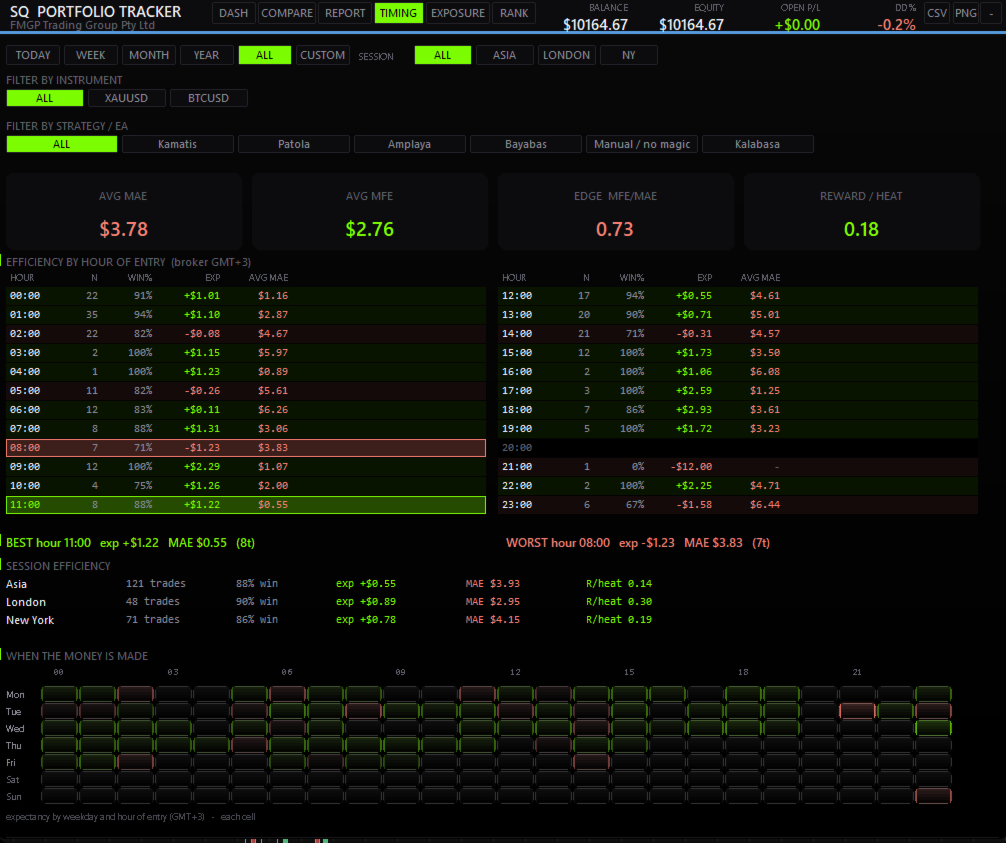
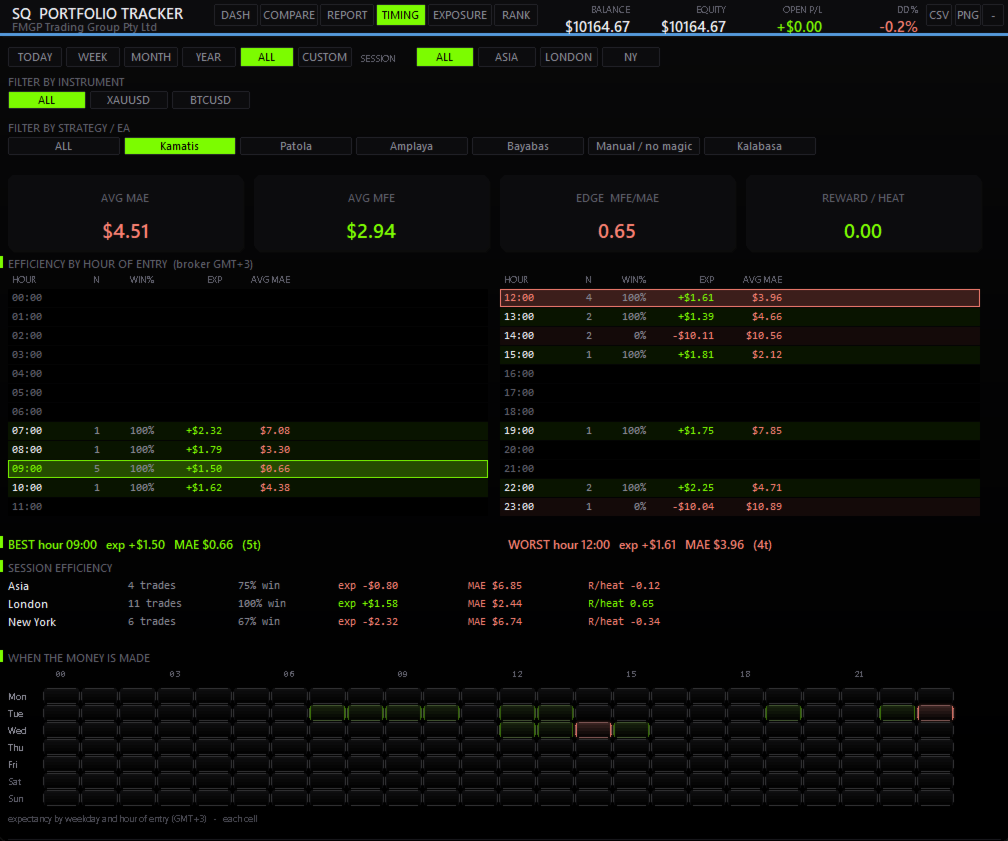
▪ TIMING — WHEN YOU ACTUALLY WIN
Efficiency by hour of entry with average MAE, session breakdown for Asia, London and New
York, best and worst hour called out, and a weekday × hour expectancy heatmap. See which
sessions pay you and which hours quietly cost you.
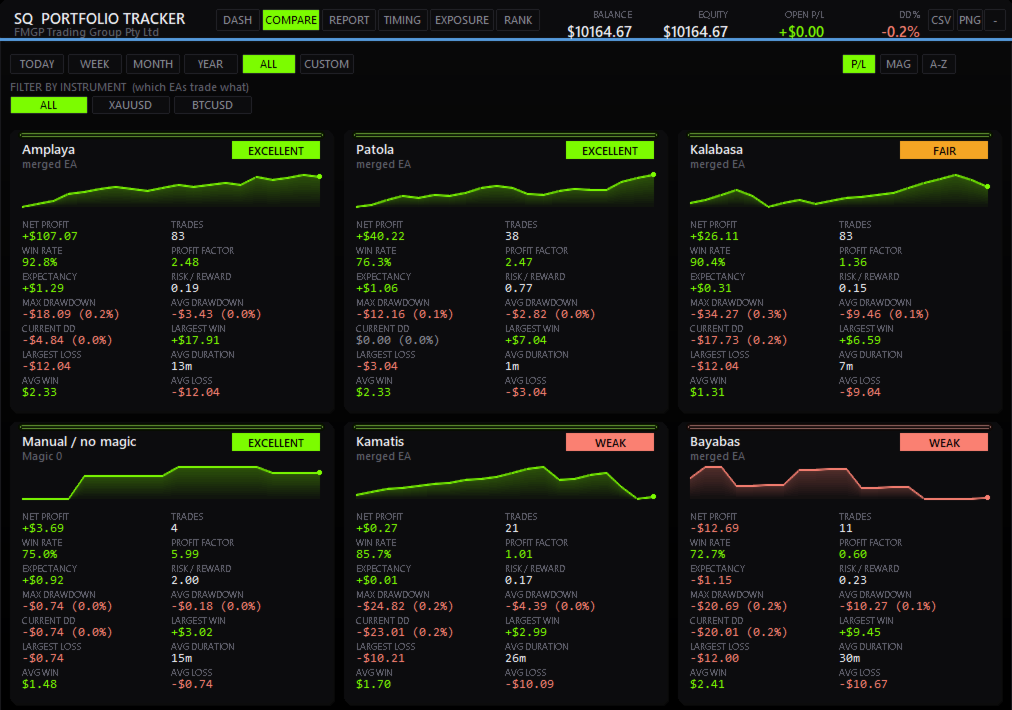
▪ COMPARE — SIDE BY SIDE
Every EA as its own card with an equity sparkline and a rating badge — net profit, win
rate, profit factor, risk/reward, drawdown, largest win and loss, average duration.
CLICK TO FOCUS — FULLY INTERACTIVE
Click any symbol or any EA and the ENTIRE dashboard re-scopes to it — equity curve,
calendar, sessions, monthly and yearly breakdowns, every metric. Want to know how XAUUSD
really behaves, or exactly when EA #3 makes its money? One click. Clear it and you're back
to the full account.
BUILT FOR REAL PORTFOLIOS
▪ Runs 50+ EAs comfortably. Every long list scrolls or pages — nothing is ever hidden
from you silently.
▪ Group several magic numbers into one named EA. Bots that run multiple strategies on one
chart show up as a single line, not scattered numbers.
▪ Name your EAs in the Settings, or in a simple text file with no length limit for
accounts running dozens of them.
▪ Every list size is configurable, or set to show every magic found in your history.
CALENDAR, MONTH & YEAR
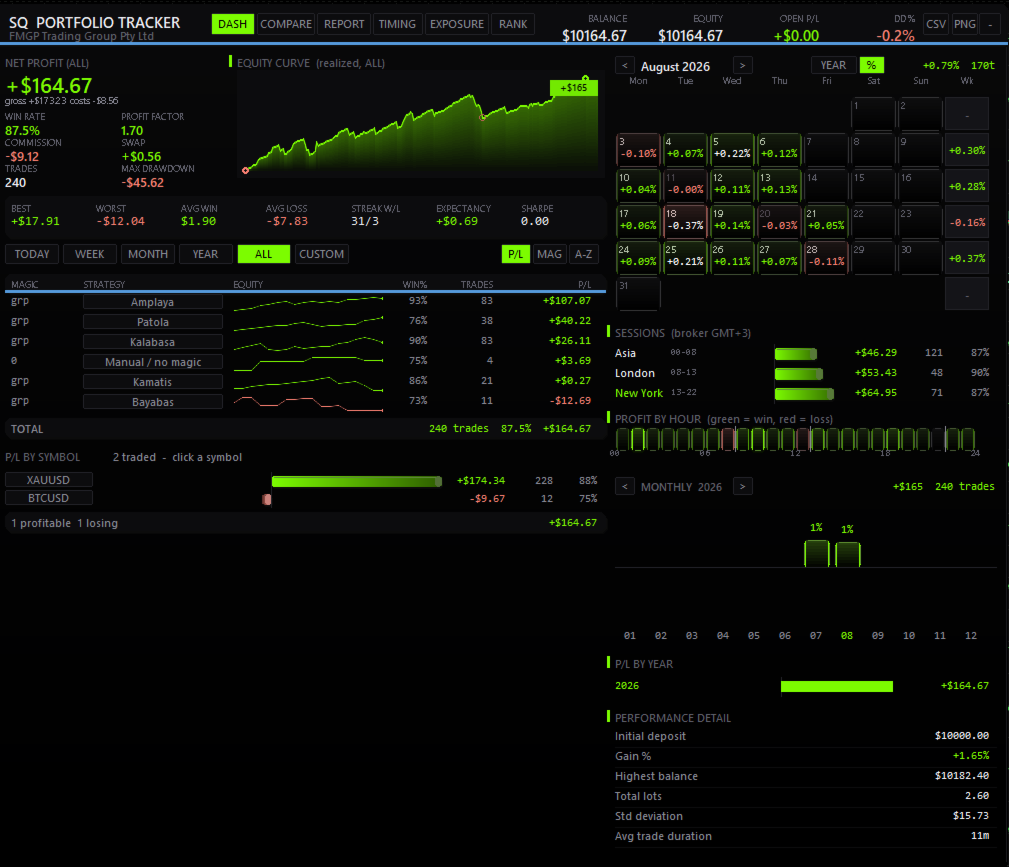
Day-by-day P/L calendar with weekly totals, switchable between money and % of balance with
one button. Monthly gain bars, P/L by year, total lots, highest balance, average trade
duration — your whole history, organized and readable.
P/L BY SYMBOL
Every instrument you trade, ranked winners-to-losers as clean diverging bars, each with its
own win rate and trade count.
ALERTS & EXPORT
Optional alerts for drawdown limits, daily loss limits, and EAs that have gone quiet — push
notifications supported. One-click CSV export of your filtered trades, and a PNG snapshot
of the panel for your records or your Discord.
BUILT FOR ANY ACCOUNT
Any broker. Any base currency, detected automatically. Broker symbol suffixes handled
correctly. Broker credit and bonus excluded from open P/L, so your floating number is
honest. Five themes including OLED black, a custom accent colour, adjustable UI scale and
automatic DPI scaling for 4K screens. Drag the panel anywhere — it remembers where you
put it. Collapse it to a single strip when you want the chart back.
WHO IT'S FOR
▪ Portfolio traders running multiple EAs who need one honest view.
▪ Prop-firm and funded traders who live and die by clean numbers.
▪ Manual traders who want to know their real session and symbol edge.
▪ Anyone tired of exporting to spreadsheets to understand their own trading.
HOW IT WORKS
SQ Tactic Tracker is an indicator — not an EA. It is display-only: it reads your account
history and shows it. It never opens, closes or modifies a single trade, and it needs no
AutoTrading. Drop it on one dedicated chart (any symbol, any timeframe — it reads the whole
account) and leave it running alongside your bots.
PERFORMANCE, NOT PROMISES.
This tool does not predict the market and it does not place trades. It gives you something
more useful: a clear, honest, live picture of how you and your bots are actually
performing — so every decision you make is backed by your own numbers.
See your whole account. Understand your real risk. Trade what works.






































This is a definitely the best analytics tool for your EAs portfolio and the UX/UI is excellent. Developer is very responsive and open to suggestions. Great communication and continuously adding useful features. So far, very happy with the EA.