Rare Spear
- 指标
-
Hasanboy Beknazarov
 I’m an MT4/MT5 EA & Indicator Developer with over 10 years of experience (since 2014).
 - 版本: 2.30
- 更新: 22 二月 2026
- 激活: 10
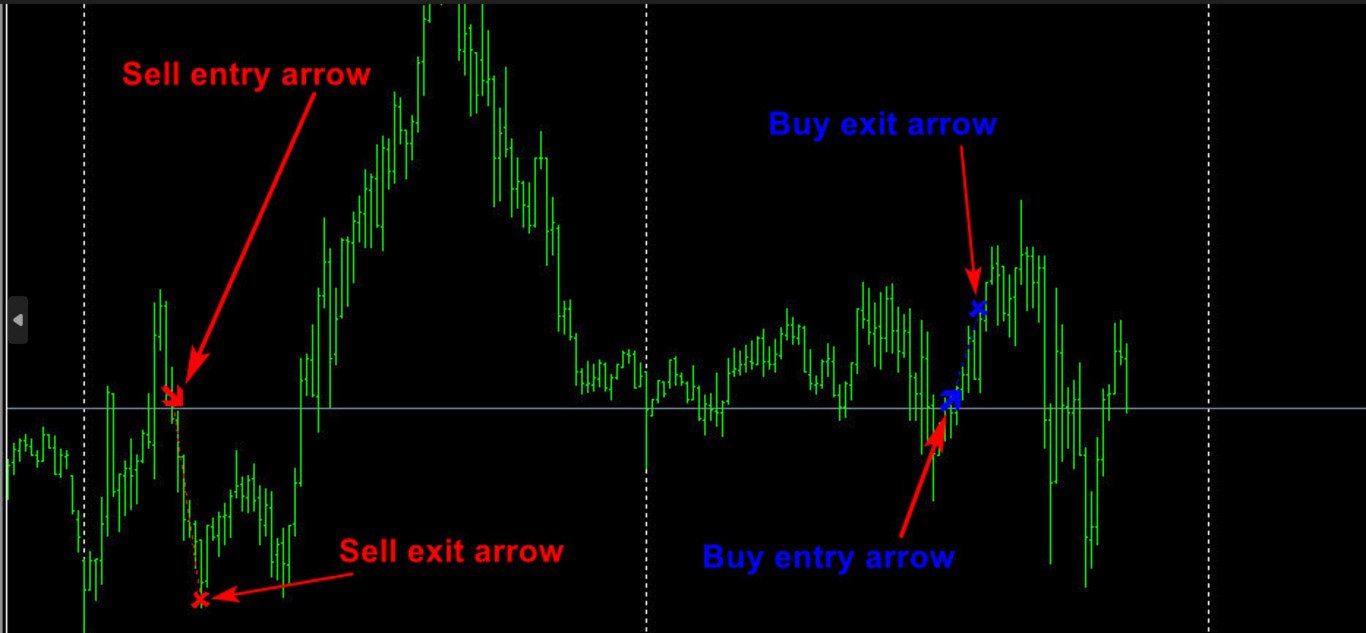
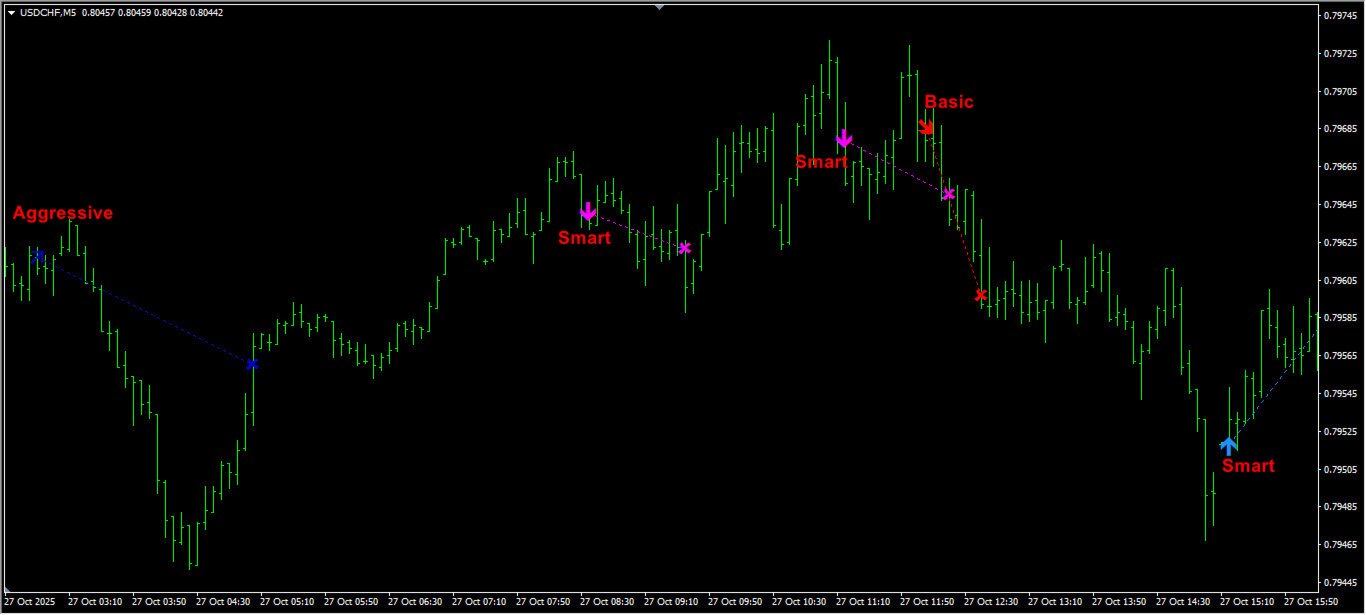
此指标是为喜欢清晰、精准信号的交易者设计的一个简单但高度可靠的趋势方向预测工具。
主要特点
-
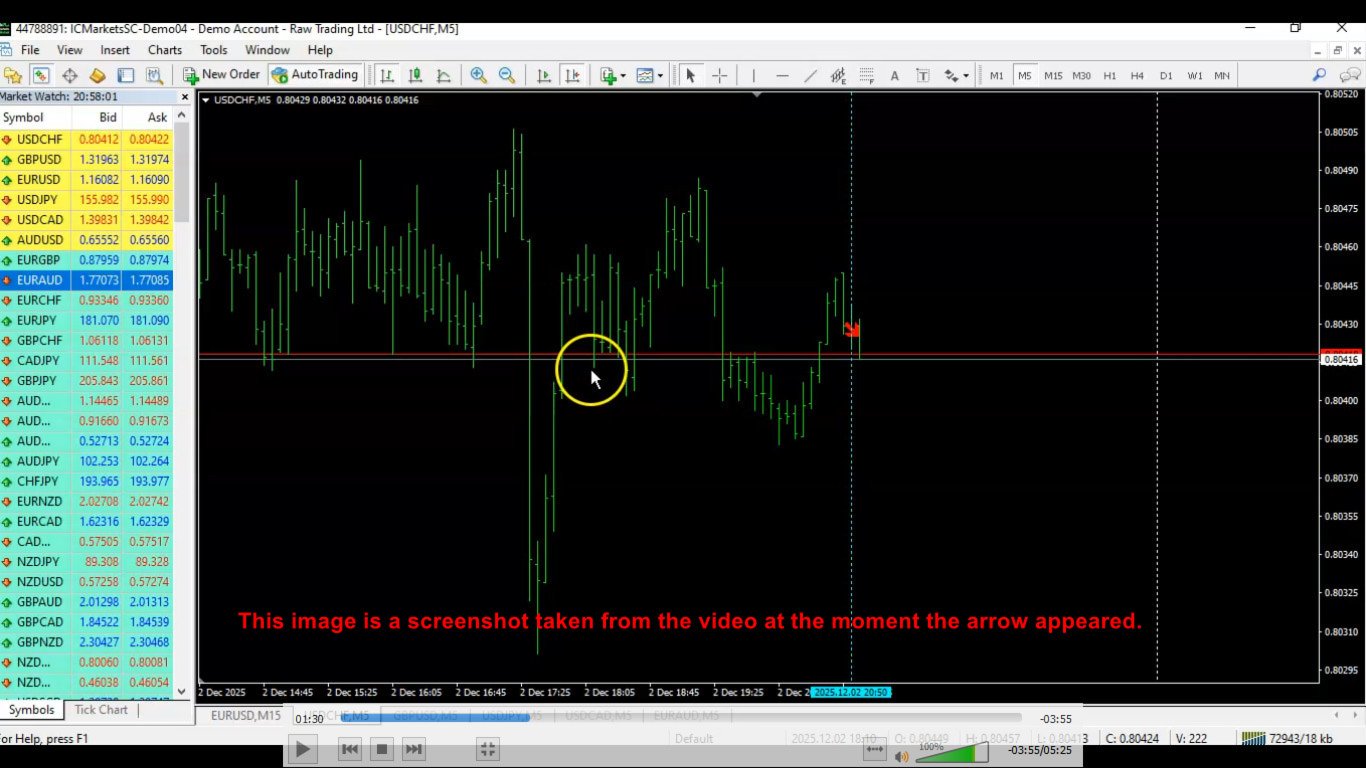
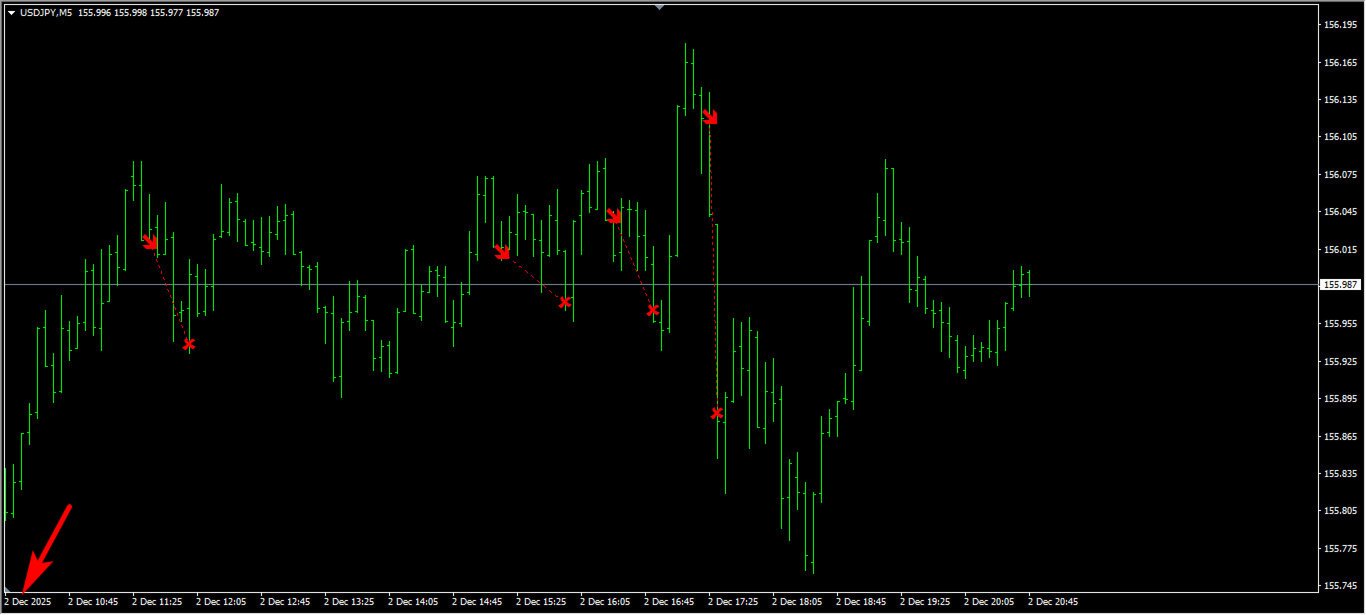
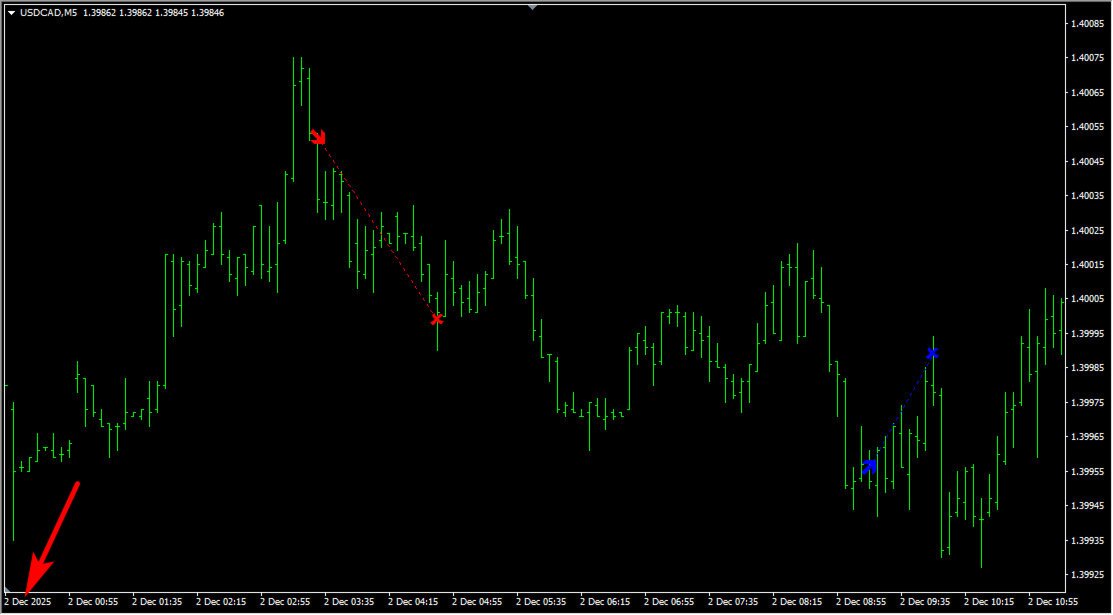
趋势预测箭头 – 清晰的买/卖信号。
-
低频但高精度 – 每天约 1 个信号。
-
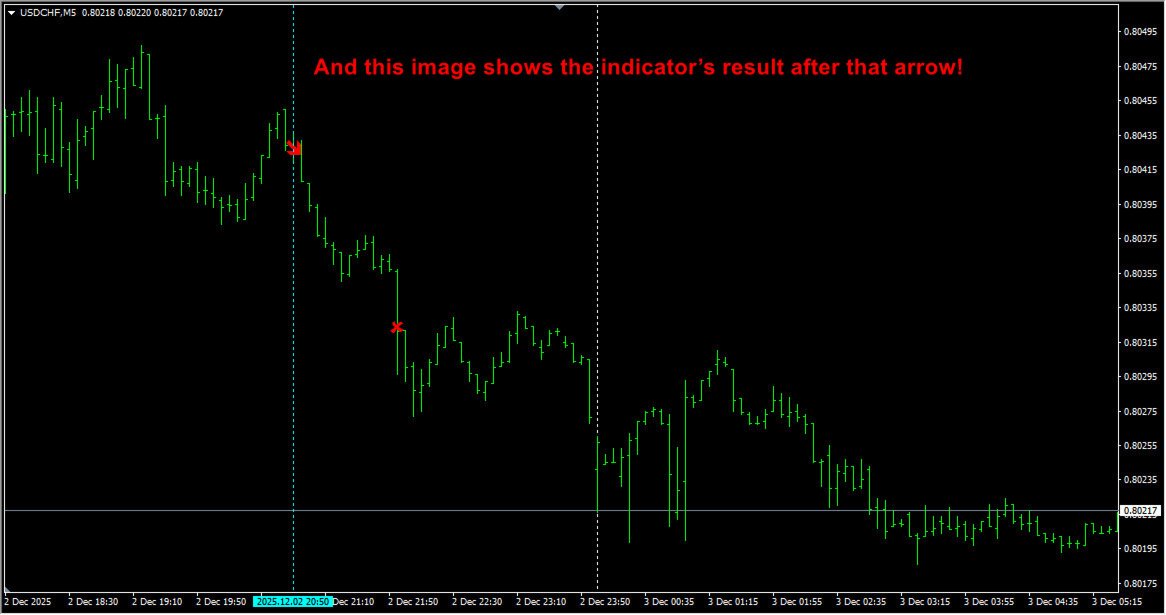
内置退出信号 – 显示最佳平仓时机。
-
无重绘 – 箭头一旦出现不会改变。
-
包含缓冲区 – 适合EA或自定义工具开发。
-
内置提醒 – 弹窗、声音、推送通知。
-
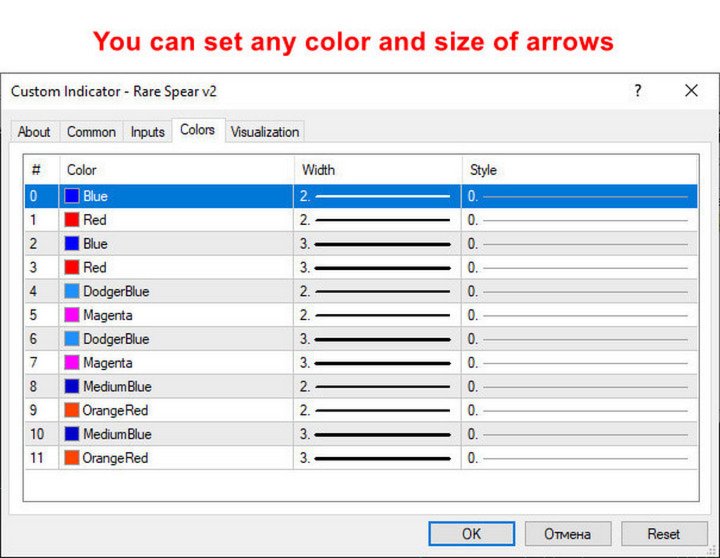
箭头大小可调 – 视觉完全可自定义。
-
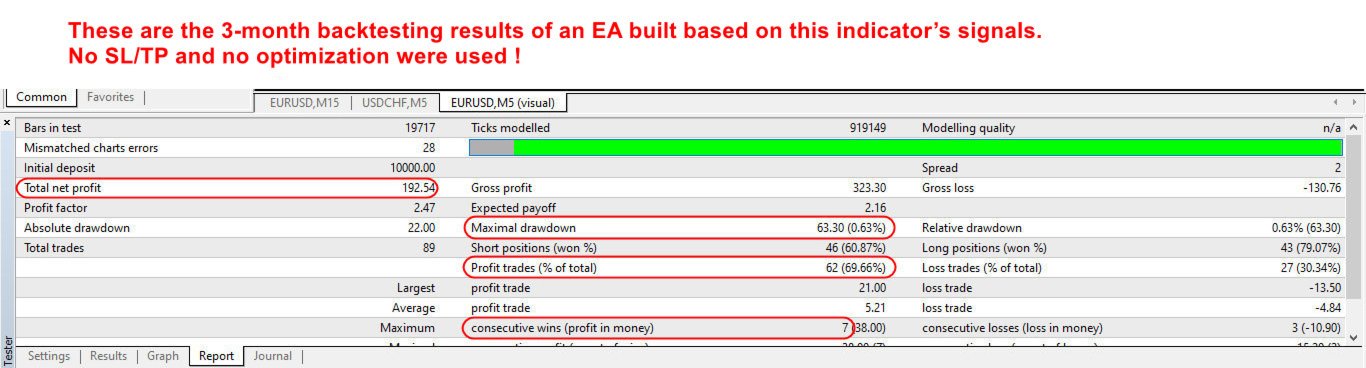
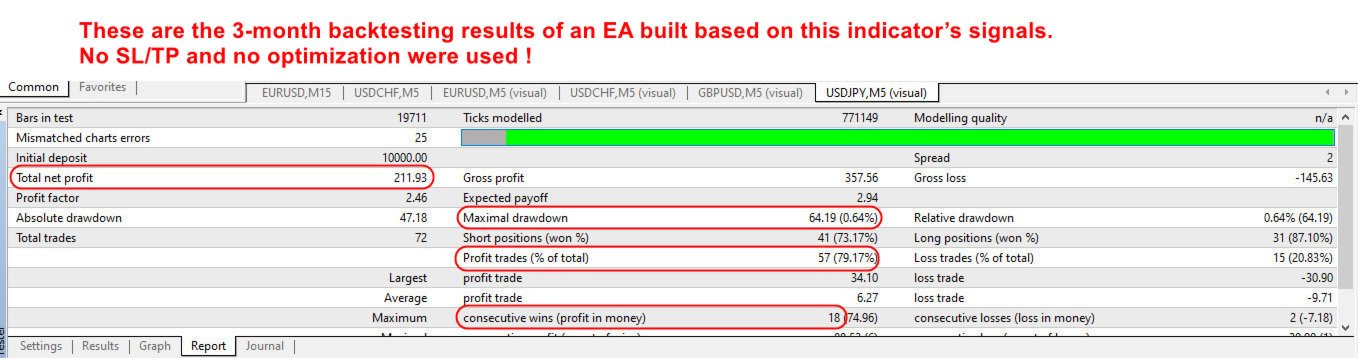
非常适合EA开发 – 无需SL/TP。
Exit箭头可有效避免长期回撤。 -
基于11年以上MQL经验开发 – 具有优秀的收益比。
信号准确率 约70%盈利 / 30%亏损。 -
无夸大、无噱头 – 自己测试即可。
推荐货币对
AUDUSD, EURGBP, USDCHF, AUDJPY, EURUSD。
推荐时间周期
M5、M15。
需要 MT5 版本或基于此指标的 EA?
欢迎联系我。