Rare Spear
- インディケータ
- バージョン: 2.30
- アップデート済み: 22 2月 2026
- アクティベーション: 10

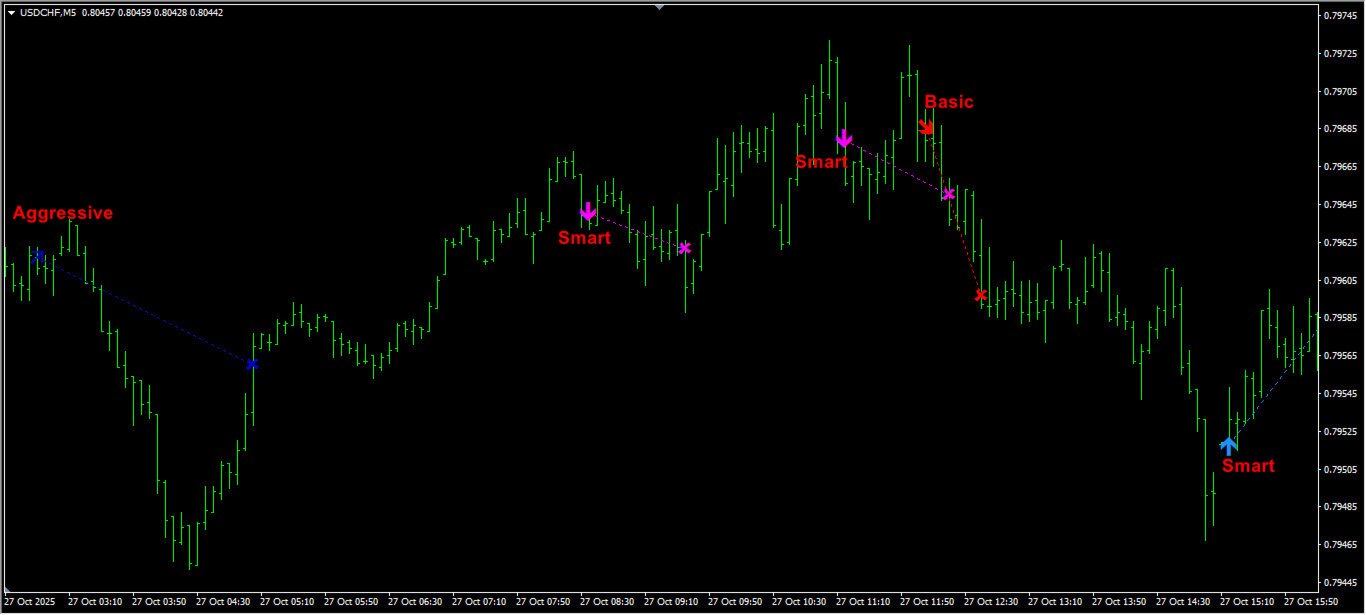
このインジケーターは、余計なノイズのない「正確でクリーンなシグナル」を重視するトレーダーのために作られた、シンプルで非常に信頼性の高いトレンド方向予測ツールです。
主な特徴
-
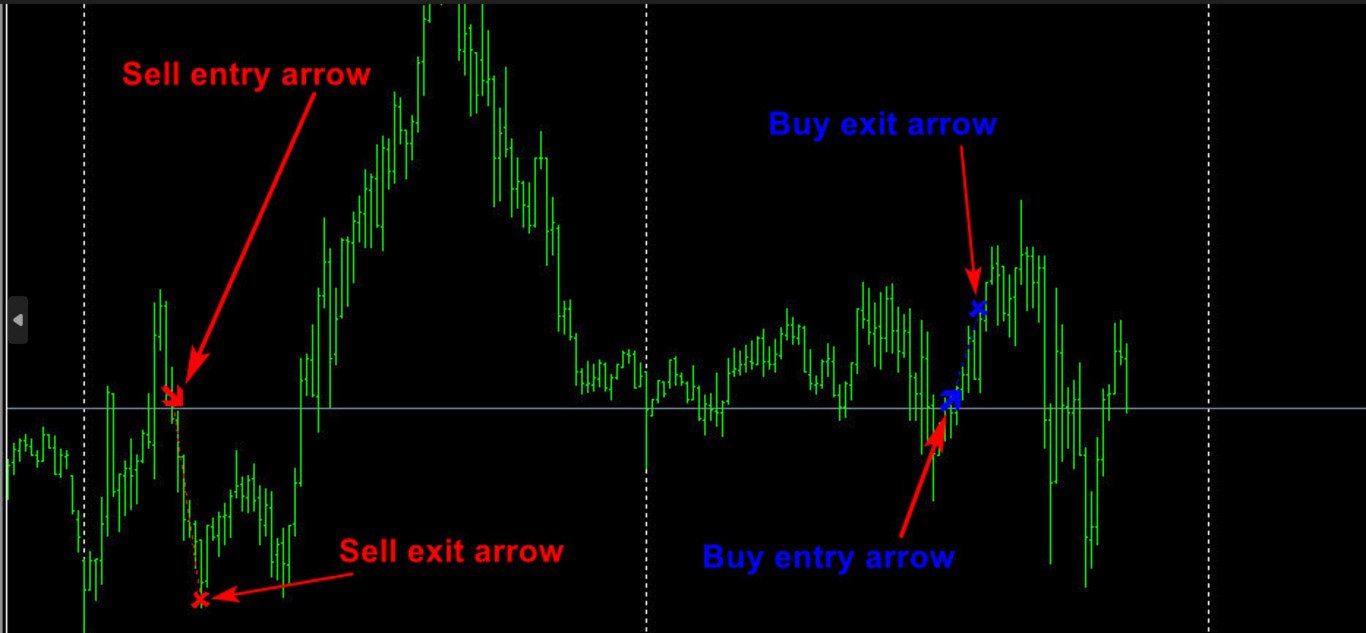
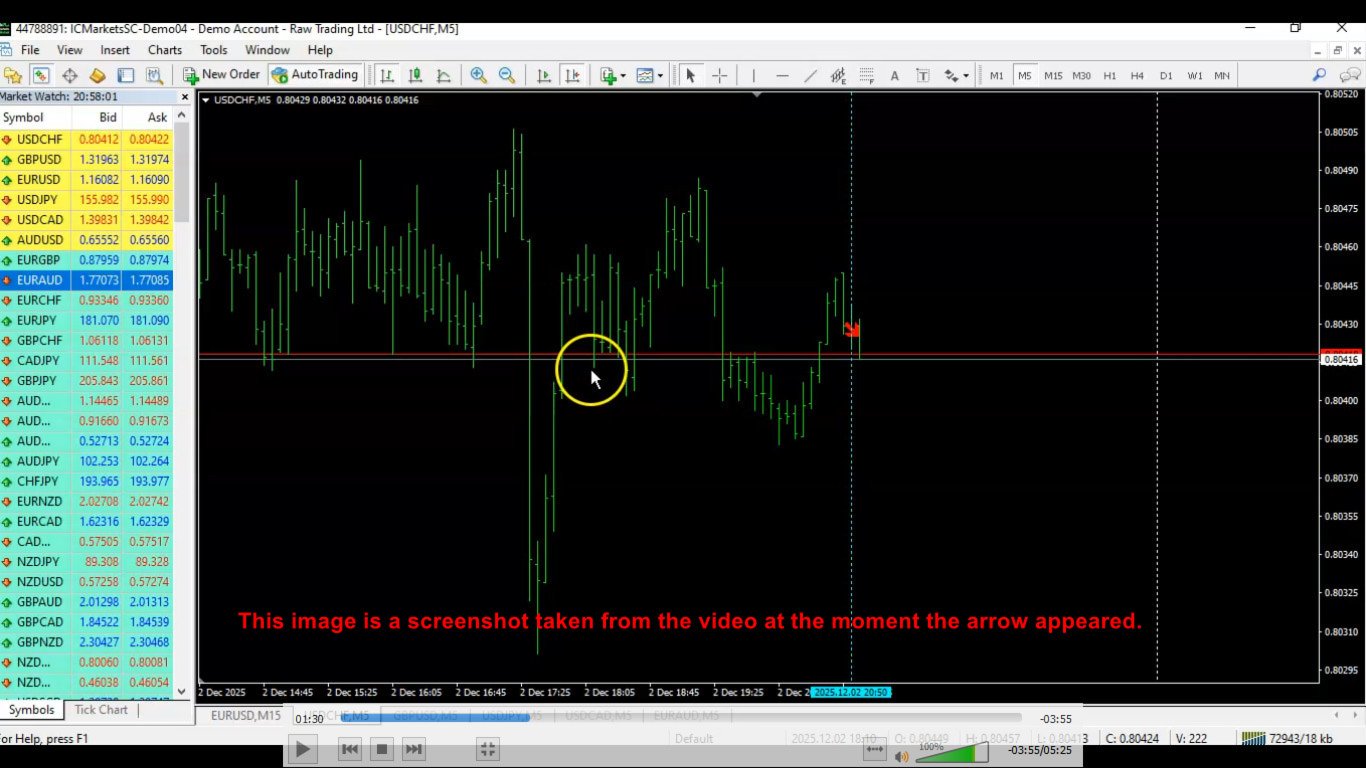
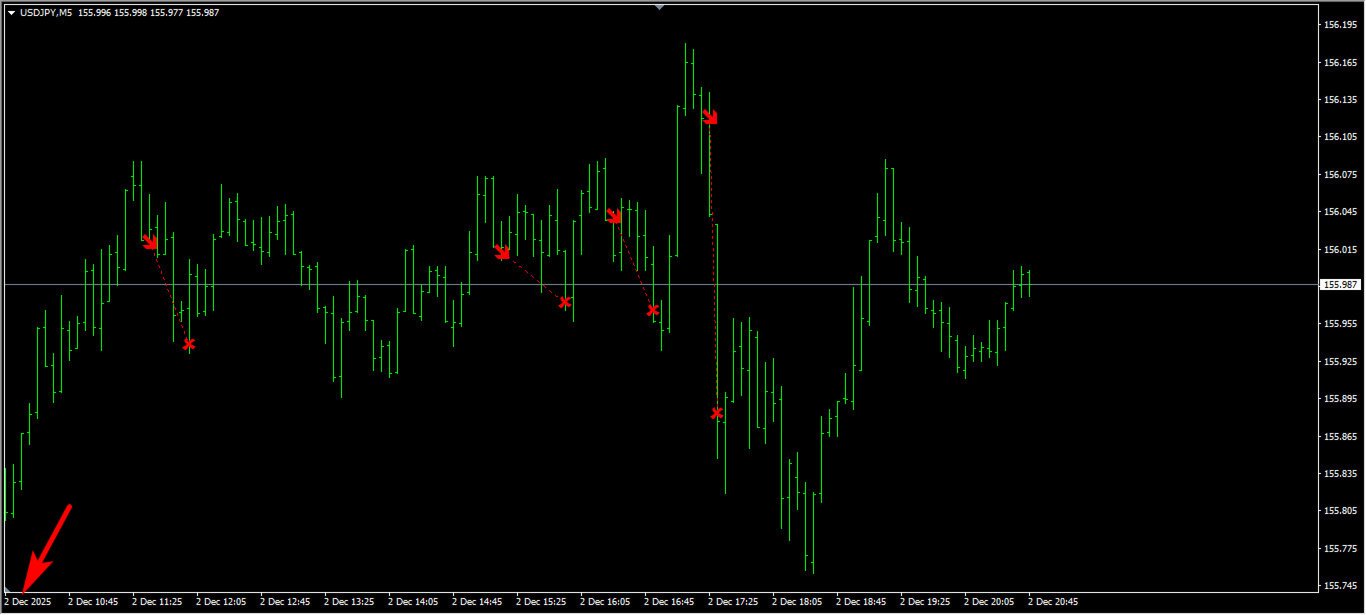
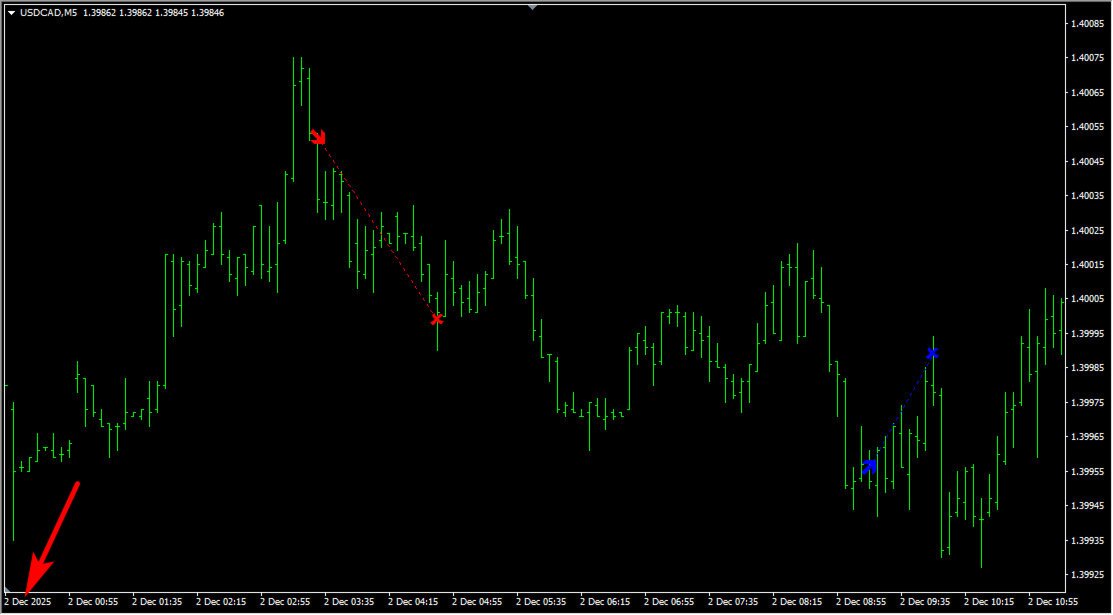
トレンド予測矢印 – 明確な買い/売りシグナル。
-
低頻度だが高精度 – 1日1回程度の高品質シグナル。
-
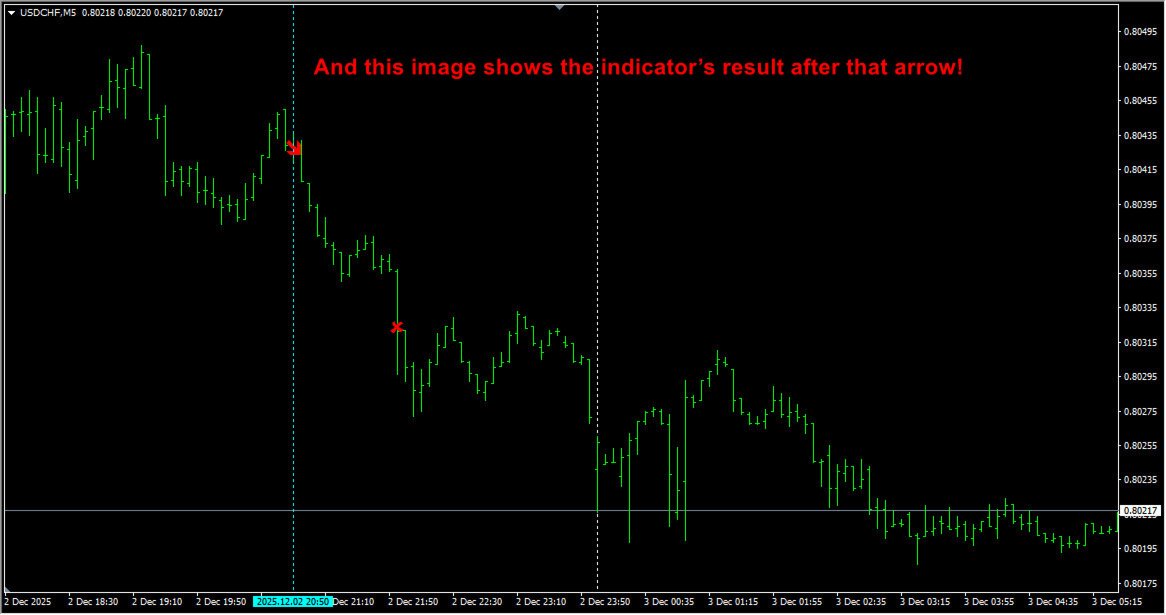
Exitシグナル搭載 – 最適な決済ポイントを表示。
-
リペイントなし – 矢印は表示後に変化しません。
-
バッファ搭載 – EA開発やカスタムツールに最適。
-
アラート搭載 – ポップアップ、サウンド、プッシュ通知。
-
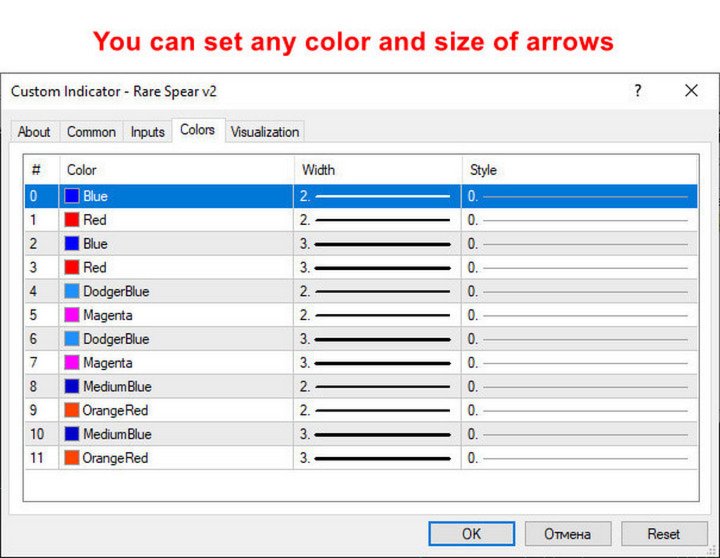
矢印サイズ調整可 – 視覚面を完全カスタマイズ。
-
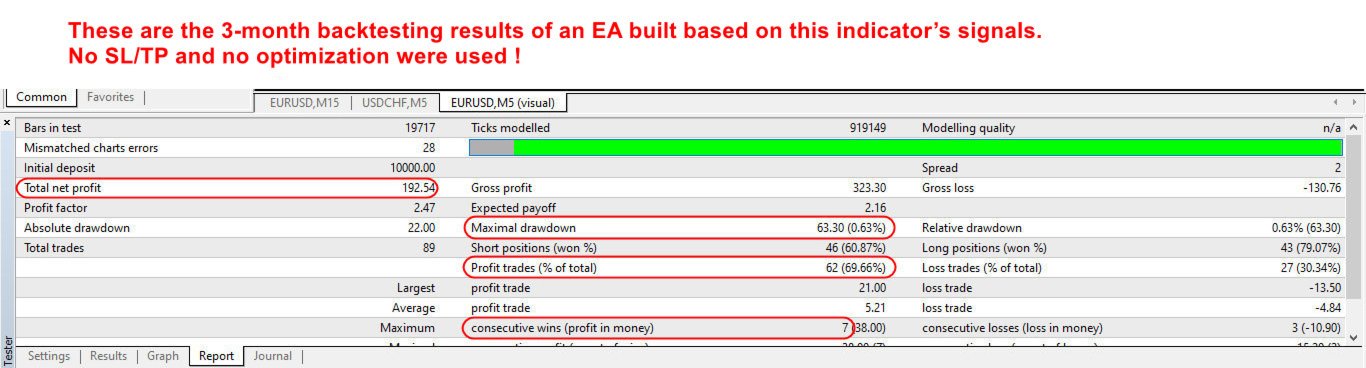
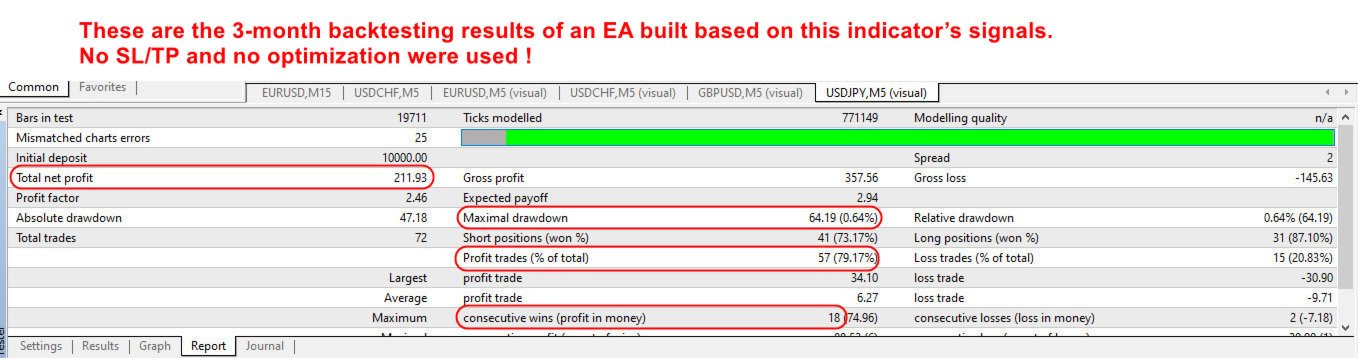
EA向けに最適 – SL/TP不要。
Exit矢印だけで長期ドローダウンを防止。 -
11年以上のMQL経験で開発 – 非常に優れたリワードレシオ。
精度は 約70%勝ち / 30%負け。 -
誇張なし・嘘なし – 試して自分で確認してください。
推奨通貨ペア
AUDUSD, EURGBP, USDCHF, AUDJPY, EURUSD。
推奨タイムフレーム
M5、M15。
MT5版やEAが必要な場合
ご連絡ください。