Rare Spear
- 지표
-
Hasanboy Beknazarov
 I’m an MT4/MT5 EA & Indicator Developer with over 10 years of experience (since 2014).
 - 버전: 2.30
- 업데이트됨: 22 2월 2026
- 활성화: 10
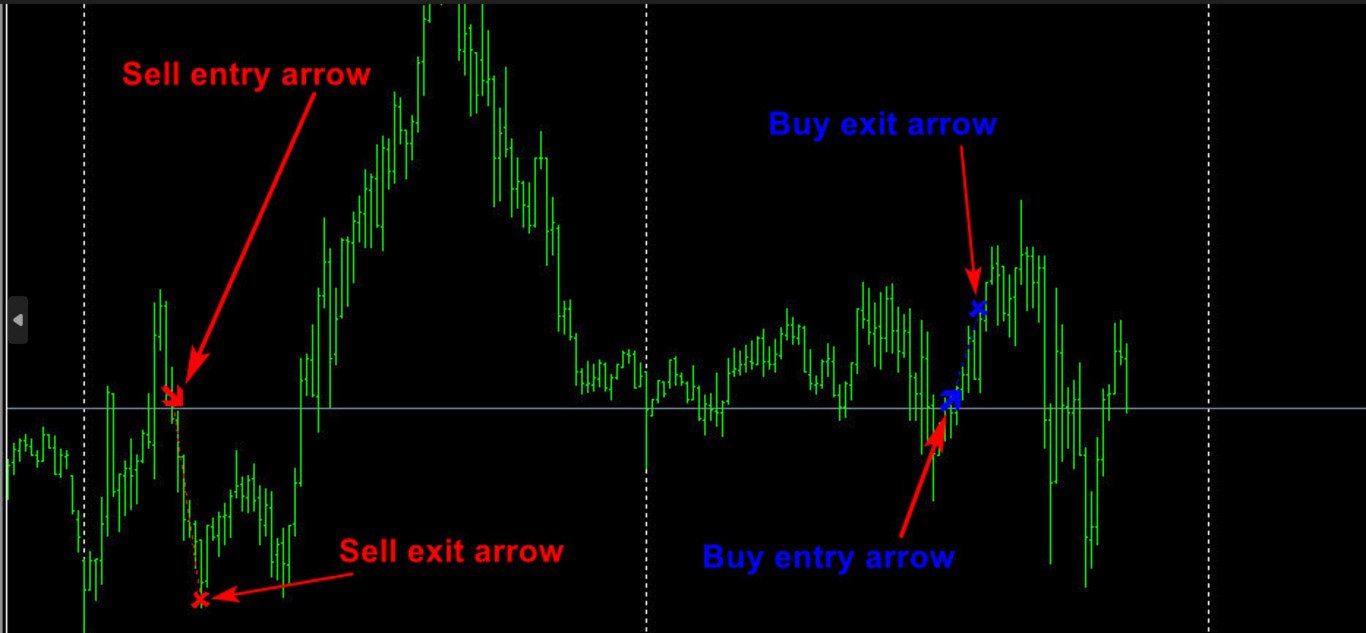
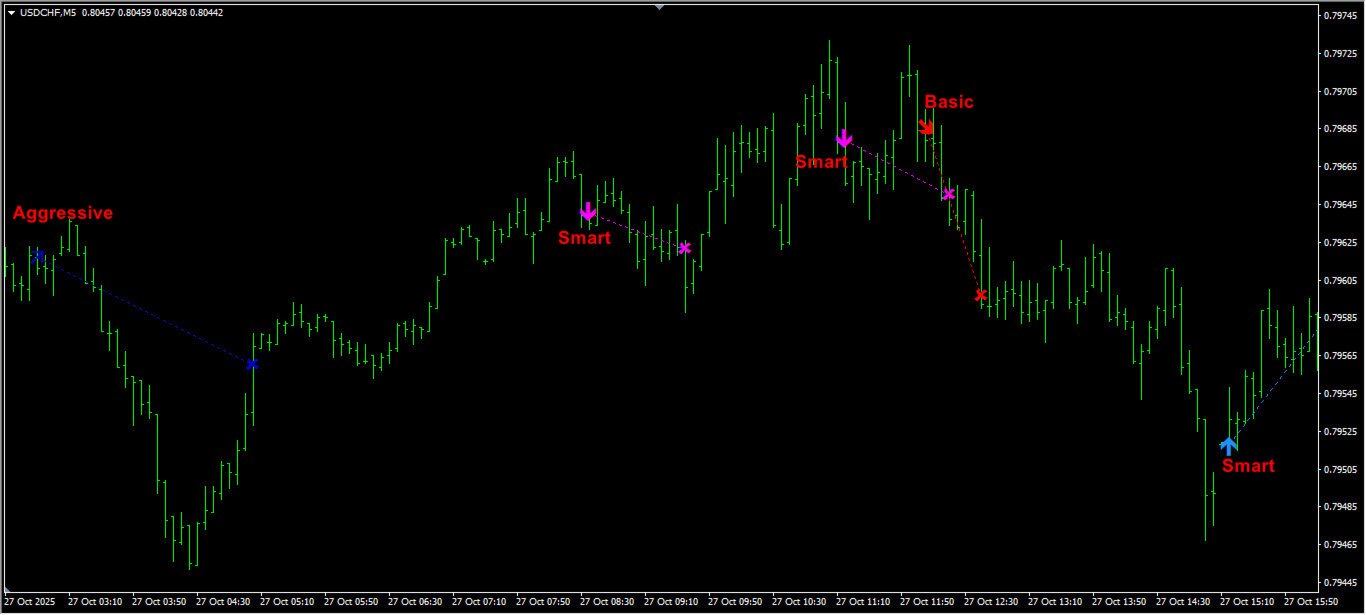
이 인디케이터는 불필요한 노이즈 없이 깨끗하고 정확한 신호를 원하는 트레이더를 위해 설계된, 간단하지만 매우 신뢰할 수 있는 추세 방향 예측 도구입니다。
주요 기능
-
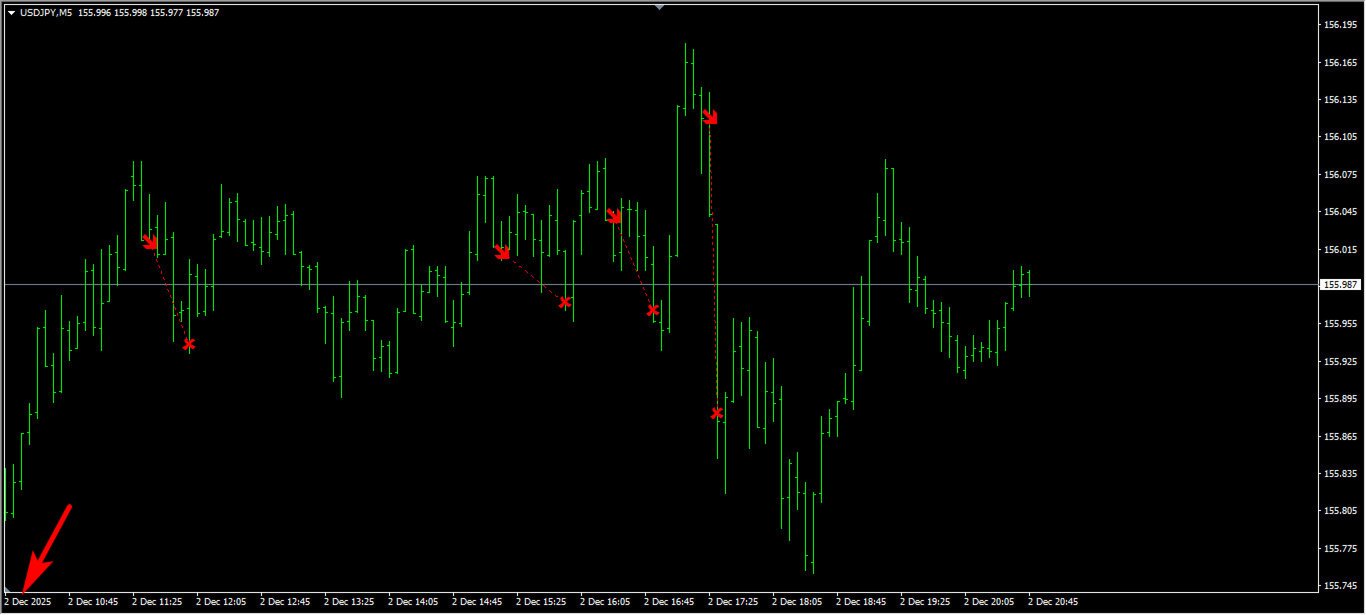
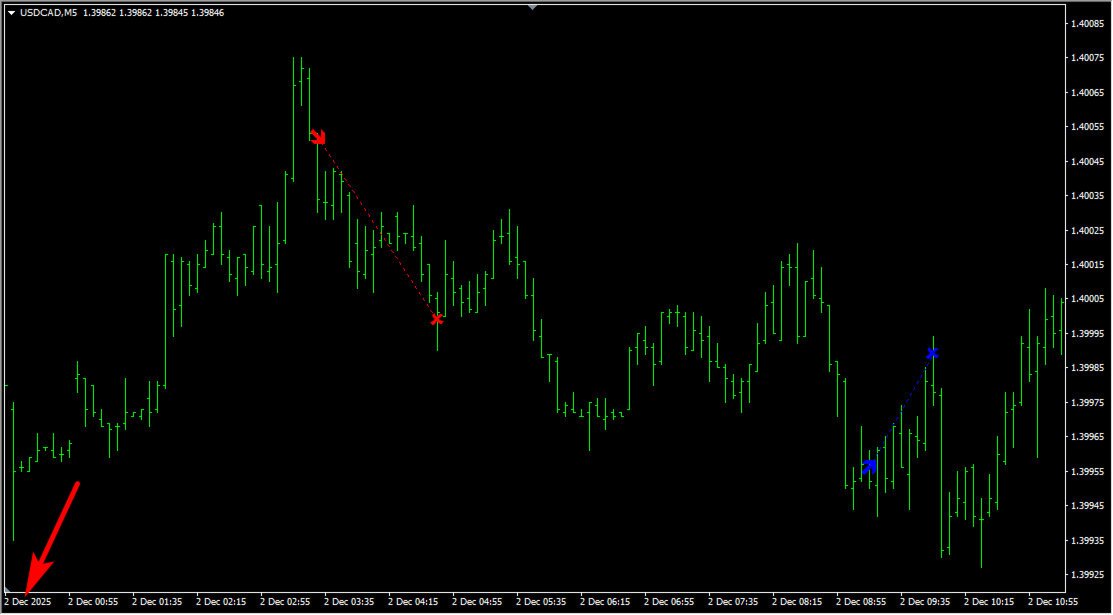
추세 예측 화살표 – 명확한 Buy/Sell 신호。
-
적지만 매우 정확한 신호 – 하루 약 1회。
-
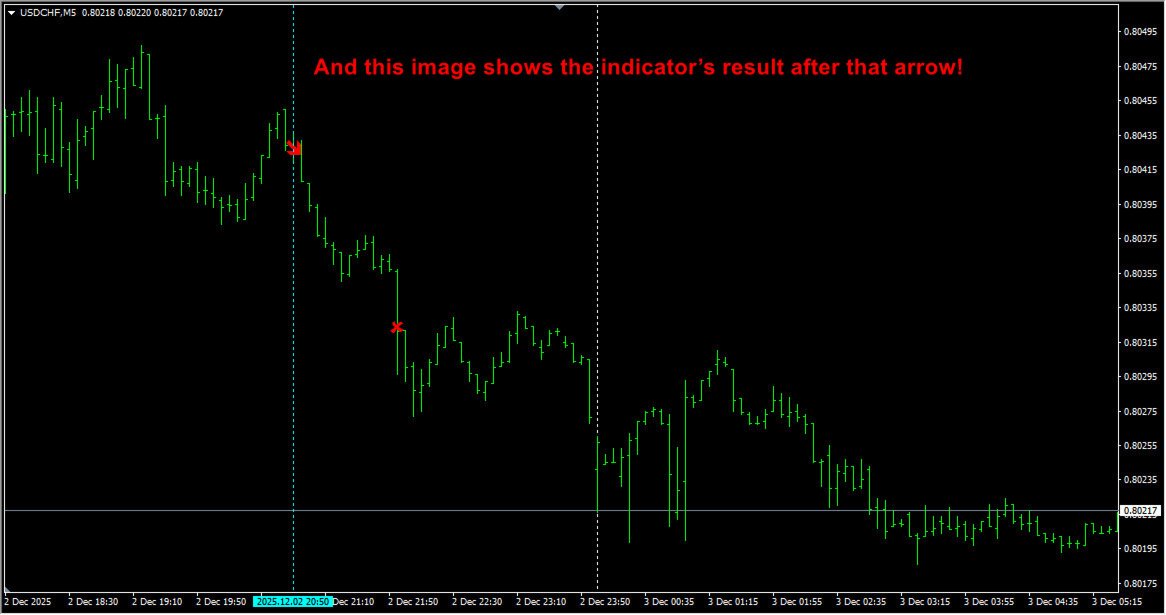
Exit 신호 포함 – 최적의 청산 시점 표시。
-
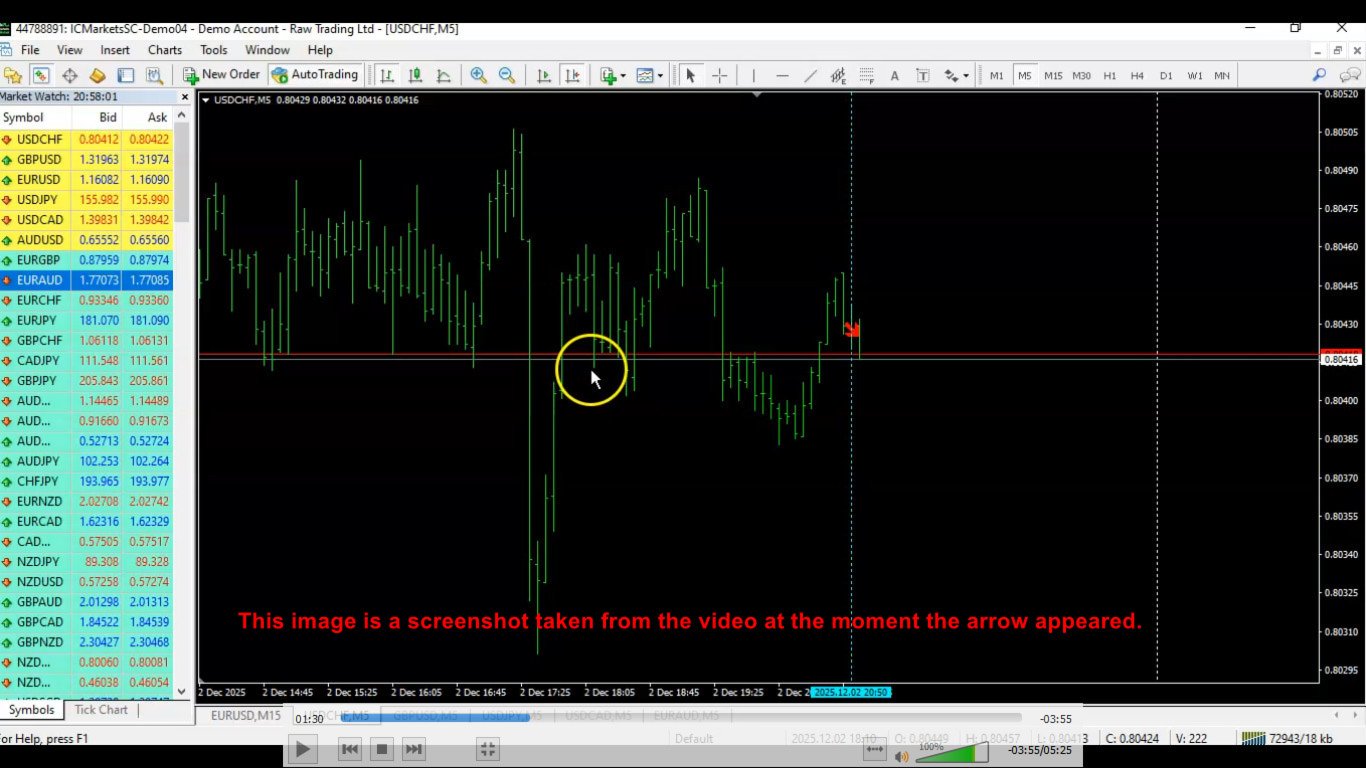
리페인트 없음 – 화살표는 한 번 표시되면 변하지 않음。
-
버퍼 포함 – EA 개발에 적합。
-
알림 기능 – 팝업, 사운드, 푸시 알림。
-
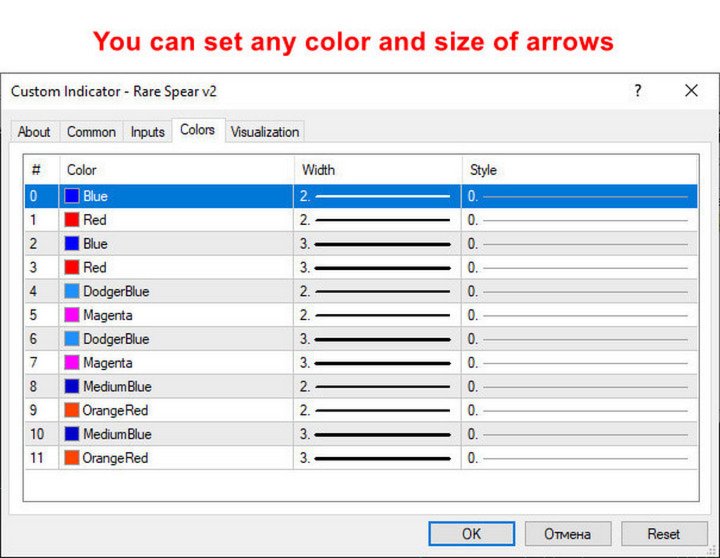
화살표 크기 조절 가능 – 시각적 요소 완전 커스터마이즈。
-
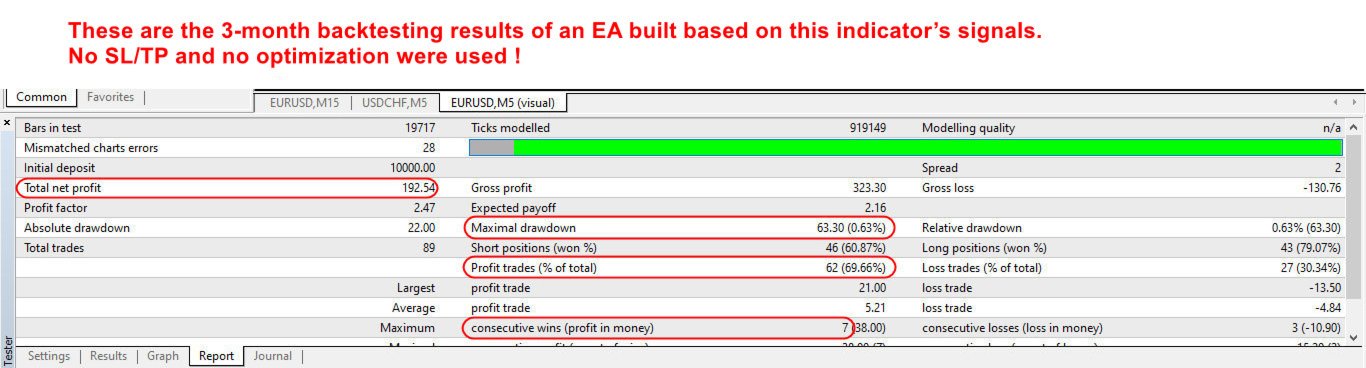
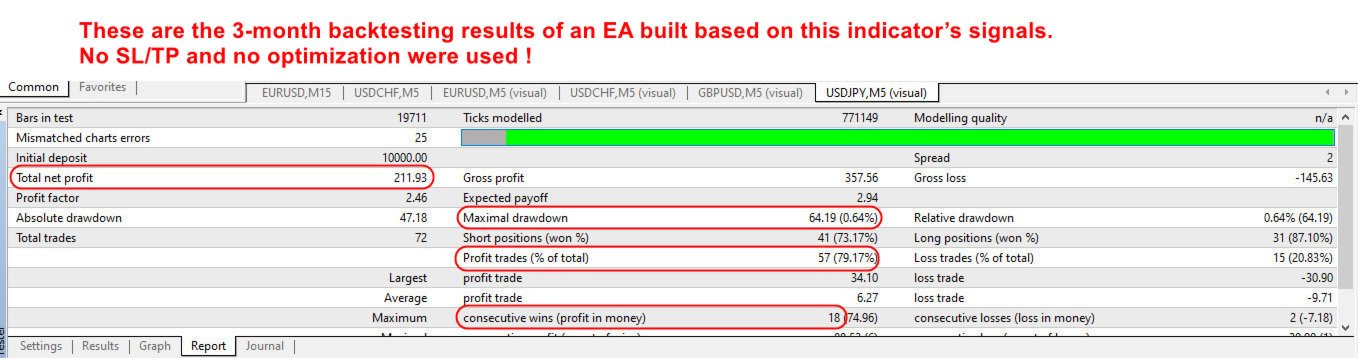
EA 개발에 최적 – SL/TP 필요 없음。
Exit 화살표만으로 긴 드로우다운을 방지。 -
11년 이상의 MQL 경험 기반 – 매우 뛰어난 보상비율 제공。
정확도: 약 70% 승리 / 30% 손실。 -
허황된 약속 없음 – 과장 광고 없음。
직접 테스트해보세요。
추천 종목
AUDUSD, EURGBP, USDCHF, AUDJPY, EURUSD。
추천 시간 프레임
M5, M15.
MT5 버전 또는 EA가 필요하신가요?
언제든지 연락주세요。