My Point MT4
- 指标
- 版本: 1.10
- 更新: 9 八月 2022
- 激活: 5

Diagnosis of major and minor pivot
Trend detection
with many signals
Can be used in all symbols
Can be used in all time frames
Settings:
Back Show: The number of candles it displays
If you need any adjustments, or have any questions or suggestions, message me
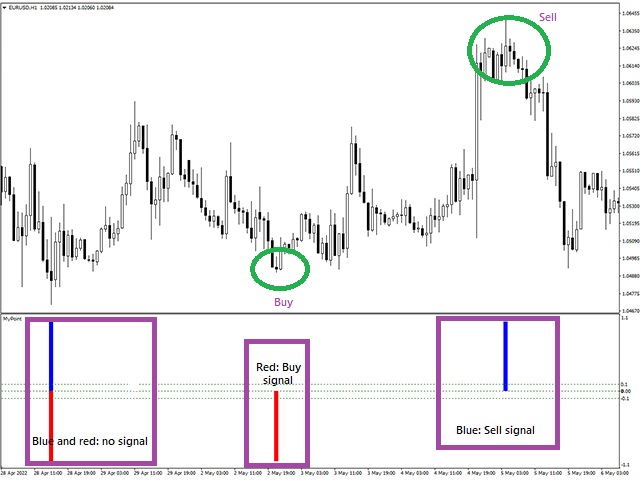
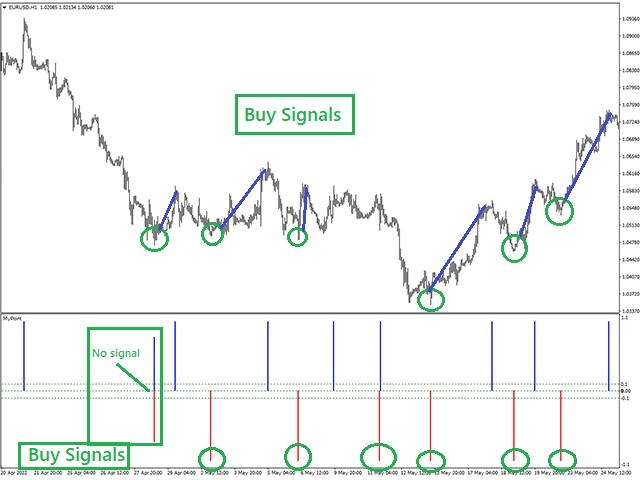
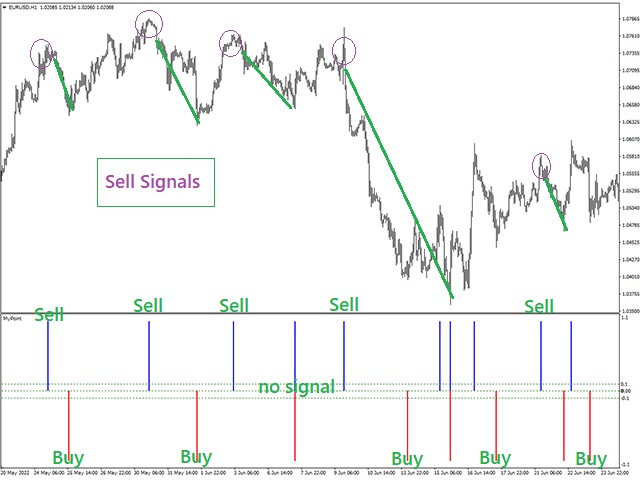
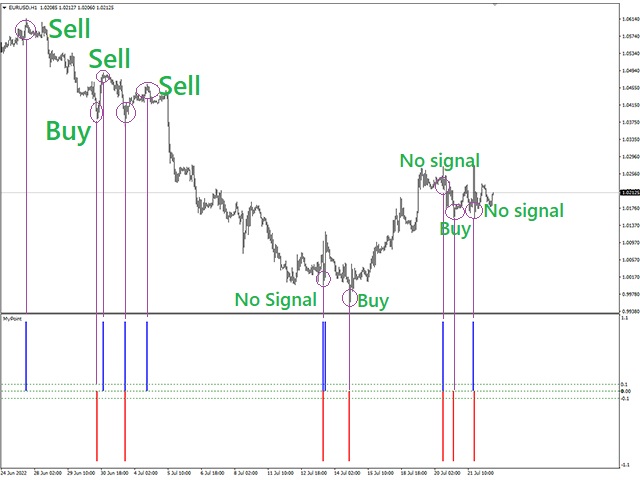
How to trade:
Blue: sell signal
Red: buy signal
Blue and red at the same time: no signal
Exit signal: Opposite signal

although I only got the system yesterday its been fantastic yeah I know early days but promising so right now I'll give it 4 stars untill a couple of weeks at least great!!!!