Supply and Demand Zones MT5

4.86

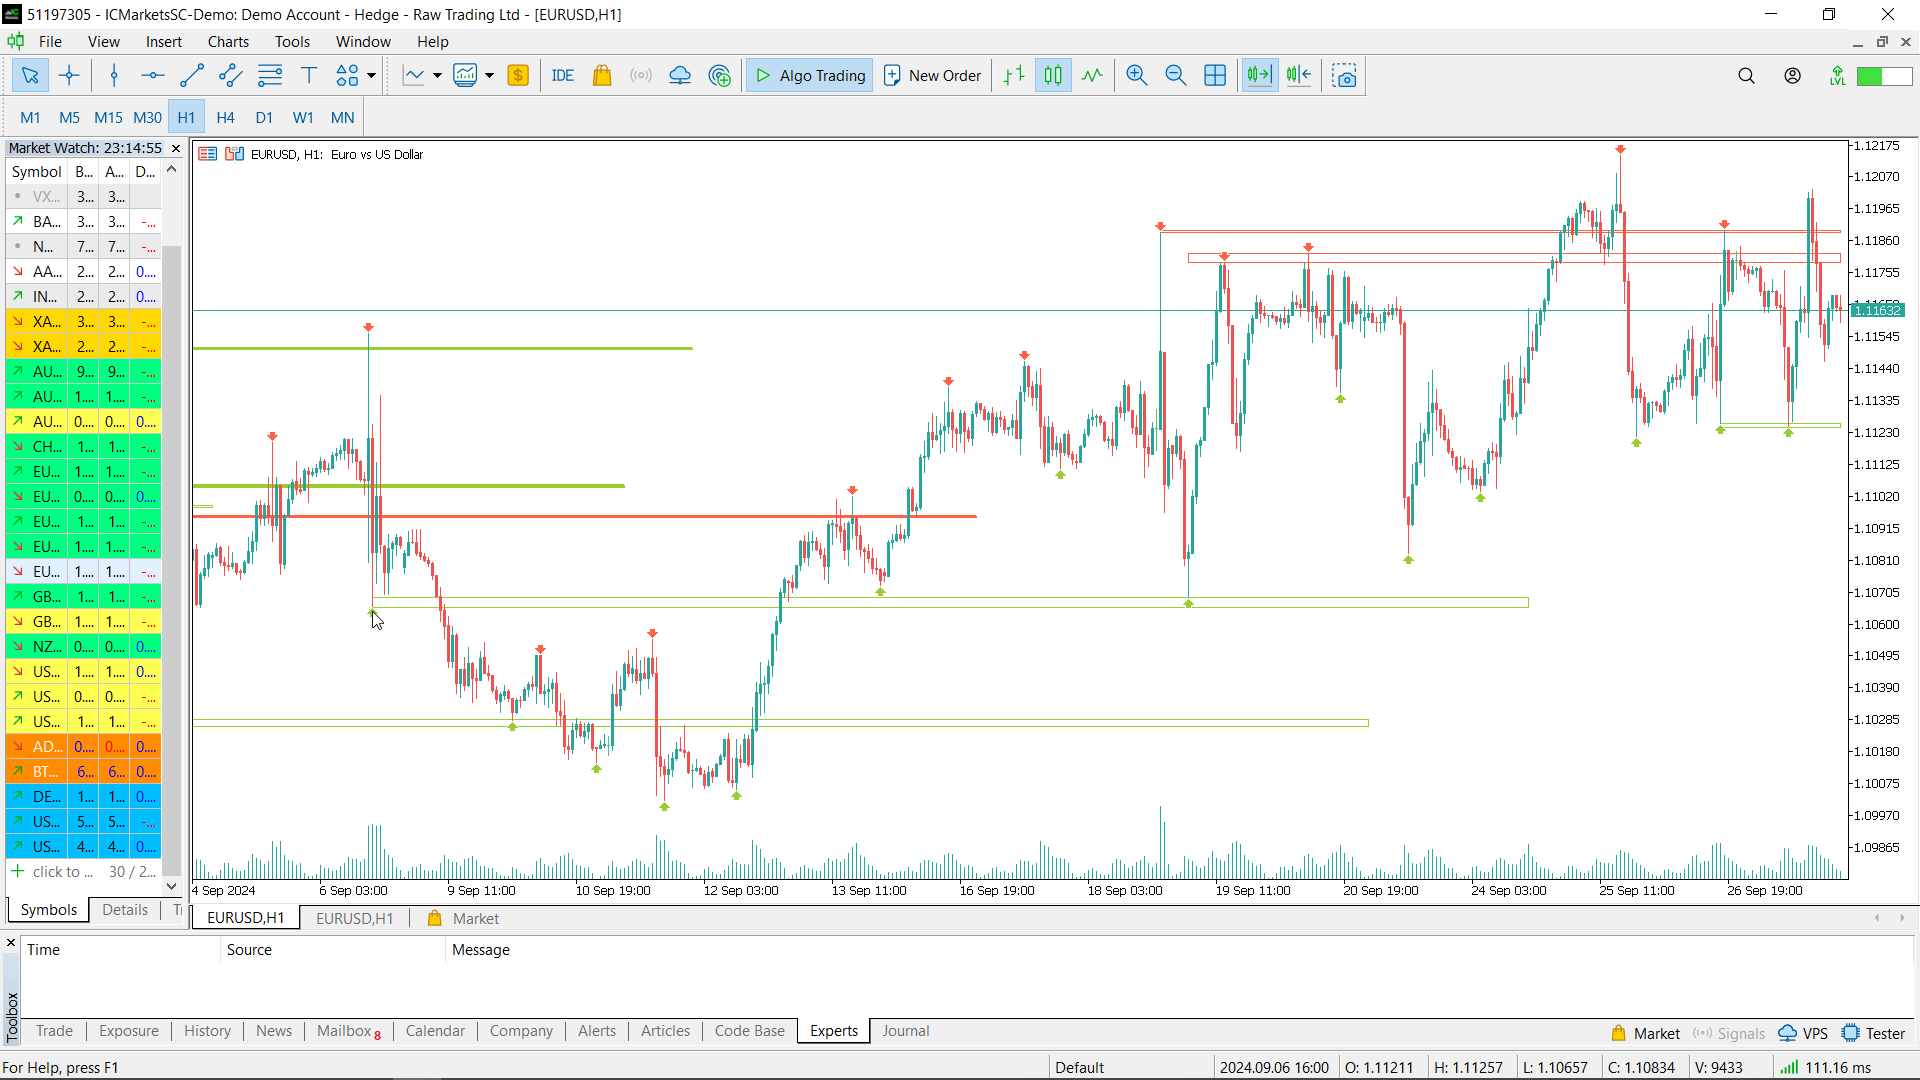
The Supply and Demand Zone Indicator is a powerful and easy-to-use tool designed to help traders identify critical supply and demand zones on the chart. These zones can provide valuable insight into potential market reversals, breakouts, and important price levels where buyers or sellers are likely to take control.

The best FREE Trade Manager.

If you want to create your own Hedging or Grid strategies without any coding make sure to check out the ManHedger

Key Features:

  • Automatic Zone Detection: The indicator automatically identifies supply and demand zones based on historical price action and support/resistance levels, taking the guesswork out of manual analysis.
  • Customizable Parameters: Adjust the sensitivity of the zones, number of levels to display, and the period for calculating the zones to fine-tune the indicator to your trading style.
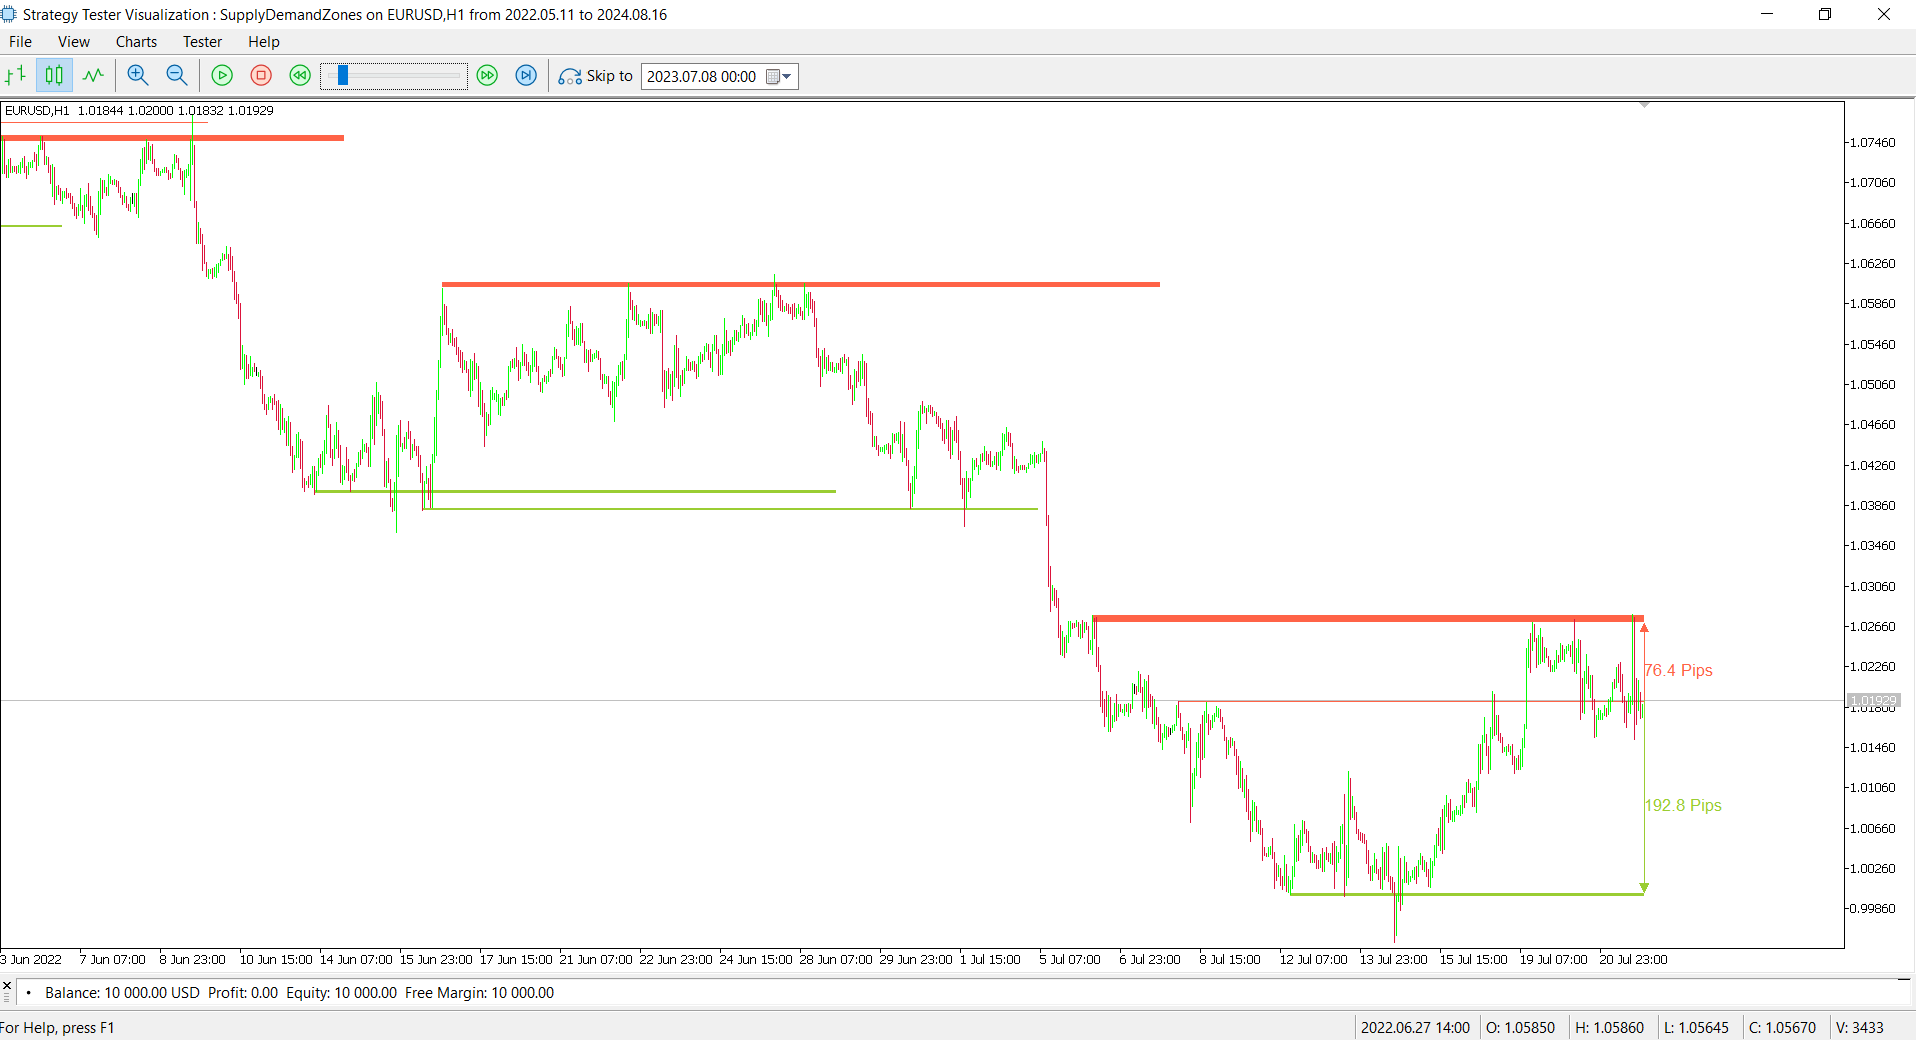
  • Visual Representation: Supply and demand zones are visually represented on the chart using customizable rectangles. You can choose whether to fill the zones or display outlines, and customize the colors for easy identification.
  • Support & Resistance Levels: Optionally, display support and resistance levels with arrows to better understand how the indicator works and how zones are formed.
  • Alerts: Receive notifications when the price is approaching a significant supply or demand zone by setting up customizable alerts.
  • Distance Display: You can also display the distance from the nearest supply and demand level directly on the chart, giving you real-time feedback.

How It Works: The indicator uses support and resistance levels to form supply and demand zones. If several support levels are close to each other and price has bounced upward between them, a demand zone is formed. Similarly, if resistance levels are clustered together and the price has dropped between them, a supply zone is formed.

The indicator is highly flexible, allowing traders to customize the parameters based on their preferences and trading strategy. Whether you're looking for strict zones or wider areas of interest, the sensitivity and other settings can be adjusted to meet your needs.

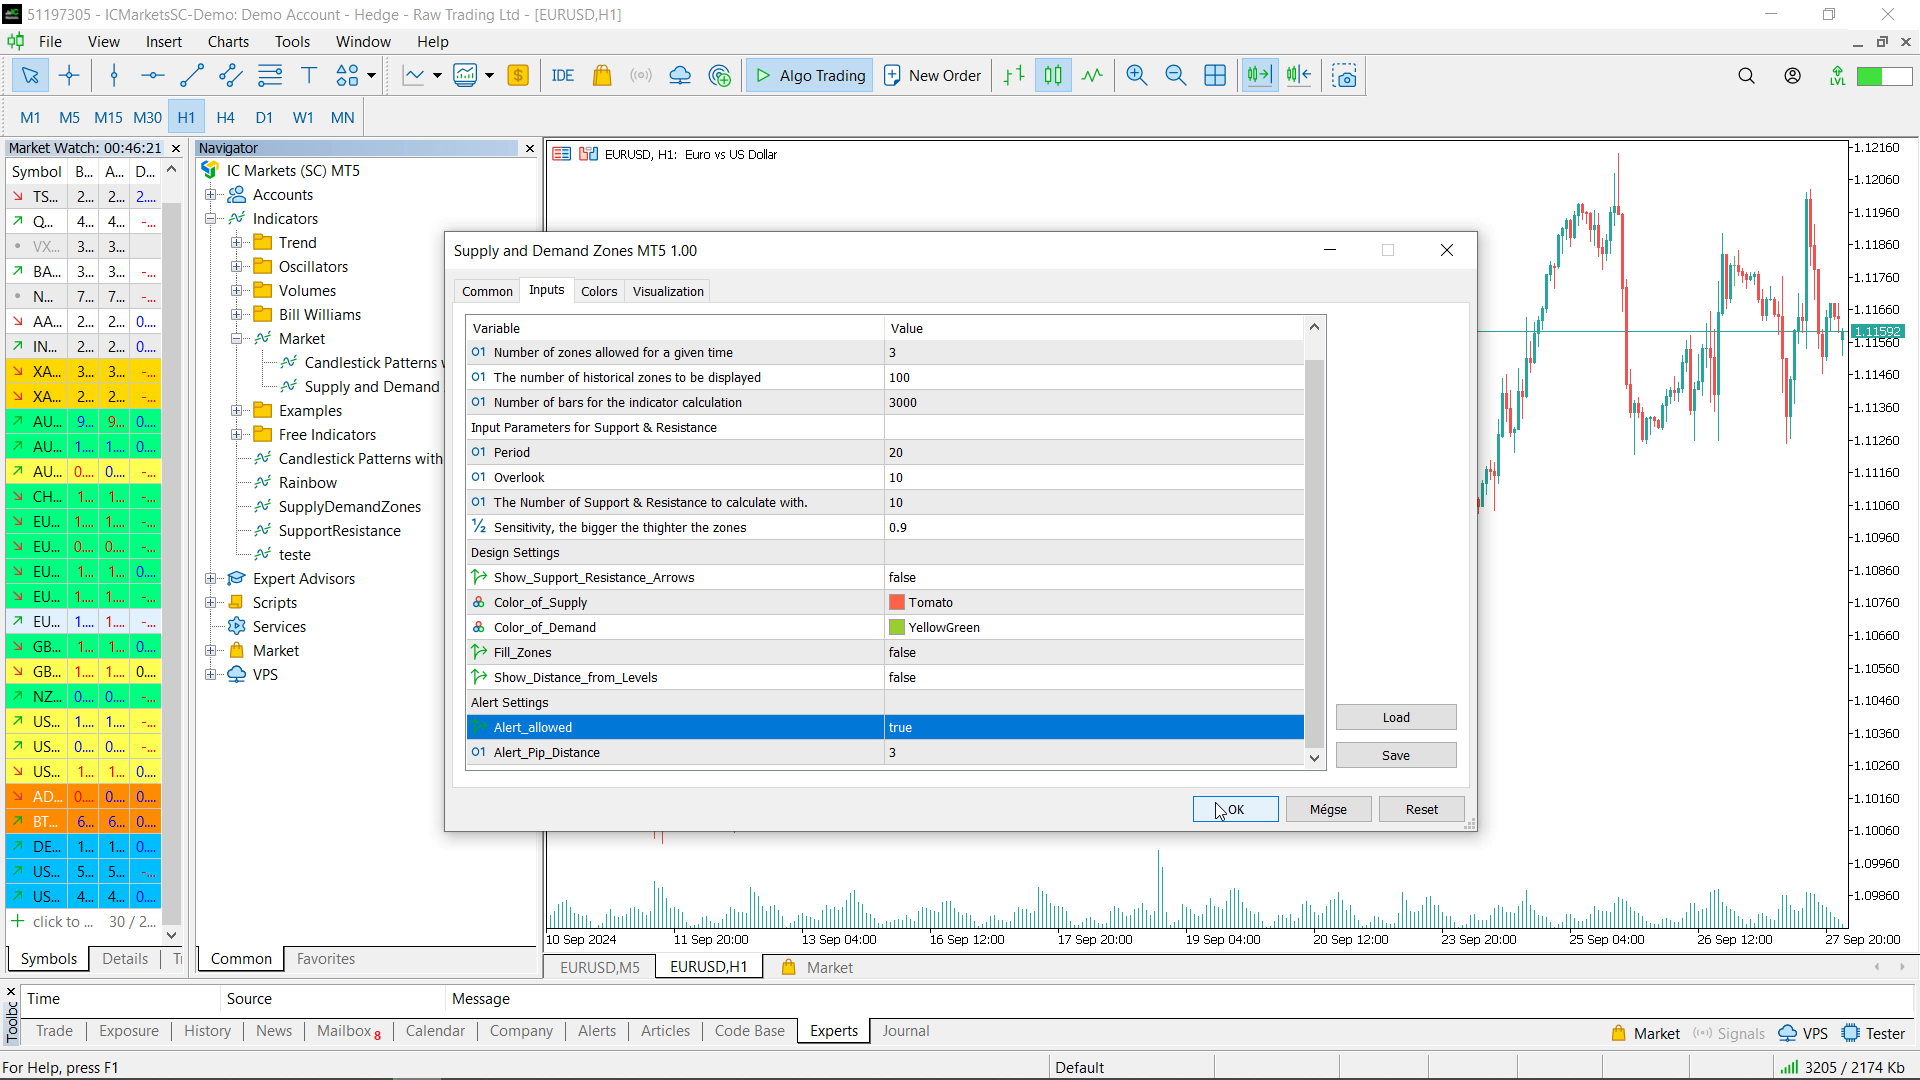
Settings & Input parameters:

  • Level_Count_Max (Default = 3):
    Defines the maximum number of zones that can be displayed on the chart at any given time.

  • Historical_Level_Count (Default = 100):
    Sets the number of historical supply and demand zones that will be displayed on the chart.

  • Look_Back_Bars (Default = 3000):
    Specifies how many bars back the indicator will consider for its calculations. A higher number of bars means more data is used for calculating the zones, which could take longer to process.

  • Period (Default = 20):
    Defines the number of bars the indicator uses to calculate the support and resistance levels. For example, it looks at the maximum/minimum price in the last 20 bars to identify potential levels.

  • Overlook (Default = 10):
    Sets the number of additional bars considered when identifying support and resistance levels. This can help refine the detection of levels beyond the immediate price action.

  • Number_of_Levels_to_Calculate_With (Default = 10):
    Specifies how many of the most recent support and resistance levels should be used when calculating potential supply and demand zones.

  • Sensitivity (Default = 0.90):
    Controls how closely two support or resistance levels need to be to form a zone. The higher the value, the more tightly the zones must cluster together to be considered valid. Lower values allow for wider zones.

  • Show_Support_Resistance_Arrows (Default = false):
    If enabled, arrows will be drawn on the chart to show the exact points where support and resistance levels were calculated, helping you understand the mechanics behind the indicator.

  • Color_of_Supply (Default = clrTomato):
    Sets the color used to represent the supply zones on the chart. The default color is Tomato.

  • Color_of_Demand (Default = clrYellowGreen):
    Sets the color used to represent the demand zones on the chart. The default color is YellowGreen.

  • Fill_Zones (Default = false):
    If enabled, the indicator will fill the supply and demand zones with the specified colors. If disabled, it will only draw the outlines of the zones.

  • Show_Distance_from_Levels (Default = false):
    If enabled, the indicator will display the distance in pips from the current price to the nearest supply or demand level, giving you a real-time sense of proximity to key zones.

  • Alert_Allowed (Default = false):
    If enabled, the indicator will trigger an alert when the price approaches a significant supply or demand zone, as defined by the Alert_Pip_Distance parameter.

  • Alert_Pip_Distance (Default = 1):
    Sets the distance in pips from the current price to a supply or demand zone at which the alert will trigger. For example, if set to 1 pip, the alert will sound when the price is within 1 pip of a zone.

Repainting Indicator: Please note that the indicator repaints as new data comes in, meaning the zones adjust dynamically based on how price moves and forms new highs or lows.

Use Case: This indicator is suitable for all types of traders, including swing traders, day traders, and long-term investors who rely on price action. It helps identify critical zones where the market could react, allowing you to make more informed trading decisions.


#tags: Supply Demand & Supply & demand, free supply demand free supply and demand best supply and demand best free supply demand supplydemand Supplydemand

评分 27
Richdad001
40
Richdad001 2026.04.11 19:03 
 

Helps me to find an edge. Thanks Peter

Nickylou Seville
19
Nickylou Seville 2026.02.24 08:47 
 

how to adjust the indicator of buy and sell the arrow down if sell and arrow up if buy? to appear after 1-3 candle?

totati
89
totati 2025.11.20 19:29 
 

Very good tool! I mainly deal with automated trading, but I really like using this indicator. It is a great help for me to confirm or deny signals. I mainly work with index CFDs, where it draws very good levels.

推荐产品
成交量分布多模式:按您自己的方式分析成交量,而不是按指标的方式。 大多数成交量分布指标将交易者限制在预定义的分析范围内。但市场并非按照固定的模式运行,所以你的分析也应该如此。 成交量分布多模式指标 让您可以完全自由地决定在何时何地以及如何分析成交量。无论您是研究市场结构、分析交易时段、监控更高时间框架的活动,还是追踪正在形成的竞价行情,该指标都会适应您的交易风格,而不是强迫您去适应它。 Volume Profile Multi-Mode 专为寻求直观工作流程的初学者和要求灵活性的专业人士而设计,它将四种强大的分析方法结合到一个高度交互式和可定制的交易工具中。 四种强大的分析模式 1.       灵活框: 在控制面板中将切换按钮设置为 “灵活框” ,然后点击“创建新的灵活框” 。只需在任何价格结构周围绘制一个矩形,指标即可立即在选定区域内生成成交量分布图。您可以随时移动、调整大小或删除该框,以便在分析发生变化时创建多个独立的分布图,从而同时比较不同的市场结构。 2.       固定范围 :将切换按钮设置为 “固定范围” ,然后单击 “创建新的固定范围” 。图表上会显示两条可移动的垂直
ONNYX INDICATOR 版本 1.14 这是一款用于 MetaTrader 5 的供需区域分析指标。已确认的历史信号采用收盘K线逻辑,避免确认后的箭头因盘中波动而消失。指标根据确认的摆动高低点建立区域,使用 ATR 调整区域宽度,并以百分比显示区域质量。 主要功能 - 供需区域及区域内百分比评分。 - 收盘K线确认后的放大 BUY/SELL 箭头。 - 可选 EMA 趋势过滤和K线拒绝确认。 - 趋势、价格水平和市场环境面板。 - 最多显示 5 条相关经济新闻;公布前显示 Forecast 和 Previous,公布后显示 Actual。 - 新闻每 60 秒刷新,并支持策略测试器中的日历缓存。 - 弹窗、推送和邮件提醒。 - iCustom 集成:缓冲区 0 为 BUY 价格,缓冲区 1 为 SELL 价格。 使用方法 将指标加载到图表,等待历史数据完成加载,查看趋势和有效区域,然后结合自己的交易计划使用收盘K线信号。XAUUSD H1 适合更清晰的结构,M15 可获得更频繁的机会。 重要提示 本产品是分析指标,不是自动交易 EA,不会自动开仓、修改或平仓,也不保证盈利。请先
Trading Discipline Trend Dashboard 只读取您自己账户已平仓的交易历史,并把四种特定模式转化为7天走势,让您看清某种行为只是偶然一次,还是每周都在重复。它不做预测,也不给建议。面板上的每一个数字,都是这个账户上已经发生过的事实。 数字是怎么算出来的:它读取最多37天内所有品种、所有魔术号的已平仓交易——这是整个账户的画面,而不只是当前图表品种的画面。四行数据,各有各的定义。Post-loss oversize 统计在一次亏损平仓后10分钟内开出的新仓位中,手数超过30天基准值(同类新仓的手数中位数)的笔数——这与免费指标 Trade Behavior Mirror 的定义完全相同。Win-streak oversize 统计在连胜仍在持续期间开出的新仓位中,手数超过同类30天基准值的笔数——这与免费指标 Win Streak Size Creep Mirror 的定义完全相同。Symbols per day (avg) 统计某一天有新仓位的不同品种数量,并显示统计窗口内的日均值——这与免费指标 Multi-Symbol Chase Mirror 的定义
RSI Cortex Ai
Michael Prescott Burney
适用于 MetaTrader 5 的 RSI Cortex AI RSI Cortex AI 是一款 MetaTrader 5 技术分析指标,它通过多因素排名框架帮助交易者评估动量。其设计旨在提供超越单一 RSI 读数或固定超买/超卖阈值的结构化图表信息。 该指标将动量测量、方向排名、置信度评分、自适应趋势背景和过滤工具整合到图表仪表盘和相应的震荡指标子窗口中。它旨在辅助主观分析,并不负责下单、修改或平仓。 主要特点 多因素动量分析 实时排名分数,范围从 0 到 100 实时信心评分,范围从 0 到 100 方向性偏差和趋势背景显示 自适应趋势和滤波框架 波动感知和切碎过滤上下文 图表信息仪表板 匹配振荡器子窗口 三个即用型预设:Scalper、Balanced 和 Swing 专为 MetaTrader 5 设计 RSI Cortex AI 的工作原理 传统的RSI设置通常侧重于一个RSI值和固定水平,例如70和30。RSI Cortex AI使用更广泛的动量相关输入来生成其图表读数。 其内部模型评估的信息可能包括相对强弱指数(RSI)水平、RSI斜率、加速度、与RSI中线的距离、百
Matrix Currency
Augusto Martins Lopes
Matrix Currency - 多时间框架分析工具 Matrix Currency是一款高级货币强度分析指标,为外汇市场的货币强度监控和策略决策提供高效支持。 主要特点 多时间框架分析 : 同时监控多个时间框架(从M1到MN1),实时更新,并以直观的矩阵形式展示结果。 智能警报系统 : 支持可配置的通知,包括弹窗、邮件及移动设备提醒。 交互式界面 : 可定制的面板,提供多种动态可视化选项与货币排名功能。 策略功能 多时间框架背离分析策略 基于不同时间框架货币强度和加速指标的分析(例如M15、H1和H4)。 极限强度策略 聚焦货币排名,识别最强或最弱货币,并与更高级别时间框架进行确认。 优势 减少主观分析,提供清晰的趋势判断。 高效支持决策,结合可视化与警报功能。 便于实施完整的交易策略。 推荐事项 在真实账户交易前,请先使用模拟账户测试策略。 采用适合您的风险管理策略进行操作。 与其他指标结合使用以优化结果。 技术支持 提供定期更新与完整的技术文档。 技术支持通过MQL5评论区直接提供。 附加信息 所有设置与描述均为英文。 指标以编译文件形式(.EX4或.EX5)提供,并与激活时使
FREE
Pattern Recognition EA
Claudiu-georgian Zavera
Pattern Recognition EA - From Learn to Earn. The market repeats itself. This EA finds every past repeat of the current candle sequence - and lets history vote the direction. ONE SHAPE. EVERY REPEAT IN HISTORY VOTES. The last N candles on your signal timeframe form a shape. The EA scans the history you choose - a fixed number of bars or everything your broker provides - for the SAME shape, and checks what happened next, every single time. Only when enough repeats exist AND a clear majority of t
Blahtech Market Profile MT5
Blahtech Limited
5 (10)
Was: $249  Now: $99   Market Profile defines a number of day types that can help the trader to determine market behaviour. A key feature is the Value Area, representing the range of price action where 70% of trading took place. Understanding the Value Area can give traders valuable insight into market direction and establish the higher odds trade. It is an excellent addition to any system you may be using. Inspired by Jim Dalton’s book “Mind Over Markets”, this indicator is designed to suit the
Kiwi Forex Strength Scanner
- Nguyen Ngoc Diep
5 (1)
Kiwi Forex Strength Scanner Kiwi Forex Strength Scanner MT5 is a free multi-timeframe Forex strength and market-structure indicator designed to help MetaTrader 5 traders quickly identify strong currencies, weak currencies, and higher-quality currency-pair opportunities. Instead of looking at a single indicator or timeframe, Kiwi Forex Strength Scanner combines currency strength, multi-timeframe analysis, trend alignment and higher-timeframe market structure into one easy-to-read dashboard. The o
FREE
Volume flow Profile
Israr Hussain Shah
大师版是一款专业级的分析工具,旨在通过成交量和资金流向的视角来可视化市场结构。与标准的成交量指标不同,该工具直接在图表上显示每日成交量分布,让您准确看到价格发现发生的位置以及“聪明钱”的定位。 此大师版专为清晰度和速度而设计,具有独特的自动主题同步系统,加载后即刻美化您的图表布局。 主要特点: 真实资金流向计算: 超越标准的跳动量。启用“Use Money Flow”时,成交量按价格加权,揭示了特定价格水平的实际资金投入。 价值区域 (VA) 可视化: 自动计算价值区域(默认为成交量的70%)。 VA填充: 为价值区域背景着色,以便即时识别控制区域。 关键水平: 清晰标记控制点 (POC)、价值区域高点 (VAH) 和价值区域低点 (VAL)。 专业标记系统: 扫描概况结构以识别关键交易区域: HVN (高成交量节点): 接受和盘整区域(支撑/阻力)。 LVN (低成交量节点): 拒绝区域或“快速通过”区域。 所有标记均向右绘制延长线,便于监控。 Delta 背离(左侧直方图): 左侧直方图可视化每个级别的买卖压力对比。这有助于识别隐藏的背离——即价格可能上涨,但卖家在这些水平上激进打
PZ Mean Reversion MT5
PZ TRADING SLU
1 (1)
采用专业和量化方法进行均值回归交易的独特指标。它利用了价格以可预测和可衡量的方式转移并返回均值这一事实,这允许明确的进入和退出规则大大优于非量化交易策略。 [ Installation Guide | Update Guide | Troubleshooting | FAQ | All Products ] 清晰的交易信号 非常容易交易 可定制的颜色和尺寸 实现性能统计 优于大多数交易策略 显示合适的止损和止盈水平 它实现了电子邮件/声音/视觉警报 这个怎么运作 该指标从更高的时间范围测量完全可定制的移动平均线的标准偏差,并使用趋势跟踪方法精确地找到交易。交易是通过深入当前图表的价格行为发现的,并在价格返回到平均价格区间时关闭,根据您选择的更高时间范围计算。由于其编码方式,该指标将远离高波动性和强劲趋势市场,并且仅在可预测的情况下进行交易,在可接受的波动性与方向性比率范围内,回归均值是可行的。 指标剖析 绿线是更高时间范围内的移动平均线(也就是平均值) 虚线区域是移动平均线周围的典型价格区间 蓝线是看涨交易的突破价格 红线是看跌交易的突破价格 交易是针对均值进行的,并在典型的价格
VibeFox Volume Profile — 适用于 MetaTrader 5 的 Volume Profile VibeFox Volume Profile 是一套完整的 MetaTrader 5 Volume Profile 工具集。它构建成交量沿价格的水平分布,使您能够立即看到市场在何处投入了最多的活动、在何处交易稀薄,以及哪些价格水平可能充当磁石或屏障。每个剖面都直接绘制在图表上,并通过现代的、由鼠标驱动的面板进行控制——无需翻找菜单,无需附加脚本。 您无需仅凭蜡烛图猜测支撑与阻力,而是与成交量的真实足迹打交道:吸引价格的高成交量节点、价格往往会快速穿过的低成交量空隙,以及大部分交易完成的公允价值区域。 按您所需的方式呈现的 Volume Profile Volume Profile 并非单一的固定剖面。它一次性为您提供 多个相互独立的剖面引擎 ,每个都有自己的范围、放置位置和样式,因此您可以在同一图表上从多个角度研究市场。 From-To ——在两条可拖动的线 From 与 To 之间构建的精确剖面。将这两条线放在任意摆动、区间或新闻尖峰周围,便可读取恰好该区段的分布。R
Helios Pulse
Jonathan Mboya Kinaro
Helios Pulse v1.03 — 实时概率交易面板,专为手动交易者打造 Helios Pulse 彻底改变您解读市场的方式。无需在多个指标窗口之间来回切换、纠结于相互矛盾的信号,您只需看一个清晰的答案:一个实时更新的概率百分比,展示当前市场的方向性偏移,逐笔跳动持续刷新。 这不是又一个信号箭头面板。Helios Pulse 是一个概率引擎,它衡量多个技术维度之间的一致程度,输出一个真正可信赖的确信度评分。您看到的不仅是方向,还有这个方向有多强——以及它正在实时增强还是减弱。 图表上的呈现 一个紧凑的深色主题面板嵌入您的图表,包含两张动态概率卡片——一张代表做多,一张代表做空。随着市场状况变化,卡片颜色强度从暗淡渐变为鲜明,让您在查看数字之前就能获得即时的视觉判断。清晰的判定标签显示当前状态:Strong Buy、Lean Long、Neutral、Lean Short 或 Strong Sell。 动量变化箭头显示概率正在上升还是下降,让您在确信度积聚或消散的瞬间捕捉到变化。峰值追踪功能记录当前交易时段两个方向的最高概率值。 当需要完整的图表视野时,将面板最小化为一条精简的状态
FREE
Mirror Chart MT5
Andrej Hermann
5 (1)
The Mirror Chart MT5 is a overlay indicator specifically designed to project a second financial instrument directly onto the main chart window. This tool is invaluable for traders who rely on correlation analysis, as it visualizes the price movements of two different instruments in real time. Unlike traditional overlays, this indicator utilizes intelligent, dynamic centering and scaling logic. It continuously analyzes the visible price range in the current window for both symbols and calculates
FREE
Candle Perspective Structure Indicator MT5 is a simple indicator that defines and displays the candlestick structure of the market. This indicator will suit both experienced traders and beginners who find it difficult to follow the structure visually. If you want to see more high-quality products or order the development/conversion of your own products, visit my partners' website: 4xDev Get 10% OFF on manual strategies automation services or indicator development/conversion services at 4xDev
FREE
Spike Blast Pro
Israr Hussain Shah
Here   our more valuable tools SMC Trend Trading   ,  Easy SMC Trading  ,  Institutional SMC Architect Volume Analysis Tools  ,  Volume flow Profile  ,  Market volume profile  , FVG with Volume  , Liquidity Heatmap Profile  ,  Volume Spread Analysis Spike Blaster Pro is a next-generation MT5 indicator designed specifically for synthetic markets. It works seamlessly on Boom Index and Weltrade Index , providing traders with sharp, reliable spike detection signals. What makes Spike Blaster Pro po
Smart ATR Grid Pro
Syamsurizal Dimjati
SMART ATR GRID PRO++ – Adaptive Grid Intelligence Suite is a next-generation, institutional-grade grid trading indicator engineered for traders who demand precision, adaptability, and comprehensive market structure analysis. By seamlessly integrating   Adaptive Volatility Grid System ,   KAMA Candle Trend Filtering ,   Multi-Factor Trend Detection (ADX + EMA20/50) ,   Dynamic Heatmap Zone Engine , and   Real-Time Market Regime Classification , this indicator delivers a complete decision-making
Before installing the HeatMap indicator make sure you are using a broker that gives you access to the Depth of market (DOM) !! This indicator creates a heatmap on your chart allowing you to see the buy or sell limit orders easily and in real time. You have the possibility to change the setting and the colors of the HeatMap in order to adapt to all markets and all charts. Here is an example of a setting you can use with the NASDAQ100 on the AMPGlobal broker :  https://www.youtube.com/watch?v=x0Y
Advanced Volume Profile Analysis Tool for MetaTrader 5 The Kecia Volume Profile Order Finder provides traders with volume profile analysis capabilities. This MT5 indicator combines volume profile visualization with statistical calculations to help identify potential trading opportunities and suggests entry, stop loss, and take profit levels based on market structure. Market Profile Visualization Transform your chart with customizable volume profile visualizations: Multiple visualization options
Advanced OrderFlow TPO Delta Monitor v1.30 Advanced OrderFlow TPO Delta Monitor is a professional quantitative trading tool for MetaTrader 5. It integrates Market Profile (TPO), Footprint Volume Clusters (Ask x Bid), Cumulative Volume Delta, and an advanced non-repainting Divergence Engine into a unified chart interface. Engineered with a smart multi-asset auto-detection engine, the indicator automatically calculates optimal price row sizes for Forex majors, JPY pairs, Gold, Cryptocurrencies,
True TrendLines MT5 - Smart Trend Detection & Alerts Overview True TrendLines MT5 is a professional-grade technical analysis tool that automatically identifies and plots high-probability trend lines on your MetaTrader 5 charts. Using a sophisticated swing point detection algorithm, it helps traders visualize key market structure and potential reversal points with precision. Key Features Automatic Trend Line Detection Identifies valid swing highs and lows based on your chosen strength paramet
FREE
Support and Resistance Pro - Professional Trading Tool Professional Daily Price Structure Analysis with Intelligent Notifications A comprehensive trading tool that transforms your chart into an organized workspace by visually mapping the market's daily price structure while keeping you informed of critical price interactions through a sophisticated alert system. Trading key levels that form clusters of confluence is about identifying price areas where multiple independent factors line up, rath
DYJ BoS
Daying Cao
DYJ BoS指标自动识别和标记市场结构转变的基本要素,包括: 结构突破(BoS):当价格出现重大波动,突破之前的结构点时检测到。 它标记了可能的上升趋势线和下降趋势线(UP&DN,也是就不断创新高和创新低),一旦价格突破这些线,标记红色(BEAR)和绿色(BULL)箭头 BoS通常发生在价格决定性地穿过之前价格行动所建立的摆动低点或摆动高点时。当价格高于波动高点或低于波动低点时,它们只是打破了之前形成的市场结构,因此被称为“打破”结构。这通常表明市场情绪和趋势方向的变化,表明现有趋势的延续或新趋势的开始。 通常,为了提高关闭准确性,建议不设置止损和止盈,结束位置一般在相同方向的下一个突破点位置   关闭 ,或者是在反方向的突破点关闭 当您获得某个品种   足够 交易的经验时,你可以使用SL=7*TP的比率, 对于外汇符号,设置TP=500(5美元/最低交易量),SL=3500(35美元 /最低交易量 );单位点数POINTS。 对于 Volatility 75 Index 指数符号,设定TP=500000(5美元 /最低交易量 ),SL=3500000(35美元 /最低交易量 )
Order Blocks Scan MT5
Reza Aghajanpour
5 (1)
**   All Symbols   x   All Time frames   scan just by pressing scanner button ** Discount : Only 4   of 5 copy  is 35$. ***   Contact me  to send you instruction   and add you in "Order Block group" for sharing or seeing experiences with other users. + FREE   Trading Utility MT5 Introduction: The central banks and financial institutions mainly drive the market,   Order block is considered a market behavior that indicates accumulation of orders from banks and institutions, then   the market ten
Advance Demand and Supply

Oyinemomoemi Emeledor
5 (1)
This   Demand & Supply Zone Indicator with Volume Filtering   is a technical analysis tool for MetaTrader that identifies key price zones where buying (demand) or selling (supply) pressure is concentrated. It uses fractals, volume analysis, and price action to detect and highlight these zones on the chart. Key Features: Zone Detection Based on Fractals Identifies demand (support) and supply (resistance) zones using   fractal patterns   (local highs/lows). Zones are formed from   open prices   ar

FREE
Volume Profile for MetaTrader 5 Price movement alone does not explain where the market is actually traded . What matters is where volume is built and how these areas shift over time. This Volume Profile displays the volume distribution directly on the chart , making it clear which price levels were accepted by the market and where rejection occurred. This allows structurally relevant zones to be identified and integrated into individual decision-making processes. The tool is designed for high pe
Quick deals EA
Aleksandr Slavskii
Горячие клавиши плюс клик левой кнопки мыши на графике. Советник открывает сделки, выставляет лимитные и стоповые ордера, удаляет ордера и закрывает позиции, также  делает реверс  открытых позиций, выставляет прописанные в настройках стоп лосс и тейк профит. (реверс только на неттинговых счетах) При запуске советника можно посмотреть подсказку как действует советник при нажатии клавиши + клик на графике. Правее последнего бара, ниже цены Ctrl+ЛКМ  - OpenSell Правее последнего бара, выше цены C
The Dynamic Market Profile allows you to analyze the volume of any specific chart region manually and instantly. No more being restricted to fixed daily or weekly profiles: you choose the exact move, consolidation, or trend leg you want to analyze . The indicator lets you draw up to 5 independent areas at the same time using interactive rectangles . How It Works on a Daily Basis Create the zone: Press keys 1, 2, 3, 4, or 5 on your keyboard (or use the on-screen buttons) to plot a rectangle . A
FREE
Risk Validator
Thiago Chagas Brito
Evaluate operational viability in each timeframe and in any instrument, according to their respective spread and percentage volatility, which are essential for correct risk management in your trades. This indicator is essential for both Day Traders and Swing Traders, as in addition to evaluating operational viability in each timeframe, it is also possible to identify the fair minimum stop for each period and instrument. Example in Swing Trade: your broker charges a spread equivalent to 0.05%
我们的   Basic Support and Resistance   指示器是提高技术分析所需的解决方案。该指标允许您在图表/ MT4版本 功能 斐波那契水平的集成: 可以选择显示斐波那契水平以及支持和阻力水平,我们的指标使您对市场行为和可能的逆转区域有更深入的了解。 性能优化: 只能在每个栏的打开时更新扩展线,我们的指标可确保最佳性能,而无需牺牲支持和阻力级别的准确性。 输入 主设置 Timeframe:   通过此输入,您可以选择在图表上显示较高时间范围的支撑线和阻力线。 Support/Resistance Strength [Number of Bars]:   使用此输入,您可以确定支撑和电阻的强度。数量越高,支持/阻力越强。 Price mode:  此参数允许您选择哪种价格将用于计算支持和电阻水平。它可以是收盘价,最高价格,最低价格等。取决于您的策略和偏好,您可以选择最适合您需求的价格。 显示设置 Display Fibonacci levels:   此参数确定是否将显示斐波那契水平以及图表上的支持和电阻级别。斐波那契水平是技术分析中使用的关键水平,并使用斐
该产品的买家也购买
SMART TREND TRADING SYSTEM — 特别优惠 您的交易系统、自动化 EA,以及配套培训与支持。 以 99 美元购买适用于 MT5 的 Smart Trend Trading System,即可 免费获赠 Smart Universal Expert Advisor ,用于自动执行系统的交易信号。 STTS 将趋势方向、入场和出场信号、反转区域及重要价格水平集中呈现在图表上。您可以根据系统手动交易,也可以连接随附的 EA,按照您选择的设置自动执行交易。 当前 99 美元的价格适用于接下来的 30 次购买。此后,价格将上调至 149 美元。 您的完整产品套装 购买后,您将获得: • 适用于 MT5 的 Smart Trend Trading System。 • Smart Universal Expert Advisor — 免费赠送。 • 完整的 STTS PDF 用户手册。 • STTS 官方在线课程。 • 逐步安装与设置指导。 • 私人客户社区访问权限及支持服务。 您不仅能获得工具,还能按照清晰的步骤学习如何使用它们。 一套系统,四种交易思路 STTS
Trend Sniper X
Sarvarbek Abduvoxobov
4.9 (39)
Trend Sniper X 是一款适用于 MetaTrader 5 的多周期趋势跟踪指标,可帮助交易者清晰精准地识别趋势方向和潜在的反转点。 适用于 MT4: https://www.mql5.com/en/market/product/193245 价格信息: 当前价格为促销价,随着后续更新和新功能的推出,价格可能会有所变动。 赠品优惠: 购买后联系作者,即可免费获取该指标的 Auto-Trade Assistant EA(自动交易助手 EA)。 Code2Profit 频道 通过多时间框架分析掌控市场! 如何使用 Trend Sniper X 最大化您的胜率:核心规则与交易时段技巧 技术规格 平台 MetaTrader 5 指标类型 多时间周期趋势指标 运行时间周期 任何图表时间周期,可独立选择更高的时间周期 (M1–MN1) 主要交易品种 外汇、黄金 (XAUUSD) 及其他差价合约 (CFD) 推荐账户 任何账户类型 可视化 彩色趋势蜡烛 (买入/卖出/微弱/变化) + 买入/卖出箭头 附加模块 交易时段方框 (悉尼、东京、伦敦、纽约) 主要功能 多时间周期趋势分析: 直接在
ARIPoint
Temirlan Kdyrkhan
1 (4)
ARIPoint is a powerful trading companion designed to generate high-probability entry signals with dynamic TP/SL/DP levels based on volatility. Built-in performance tracking shows win/loss stats, PP1/PP2 hits, and success rates all updated live. Key Features: Buy/Sell signals with adaptive volatility bands Real-time TP/SL/DP levels based on ATR Built-in MA Filter with optional ATR/StdDev volatility Performance stats panel (Success, Profit/Loss, PP1/PP2) Alerts via popup, sound, push, or email Cu
SuperScalp Pro
Van Minh Nguyen
4.66 (35)
SuperScalp Pro - Professional Multi-Layer Confluence Scalping System SuperScalp Pro 是一款高级剥头皮交易指标,在经典 Supertrend 的基础上加入了多个智能确认过滤器。它可以帮助您识别概率更高的 Buy/Sell 交易机会,同时显著减少虚假信号。 清晰的 Buy 和 Sell 箭头会直接显示在图表上,基于 ATR 的 Stop Loss 和 Take Profit 水平会实时自动计算。 购买后,请联系我获取设置指导和推荐配置。 使用 SuperScalp Pro Auto Trader 轻松实现信号自动化: [Auto Trader] 下载推荐设置文件: [Set File] 完整文档请参阅产品博客: [User Guide] 加入官方频道获取最新更新: [Official Channel] SuperScalp Pro 如何工作? 只有当多个确认层同时一致时,指标才会生成交易信号(趋势 + 动能 + 成交量 + 波动率)。 您可以手动交易,也可以连接 SuperScalp Pro Auto Tr
Zoryk Gold
Reda El Koutbane
5 (15)
折扣将在 24 小时后结束——下一价格为 69 美元 ZORYK — MetaTrader 5 专用高级 XAUUSD 黄金信号系统 你一定熟悉这种感觉。 你花了很多时间分析黄金,等待合适的入场机会。终于开仓后,价格却立刻朝相反方向移动。你过早平仓、移动止损,或者只犹豫了几秒钟。随后,市场却在没有你的情况下到达了你原本预期的目标。 问题并不总是方向判断错误。 真正的问题是缺乏确定性。 你不知道准确的入场位置在哪里。 你不知道什么时候交易逻辑已经失效。 你不知道应该先锁定较近的利润,还是继续等待更大的行情。 你也不知道当前信号是否足够强,还是自己只是在强行寻找交易机会。 黄金市场变化非常快。一个没有明确计划的好想法,可能在几秒钟内变成错误的交易决定。 ZORYK 正是为了解决这个问题而开发。 什么是 ZORYK ZORYK 是一套完整的 XAUUSD 黄金信号与交易计划系统,专门为 MetaTrader 5  和 M5 时间周期 开发。 它不是一个只显示 BUY 或 SELL 箭头,然后让你独自决定其余所有内容的简单指标。 每个确认后的信号都可以在图表上显示完整的可视化交易计划,包
Neuro Poseidon MT5
Daria Rezueva
4.75 (52)
Neuro Poseidon is a new indicator by Daria Rezueva. It combines precise trading signals with adaptive TP/SL levels - creating best possible trades as a result! Message me and get  Neuro Poseidon Assistant  as a gift to automize your trading process! What makes it stand out? 1. Proven profitability on all assets and timeframes 2. Only confirmed BUY and SELL signals present on the chart 3. Adaptive TP & SL levels generated by the software for each trade 4. Easy to understand - suitable for al
M1 Sniper MT5
Oleg Rodin
5 (7)
M1 SNIPER   是一款易于使用的交易指标系统。它是一个专为 M1 时间框架设计的箭头指标。该指标可以作为独立的系统在 M1 时间框架下进行剥头皮交易,也可以作为您现有交易系统的一部分使用。虽然该交易系统专为 M1 时间框架交易而设计,但它也可以用于其他时间框架。我最初设计此方法是为了交易 XAUUSD 和 BTCUSD。但我发现这种方法在其他市场交易中也同样有用。 指标信号既可以顺势交易,也可以逆势交易。我教授一种特殊的交易技巧,帮助您利用指标信号进行双向交易。该方法基于使用特殊的动态支撑位和阻力位区域。 购买后,您可以立即下载 M1 SNIPER 箭头指标。此外,我还为所有 M1 SNIPER 工具用户免费提供下方屏幕截图所示的 Apollo Dynamic SR 指标!这两个指标的组合可以帮助您更轻松、更准确地利用 M1 时间框架进行交易。 购买后请联系我,免费获取交易提示和奖励指标! 祝您交易成功!
Gann Made Easy MT5
Oleg Rodin
5 (10)
Gann Made Easy   是一个专业且易于使用的外汇交易系统,它基于使用先生理论的最佳交易原则。 W.D.江恩。该指标提供准确的买入和卖出信号,包括止损和获利水平。您甚至可以使用推送通知在旅途中进行交易。 购买后请联系我,即可免费获得交易指导和超棒的额外指标! 您可能已经多次听说过江恩交易方法。通常 Gann 的理论不仅对于新手交易者而且对于那些已经有一定交易经验的人来说都是非常复杂的东西。这是因为江恩的交易方法在理论上并不那么容易应用。我花了几年时间来完善这些知识,并将最好的原则应用到我的外汇指标中。 该指标非常易于应用。您所需要的只是将其附加到您的图表并遵循简单的交易建议。该指标不断进行市场分析工作并寻找交易机会。当它检测到一个好的入口点时,它会为您提供一个箭头信号。该指标还显示止损和获利水平。 换句话说,当您像先生一样进行交易时,该指标会为您提供最佳江恩建议。江恩亲自告诉你此时此刻该做什么。但最好的部分是您不需要了解任何有关江恩交易原则的知识,因为该指标会为您完成整个市场分析工作。
SMC Intraday Formula
VividMind Digital Solutions
5 (25)
让我们先坦诚一点。 没有任何一个指标可以单独让你实现盈利。如果有人告诉你可以,那他是在向你兜售一个梦想。任何显示完美买卖箭头的指标都可以被做得看起来毫无瑕疵——只需要放大历史中的某一段并截取成功交易的截图。我们不会这样做。 SMC Intraday Formula 是一个工具。 它为你读取市场结构,标记出概率最高的价格区域,并用简单直白的语言准确告诉你当前智能资金的行为轨迹。你仍然需要做决定。你仍然需要执行交易。但现在,你是带着精确性执行,而不是靠希望。 我们已经在黄金(XAUUSD)以及主要外汇货币对的日内剥头皮交易中使用该指标将近三年。这是我们在 M1、M5、M15 和 M30 上的日常主力工具。它之所以有效,是因为它不试图预测未来——它展示的是当前正在形成的高概率交易机会,并解释 为什么 。 它与其他所有指标有什么不同? 大多数交易指标只做一件事。移动平均线交叉。振荡指标触及某个水平。出现一个箭头。你进场交易。你亏损。你责怪指标。重复。 SMC Intraday Formula 将多个机构级概念整合为一个统一的市场解读: - 斐波那契共振引擎 不只是普通的斐波那契水平——该指标
GoldenX Entry MT5
VividMind Digital Solutions
5 (16)
GoldenX Entry 是一款用于 MT5 的指标,包含自适应 Smart Entry Trend 算法、信号评分系统、市场状态识别器以及波动率过滤器。每个信号都包含计算得出的入场位、三个止盈位(TP1、TP2、TP3)以及止损位。它基于多个分析层构建,旨在适应不同市场条件,将多层分析系统与内置优化器及统计跟踪系统相结合。该指标基于风险收益比(RR)指标和历史交易行为提供量化分析。 开始使用非常简单——在所选时间周期上运行优化器,然后在图表上开始使用该指标。 核心功能 GoldenX Entry 将信号引擎与内置交易管理及历史统计跟踪整合在同一图表中: - 内置优化器: 优化器可在图表上单击运行。它通过两阶段搜索流程测试200种参数组合——先进行探索,再进行优化——并在完成后自动应用选定配置。结果会按时间周期缓存,因此当返回已优化的周期时,会立即恢复相同设置。 - 黄金品种自动周期识别: 将指标加载到任何 XAUUSD 图表(M1 到月线)。系统会自动识别当前周期并加载对应预设。共包含9个时间周期配置文件,专为黄金在标准周期上优化设计。切换周期时,参数会自动调整。 - 资金参考面
Entry Points Pro for MT5
Yury Orlov
4.52 (151)
传奇回归:Entry Points Pro 10。 这款传奇指标曾 3 年稳居 MQL5 Market 前三,如今全面重启。 数百条热情好评(两个版本合计 589 条),每天有数千名交易者用它交易,演示版下载 31,000+   MT4+MT5  次。 五年来我读过你们的每一条评价——在第 10 版里,我没有给出许诺,而是把答案直接做进了产品。指标作者自 1999 年入市, 珍视诚信、自己的声誉和自己的客户 。 Entry Points Pro 给出的入场信号严格不重绘。 而且这一次不再只是作者的一面之词,而是可验证的事实:确认信号只在 K 线收盘后标出,自动化测试记录到 零重绘 (在 EURUSD、XAUUSD 和 BTCUSD 上共 2,486,568 次不变量检查——0 次违规)。测试方法完全公开——您可以在策略测试器中自行复现。 购买后请务必第一时间给我发私信。 我会发给您 扩展版说明书《交易者圣经》 ——使用本指标交易的完整指南——并告诉您如何免费获得 赠品:市场扫描器 ,它能同时分析多个品种和多个时间周期,并在一个界面上显示 Entry Points Pro 此刻在哪里表现
Unix Scalper
Issam Kassas
4 (4)
UNIX SCALPER — 特别优惠 发现交易形态,看清交易计划,选择执行方式。 以 99 美元购买适用于 MT5 的 UNIX Scalper,即可免费获赠 Smart Universal Expert Advisor,用于自动执行指标的交易信号。 UNIX Scalper 将市场分析、BUY/SELL/WAIT 决策以及 Entry、Stop Loss、TP1 和 TP2 水平集中在一个清晰的面板中。您可以按照交易计划手动交易,也可以连接随附的 EA,按照您选择的设置自动执行交易。 当前 99 美元的价格适用于接下来的 30 次购买。此后,价格将上调至 149 美元。 您的完整产品套装 购买后,您将获得: • 适用于 MT5 的 UNIX Scalper。 • Smart Universal Expert Advisor — 免费赠送。 • 完整的 UNIX Scalper PDF 用户手册。 • UNIX Scalper 官方在线课程。 • 逐步安装与设置指导。 • 私人客户社区访问权限及支持服务。 您不仅能获得工具,还能按照清晰的步骤学习如何使用它们。 看清信号与交
全新王者降临 - 指标 + 订单管理提示(TP1 + TP2 + TP3)+ 可选 Telegram 信号发送器 INCLUDED(免费) (完整交易与信号系统) 我们最强的黄金 EA: Gold Slayer 该指标包含先进的交易策略、可自定义订单管理系统,以及结合 Envelope 扩展的均值回归系统,并通过 RSI 等多重智能确认过滤器进行验证,以捕捉高概率反转入场机会,提供 BUY 与 SELL 信号。 你不仅能够学习如何交易,还能学会如何高效管理多个仓位,并利用之前盈利的持仓来覆盖亏损交易。 专为 M5 周期打造并优化,在 BTCUSD 和 XAUUSD 上表现尤为出色,因为这些市场的流动性能够让信号更加干净、可靠。 该指标会自动生成清晰的多头(Long)与空头(Short)信号,同时基于 ATR 自动计算入场位、止损位和止盈位,让风险管理从一开始就融入系统之中。 多 TP 系统设有三个渐进式目标位,你可以在 TP1 锁定部分利润、在 TP2 继续持仓,并在更大的行情中将仓位持有至 TP3,而这正是平均风险回报比真正开始大放异彩的地方。 默认参数开箱即用,已经针对稳定表现进行
Auto Optimized SpeedAngle 是一款机构级的动量向量化系统,通过持续的前瞻优化(Walk-Forward Optimization, WFO)彻底消除了曲线拟合(curve-fitting)。该指标没有采用在市场 状态转换时容易失效的静态输入参数,而是利用出样外验证(Out-of-Sample, OOS) dynamically 动态重新校准设置,从而确保显示的 信号代表真正的统计优势,而非历史巧合。 核心机构级架构 前瞻优化引擎(Walk-Forward Optimization Engine): 核心算法持续扫描数千种回溯周期(lookback)与阈值组合,严格将数据划分为样本内(in-sample)和样本外(out-of-sample)。只有当参数配置在未知数据环境中证明具备数学优越性时,系统才会对其进行 adoption。 量化目标函数(Quantitative Objective Functions): 优化引擎不一味追求绝对毛利,而是聚焦于机构级的稳定性指标。用户可针对系统质量数(SQN)、期望值(每笔交易的平均 R 倍数)或净 R 值进行优化,从而优
Gold Entry Sniper
Tahir Mehmood
5 (20)
Gold Entry Sniper – 专业多周期ATR黄金交易仪表盘,适合黄金剥头皮与波段交易 Gold Entry Sniper 是一款先进的 MetaTrader 5 指标,旨在为 XAUUSD 及其他品种提供精准的 买/卖信号 。基于 ATR 移动止损逻辑 和 多周期分析仪表盘 ,适合剥头皮交易者与波段交易者,帮助识别 高概率黄金入场点 。 主要功能与优势 多周期信号分析 – 同时显示 M1、M5、M15 趋势方向。 基于ATR的动态止损 – 根据波动性自动调整。 专业图表仪表盘 – 展示信号状态、ATR水平、线性回归中线和交易方向。 清晰买卖标记 – 自动箭头与文字标签提示。 离场提示与交易管理 – 自动检测离场信号锁定利润。 全面自定义 – 调整仪表盘位置、颜色、字体及参数。 专为黄金优化 – 适用于 M1至M15 黄金剥头皮 ,也适合外汇、指数与加密货币。 为什么选择 Gold Entry Sniper? 为追求 快速、精准、可视化交易决策 的交易者打造,ATR 与多周期确认结合,帮助你抓住 最佳黄金入场点
FiboSniper Pro
Van Minh Nguyen
5 (3)
FiboSniper Pro – Multi-Filter Fibonacci System with Auto SL/TP and Control Panel FiboSniper Pro 是一款技术指标,将动态 Fibonacci Envelopes 与多个确认过滤器相结合,以生成经过筛选的 Buy 和 Sell 信号。Fibonacci 水平基于 Moving Average 和 ATR 计算,然后通过 ADX、EMA、RSI、ATR、Volume、Time 和 Candle 结构进行过滤。该指标直接在图表上显示基于 ATR 自动计算的 Stop Loss 和 Take Profit 水平,并提供交互式控制面板,以便快速调整参数。 购买后,请联系我以获取推荐的设置文件和详细使用说明。 使用 Auto Trader X 自动执行 FiboSniper Pro 信号: [Auto Trader X] 用户指南和设置文件: [Click here] 加入官方频道获取最新更新: [Click here] 专为偏好结构化入场和清晰风险管理的交易者设计,适用于 Gold (XAUUSD)、B
Welcome to ENTRY IN THE ZONE AND SMC MULTI TIMEFRAME /  Official Website: https://www.fableedge.net Entry In The Zone and SMC Multi Timeframe is a real-time market analysis tool based on Smart Money Concepts (SMC), designed to analyze market structure, price direction, and key trading zones. It supports both Single-Timeframe Analysis and Multi-Timeframe Analysis, providing a clearer view of the overall market structure across multiple timeframes, with real-time BUY / SELL signals that do not rep
Atomic Analyst MT5
Issam Kassas
4.47 (60)
ATOMIC ANALYST — 特别优惠 您的市场分析工具、自动化 EA,以及配套培训与支持。 以 99 美元购买适用于 MT5 的 Atomic Analyst,即可 免费获赠 Smart Universal Expert Advisor ,用于自动执行指标的交易信号。 Atomic Analyst 将价格行为、趋势方向、入场和出场信号、止损位及多个止盈位集中呈现在图表上。您可以参考其分析手动交易,也可以连接随附的 EA,按照您选择的设置自动执行交易。 当前 99 美元的价格适用于接下来的 30 次购买。此后,价格将上调至 149 美元。 您的完整产品套装 购买后,您将获得: • 适用于 MT5 的 Atomic Analyst。 • Smart Universal Expert Advisor — 免费赠送。 • 完整的 Atomic Analyst PDF 用户手册。 • Atomic Analyst 官方在线课程。 • 逐步安装与设置指导。 • 私人客户社区访问权限及支持服务。 您不仅能获得工具,还能按照清晰的步骤学习如何使用它们。 看清信号,理解交易形态 Atom
Tokyo mt5 Indicator
Vasiliy Strukov
5 (2)
Tokyo Indicator(东京指标)直观地展示了趋势方向、潜在交易信号及市场状况。 其采用颜色编码的阶梯式趋势线,以蓝色标识看涨阶段,以洋红色标识看跌阶段。配套的方向箭头会在趋势发生变化时,标示出潜在的买入与卖出机会。 内置的综合仪表盘将当前信号、市场倾向、动能、波动率及信号质量整合于同一视图中,方便交易者在观察价格走势的同时评估指标数据,无需在不同面板间切换。 凭借清晰的图表显示和简洁的市场概览,Tokyo Indicator 支持以系统化的方式进行趋势分析与交易确认。 适用于任何时间周期及各类交易品种,尤其适合黄金交易。 购买后请立即联系我,以获取专属赠品!您可以免费获得我们的“强力支撑与趋势扫描”(Strong Support and Trend Scanner)指标,请私信我! 设置说明与使用手册请见此处。 请注意:我不会在 Telegram 上出售我的 EA 或特殊参数设置(set files);我的 EA 仅在 Mql5 平台上提供,而参数设置文件仅在我的博客(此处链接)上发布。请务必警惕诈骗,切勿从他人处购买任何参数设置! 设置 ShowHUD —— 在图表上显示
Adaptive Price Action Engine 买指标,免费送EA 自适应多时间框架趋势与K线形态智能分析系统 市场环境始终在变化,不同的市场阶段中,并非所有 Price Action 形态都具有相同的参考价值。 Adaptive Price Action Engine 旨在适应不断变化的市场条件,将 趋势结构、多时间框架分析、K线形态与统计优化 整合到一个统一的分析框架中。 两种自适应模式 Dual Alpha Trend Mode(双 Alpha Trend 模式) 自动搜索适合的 Alpha Trend 参数,并结合低周期与高周期市场结构,使指标能够根据近期市场行为动态调整趋势识别。 Candlestick + Alpha Mode(K线 + Alpha 模式) 将 Alpha Trend 市场状态与 22种多空K线形态 相结合。系统不会简单地对所有形态一视同仁,而是对不同的形态组合进行统计评估,并识别在特定市场环境下表现出更强历史统计特征的配置。 主要功能 趋势参数自动优化 多时间框架市场状态分析 22种多头与空头 Price Action K线形态 对数千种可能
Market Structure Order Block Dashboard MT5 是一款专为希望直接在图表上解读市场结构和主要价格反应区域的交易者设计的MT5指标。它结合了BOS、ChoCH、订单块(Order Blocks)、公允价值缺口(FVG)、流动性、Kill Zones、成交量分布图以及一个紧凑的面板,便于快速分析。 本指标面向使用市场结构、ICT和Smart Money概念作为决策框架的交易者。它可以帮助以更结构化的方式识别趋势延续、可能的反转、价格失衡、流动性目标和关注区域。 面向买家的资源 购买后可通过MQL5私信申请获取完整的PDF使用指南和参数配置建议。通过MQL5私信提供直接技术支持。 1.20版本带来两项重要新增: Pending BOS / Pending ChoCH 检测 和 可拖动面板 (按住面板标题栏即可将其拖动到图表任意位置,不影响图表本身)。当K线收于前一摆动点之外时,Pending Breaks 立即显示待确认的结构突破,无需等待经典的摆动确认。 重要 本产品仅为指标。它不会自动开仓、平仓或管理仓位。它不是EA(智能交易系统)。 主要功能 市场
SMART PRICE ACTION CONCEPTS — 特别优惠 看清结构,识别区域,制定交易计划。 以49美元购买MT5版Smart Price Action Concepts,即可免费获得Smart Universal Expert Advisor。 在一张清晰有序的图表中整合Smart Money Concepts(SMC)、ICT风格分析与价格行为分析。识别市场结构、订单块、流动性参考价位和失衡区域,再通过Smart Panel选择要显示的内容。 当前49美元的价格适用于接下来的30笔购买。之后价格将上调至100美元。 完整套餐 • MT5版Smart Price Action Concepts。 • Smart Universal Expert Advisor — 免费赠品。 • 完整PDF用户手册及官方在线课程。 • 分步骤安装和设置指导。 • 私人客户社区访问权限及支持服务。 工具、培训和清晰的入门指引,均包含在购买中。 更有条理地分析市场 • 市场结构:内部与波段结构、HH/HL/LL/LH、BOS与CHoCH、高周期分析及多周期仪表板。 • 关键区域:内
Power Candles MT5
Daniel Stein
4.58 (12)
Power Candles V3 - 自我优化的强度指标 Power Candles V3 把货币与品种的强度直接转化为图表上可执行的交易方案。指标不再仅根据强度给K线着色,而是在后台持续运行实时自动优化,为您正面对的品种给出最佳 Stop Loss、Take Profit 与信号阈值。一键采用,Entry、Stop Loss、Take Profit 线就以精确价格绘制在图表上,提醒消息中直接包含方向。 本工具是 Stein Investments 生态系统的一部分 - 18+ 款工具,加上 Max,您的一对一 AI 交易导师。  随时在线,深入了解每一款指标,在您需要梳理思路的那一刻就在那里。  立即认识他: https://stein.investments 每根收盘K线运行 3,000+ 次交易模拟。9 种强度状态。2 种策略并行测试。一键采用最优配置。 为什么需要这个 大多数强度指标只给您一个数值,然后留下三个问题:相信哪个阈值、用哪个 Stop Loss、走哪个交易方向。Power Candles V3 在每根收盘K线上自动回答这些问题。结果就是一个完整的交易方案 -
FX Power MT5 NG
Daniel Stein
5 (33)
FX Power:分析货币强度,助您做出更明智的交易决策 概述 FX Power 是一款专业工具,帮助您全面了解主要货币和黄金在任何市场条件下的真实强度。通过识别强势货币用于买入,弱势货币用于卖出, FX Power 简化了交易决策,并帮助您发现高概率的交易机会。不论您是想跟随趋势还是通过极端的 Delta 值预测反转,这款工具都能完美适应您的交易风格。别再盲目交易——用 FX Power 让您的交易更加智慧。 1. 为什么 FX Power 对交易者极具价值 实时货币和黄金强度分析 • FX Power 实时计算并显示主要货币和黄金的相对强度,助您全面了解市场动态。 • 监控领先或落后资产,轻松识别值得交易的货币对。 全面的多时间框架视图 • 跟踪短期、中期和长期时间框架的货币和黄金强度,以便将您的交易策略与市场趋势保持一致。 • 无论是快进快出的短线交易还是更长期的投资策略, FX Power 都能为您提供所需的信息。 Delta 动态分析用于趋势和反转 • 极端 Delta 值常常预示反转机会,而平缓的 Delta 变化则确认趋势延续。 • 使用 Delta 分析,轻
FX Trend MT5 NG
Daniel Stein
5 (6)
FX Trend NG:新一代多市场趋势智能分析工具 概述 FX Trend NG 是一款专业的多时间周期趋势分析与市场监控工具,帮助您在几秒钟内全面了解市场结构。 无需在多个图表之间来回切换,您可以立即看到哪些品种处于趋势中、哪里动能正在减弱,以及哪些时间周期之间存在强烈共振。 限时发布优惠 – 仅需 $30(6个月) 或 $80 终身授权 即可拥有 FX Trend NG 。 已经是 Stein Investments 客户? -> 发送消息 以获取专属客户群访问权限。 需要帮助或安装指导? -> 请访问 Stein Investments 官方页面 。 1. FX Trend NG 的核心优势 三状态趋势逻辑 —— 不只是 Buy 或 Sell • 大多数指标仅显示两种状态:Buy 或 Sell。 • FX Trend NG 增加第三种状态: Fade 。 • Fade 表示趋势强度正在减弱,在完全反转之前提前发出信号。 这种结构化逻辑让您看到趋势变化过程,而不仅仅是简单方向信号。 多时间周期分析(M1 至 MN1) • 从短线交易到中长线交易全面覆盖。 • 快速识别趋势
货币强度向导是一个非常强大的指标,为您提供成功交易的一体化解决方案。该指标使用多个时间范围内所有货币的数据来计算这个或那个外汇对的力量。此数据以易于使用的货币指数和货币电力线的形式表示,您可以使用它们来查看这种或那种货币的力量。 您所需要的只是将指标附加到您要交易的图表上,该指标将向您显示您交易的货币的真实强度。该指标还向您显示买卖量压力的极值,您可以在顺势交易时利用这些压力。该指标还显示了基于斐波那契的可能目标。该指标可用于各种交易时间范围。该指标支持各种货币对的交易。   该指标为您提供所有类型的警报,包括推送通知。 购买后请联系我。我将与您分享我的交易技巧,并免费为您提供丰厚的红利指标! 祝您交易愉快,获利丰厚!
Volatility Master for MetaTrader is a real-time dashboard tool that scans up to  50 symbols  to identify high-volatility , trending markets instantly. With bullish/bearish signals, customizable alerts, and a user-friendly interface, it helps you avoid range-bound conditions and focus on high-probability trades. Clarity leads to confidence. Trade confidently and protect your capital effectively with this powerful dashboard. We don't offer free or bonus indicators in exchange of reviews from you.
M1 Quantum MT5
Hamed Dehgani
4.2 (10)
使用 M1 Quantum 的实盘交易信号 : 信号 (交易由 Quantum Trade Assistant 自动 执行,并作为本产品 免费 提供。) 最新消息: 版本 1.64 已发布。现在所有交易的止损都会设置在相应的支撑位/阻力位之后。Smart Close 功能也进行了改进,以提升此版本 EA 的性能。 自 8 月 9 日起,实盘信号一直运行在版本 1.64 上。 价格计划: 当前价格: $169 (早期用户优惠) 下一阶段计划价格: $189 计划零售价: $299 开发者提示: 购买后请联系我,以获取 最新推荐的参数设置文件(Set File) 、交易建议,以及加入 VIP 支持群组 ,与其他 M1 Quantum 用户交流经验。 常见问题 - 设置文件 - 安装指南 M1 Quantum 是一款专业的 M1 交易系统,提供快速且精准的交易信号,并内置止损(Stop Loss)、止盈(Take Profit)以及智能资金管理功能。 M1 Quantum 包含专业的资金管理系统,通过专注于 连续盈利交易 ,帮助交易者更快地增长账户资金。 M1 Quantum 指标 的主
PZ Trend Trading MT5
PZ TRADING SLU
3.8 (5)
许多盈利交易者不仅知道如何识别市场趋势,而且也能把握趋势建立后的交易机会。 Pz 趋势交易 指标设计用来在趋势行情中尽可能的赚取利润。 已建立的趋势提供了一揽子交易机会,但大多数趋势交易指标完全忽视了它们,让交易者在趋势行情时完全不知道该如何做!一般趋势指标只通知有关的趋势变化,但根本不足以得到卓越的回报. Pz 趋势交易 指标比一般趋势指标显示多达 20 倍的交易 , 因为它注重所谓的市场时机。它不仅显示当前的市场趋势,也有回调,内柱线的突破和调整。它令您在趋势回调之后介入,安全的柱线内突破金字塔加仓,以及发现潜在的反转,和已知的调整。 趋势改变 一个趋势改变在市场方向变化时发生。趋势变化在图表上用带数字的彩色圆圈显示。蓝色 (1) 信号为上涨开始, 而红色 (1) 信号为下跌开始。趋势变化并非评估当前价格动作的结果, 它意味着交易设置是不定时地。如果您正确使用本指标, 在趋势变化时, 您将将已经入场 (参看下面的调整)。 回调 但凡趋势在运动中,行情上下抖动,盈利者收割利润,且其它参与者入场。趋势回调代表好的买入机会,通常是由主力获利离场导致。如果行情在回调后回归上行, 指标将
Scalper Vault   是一个专业的剥头皮系统,为您提供成功剥头皮所需的一切。该指标是一个完整的交易系统,可供外汇和二元期权交易者使用。推荐的时间范围是 M5。 该系统为您提供趋势方向的准确箭头信号。它还为您提供顶部和底部信号以及江恩市场水平。无论您拥有何种交易经验,该系统都易于使用。您只需要遵循简单的规则并每天重复该过程。 建议将此系统用于主要货币对。感谢您的关注! 请注意,该指标在策略测试器中可能无法正常工作。因此,我建议仅在模拟或真实账户的真实交易条件下使用该系统。 指示器提供所有类型的警报,包括推送通知。 购买指标后请与我联系。我将免费与您分享我的个人交易建议和出色的奖励指标! 祝您交易愉快,盈利!
作者的更多信息
The Trade Manager Interface is a free utility designed to simplify manual trading in MetaTrader. MT4 Version Available          Manual       +Free Strategy     Gold Breakout Engine Please leave a review, if you like the trade manager. It allows traders to visualize trades directly on the chart, calculate position size automatically, and manage orders with advanced features such as partial take profits, automatic breakeven, and trailing stops. For more advanced features check out: ManHedger This
FREE
BTC Breakout Engine
Peter Mueller
5 (1)
Watch my video about this EA!  Making an informed decision always pays off! No AI, No Grid, No MartinGale. This is a real Expert Advisor built on top of a real trading strategy: The Breakout of major Support and Resistance Levels.  Please contact me after purchase for the installation & user guidelines.  SET FILES LIVE SIGNAL   Recommended Spread below 20$ The Bitcoin Breakout Engine is a Portfolio of 4 different breakout strategies, all of them are trading Bitcoin. The Strategy has been stres
The   Trade Manager Interface   is a free utility designed to simplify manual trading in MetaTrader. Please leave a review, if you like the trade manager. It allows traders to visualize trades directly on the chart, calculate position size automatically, and manage orders with advanced features such as partial take profits, automatic breakeven, and trailing stops. This tool focuses on risk control and execution precision, making trade management faster and more efficient. For the advanced trade
FREE
Watch my video about this EA, and read the description before purchasing!   Making an informed decision always pays off! No AI, No Quantum, No Grid, No Martingale.   This EA is built around a real trading concept: breakouts of major support and resistance levels.  Contact me after purchase for installation support and user guidelines. SET FILES   Price will increase based on live performance & demand. Live Signal The Gold Breakout Engine is a portfolio of 4 different breakout strategies trading
ManHedger MT5
Peter Mueller
4.83 (6)
THIS EA IS A SEMI-AUTO EA, IT NEEDS USER INPUT. Manual & Test Version Please TEST this product before BUYING  and watch my video about it. The price of the ManHedger will increase to 250$ after 20 copies sold. Contact me for user support or bug reports or if you want the MT4 version! MT4 Version  I do not guarantee any profits or financial success using this EA. With this Expert Advisor, you can: Implement your own Zone Recovery strategy to capitalize on trending markets. Create Grid trading s
The Supply and Demand Zone Indicator is a powerful and easy-to-use tool designed to help traders identify critical supply and demand zones on the chart. These zones can provide valuable insight into potential market reversals, breakouts, and important price levels where buyers or sellers are likely to take control. The best   FREE Trade Manager . If you want to create your own Hedging or Grid strategies without any coding make sure to check out the   ManHedger Key Features: Automatic Zone Detect
FREE
ManHedger MT4
Peter Mueller
5 (2)
THIS EA IS A SEMI-AUTO EA, IT NEEDS USER INPUT. Manual & Test Version Please TEST this product before   BUYING  and watch my video about it. Contact me for user support or bug reports, or if you want the MT5 version! MT5 Version I do not guarantee any profits or financial success using this EA. With this Expert Advisor, you can: Implement your own   Zone Recovery   strategy to capitalize on trending markets. Create   Grid   trading strategies, to profit from ranging markets. Place orders easil
筛选:
Marc Phlippo
18
Marc Phlippo 2026.07.16 04:01 
 

THANK YOU

Peter Mueller
58420
来自开发人员的回复 Peter Mueller 2026.07.16 08:07
you are welcome!
Richdad001
40
Richdad001 2026.04.11 19:03 
 

Helps me to find an edge. Thanks Peter

Peter Mueller
58420
来自开发人员的回复 Peter Mueller 2026.04.11 20:42
I'm glad I could help!
Nickylou Seville
19
Nickylou Seville 2026.02.24 08:47 
 

how to adjust the indicator of buy and sell the arrow down if sell and arrow up if buy? to appear after 1-3 candle?

Peter Mueller
58420
来自开发人员的回复 Peter Mueller 2026.02.24 18:05
Thanks a lot for your review! Currently there is no suxh option sadly
totati
89
totati 2025.11.20 19:29 
 

Very good tool! I mainly deal with automated trading, but I really like using this indicator. It is a great help for me to confirm or deny signals. I mainly work with index CFDs, where it draws very good levels.

Peter Mueller
58420
来自开发人员的回复 Peter Mueller 2026.02.24 18:05
Thanks a lot for your review I really appreciate it
TRDberio21
32
TRDberio21 2025.11.19 17:16 
 

Very good indicator. Areas are well highlighted and correct. Excellent work.

Peter Mueller
58420
来自开发人员的回复 Peter Mueller 2025.11.19 17:34
Thank you very much for your review!
NoksMkhonza
66
NoksMkhonza 2025.10.06 19:36 
 

This is by far the best free indicator I have come across. It improved my algorithm as well as my profits exponentially. Thank you very much for this indicator. I love it.

Peter Mueller
58420
来自开发人员的回复 Peter Mueller 2025.10.07 11:48
I'm glad you liked it and thank you very much for your review, it means a lot to me!
52644376
14
52644376 2025.08.31 10:21 
 

excellent, give you good understanding from where the market taking support and resistance.

Peter Mueller
58420
来自开发人员的回复 Peter Mueller 2025.09.26 15:34
Thanks a lot for your review
Rich8989
1018
Rich8989 2025.08.25 03:53 
 

good indicator. Thanks for sharing

Peter Mueller
58420
来自开发人员的回复 Peter Mueller 2025.09.26 15:34
thank you for taking your time to write a review!
Gellet Manchenella
478
Gellet Manchenella 2025.08.03 05:02 
 

Peter, Excellent and useful indicator. Vertical News lines can also be a great addition. Please consider.

Check your DM, I sent a picture.

Peter Mueller
58420
来自开发人员的回复 Peter Mueller 2025.08.03 09:34
Thanks a lot for your review!
Muhamad Rizal Fahlepi
187
Muhamad Rizal Fahlepi 2025.08.01 17:37 
 

its very usefull peter. thank you

Peter Mueller
58420
来自开发人员的回复 Peter Mueller 2025.08.01 17:59
thanks for the review!
zerolynx
16
zerolynx 2025.07.29 23:52 
 

nice

Peter Mueller
58420
来自开发人员的回复 Peter Mueller 2025.07.31 07:14
thanks for the review
arthur_sp
16
arthur_sp 2025.07.29 02:19 
 

用户没有留下任何评级信息

Kedrov
1301
Kedrov 2025.07.08 19:31 
 

Индикатор понравился! Спасибо автору!

Peter Mueller
58420
来自开发人员的回复 Peter Mueller 2025.07.08 20:30
thanks a lot for the review!
Shainee
56
Shainee 2025.06.26 09:02 
 

Thank you for making this available.

Peter Mueller
58420
来自开发人员的回复 Peter Mueller 2025.07.07 18:28
Thank you for taking your time and writing a review!
KoILudPu
14
KoILudPu 2025.06.26 07:17 
 

用户没有留下任何评级信息

Peter Mueller
58420
来自开发人员的回复 Peter Mueller 2025.07.07 18:28
thanks for the review
Alexandre Dos Santos Antunes
518
Alexandre Dos Santos Antunes 2025.06.23 12:17 
 

OTIMO, ESTOU GOSTANDO MUITO , SUCESSO

Peter Mueller
58420
来自开发人员的回复 Peter Mueller 2025.06.24 19:18
thanks a lot!😁
Lydia Kwarteng
2222
Lydia Kwarteng 2025.06.12 08:00 
 

用户没有留下任何评级信息

Peter Mueller
58420
来自开发人员的回复 Peter Mueller 2025.06.12 12:40
Thank you very much for taking your time and writing a review, I appreciate it.
Benjamin Afedzie
4168
Benjamin Afedzie 2025.06.10 20:51 
 

great product

Peter Mueller
58420
来自开发人员的回复 Peter Mueller 2025.06.12 12:40
I'm glad you liked it and thanks for leaving a review
Jozsef Lakatos
521
Jozsef Lakatos 2025.05.22 20:21 
 

用户没有留下任何评级信息

Peter Mueller
58420
来自开发人员的回复 Peter Mueller 2025.05.24 14:40
Thanks a lot for taking your time and writing a review! It's good to see fellow hungarians giving me feedback.
dani yosef
18
dani yosef 2025.04.16 19:18 
 

Perfect indicator! My only problem is the indicator keeps disappearing when I try to use it on the daily timeframe. It works fine on other timeframes. But when I try to use it on the daily timeframe the indicator removes itself from the chart. I dont know why. Is there any way to fix this? It's kinda frustrating and makes it impossible to use it long term on the daily chart.

Peter Mueller
58420
来自开发人员的回复 Peter Mueller 2025.04.17 20:54
Thanks a lot for taking your time and writing a review! I have never received such complains, but I have to investigate this case further. Please write me a PM here on mql5.
12
回复评论