已发布的产品

如果您经常因为只使用一种指标而亏损交易,那么请尝试此交易工具。 该交易工具使用多个指标。 我经常观察只使用 RSI 指标的交易者。 很多时候,市场超卖但仍然下跌,或者市场超买但仍然上涨。 因此,您需要使用多个指标。 隆重推出新版本 V 3.40 MTF PPAAF:多时间框架精确价格行为箭头过滤。 该交易工具使用各种指标来加强市场走势的方向。
该交易工具中使用的第一个指标是双随机指标。 在这里,我使用两种随机指标,即快速随机指标和慢速随机指标。 在快速随机指标中,有一条快速随机指标主线和一条快速随机指标信号线。 同样,在慢随机指标中,有一条慢随机指标主线和一条慢随机指标信号线。 主线和信号线的交叉/交叉将形成向上和向下箭头。
第二个指标是Double RSI,即快速RSI和慢速RSI。 两者相交将形成一个向上和向下的箭头。
第三个指标是Double CCI,即快速CCI和慢速CCI。 两者相交将形成一个向上和向下的箭头。
第四个指标是双MACD。 与双随机指标类似,这里有快速 MACD 和慢速 MACD。 在快速 MACD 中,有一条快速 MACD 主线和一条快速 MACD
Looking for a trading tool based on the RSI indicator that can display crossovers arrows on all time frames? Introducing trading indicator : All Time Frame Double RSI Model S ready to help you achieve daily profits. This tool is created using the intersection of two RSI (Double RSI) indicator lines: the main RSI and the signal RSI. Using this tool makes it easier to observe the real-time dashboard and intersections of multiple timeframes simultaneously. Viewing both higher and lower timeframes
Looking for a trading tool based on the RSI indicator that can display crossovers arrows on all time frames? Introducing trading indicator : All Time Frame Double RSI Model T ready to help you achieve daily profits. This tool is created using the intersection of two RSI (Double RSI) indicator lines: the main RSI and the signal RSI. Using this tool makes it easier to observe the real-time dashboard and intersections of multiple timeframes simultaneously. Viewing both higher and lower timeframes

Looking for a trading tool based on the Stochastic indicator that can display crossovers arrows on all time frames? Introducing trading indicator : All Time Frame Stochastic Model S ready to help you achieve daily profits. This tool is created using the intersection of two indicator lines of Stochastic : the main Stochastic and the signal Stochastic . Using this tool makes it easier to observe the real-time dashboard and intersections of multiple timeframes simultaneously. Viewing both higher

Looking for a trading tool based on the Stochastic indicator that can display crossovers arrows on all time frames? Introducing trading indicator : All Time Frame Stochastic Model T ready to help you achieve daily profits. This tool is created using the intersection of two indicator lines of Stochastic : the main Stochastic and the signal Stochastic . Using this tool makes it easier to observe the real-time dashboard and intersections of multiple timeframes simultaneously. Viewing both higher

Looking for a trading tool based on the MACD indicator that can display crossovers arrows on all time frames? Introducing trading indicator : All Time Frame MACD Model S ready to help you achieve daily profits. This tool is created using the intersection of two indicator lines of MACD : the main MACD and the signal MACD. Using this tool makes it easier to observe the real-time dashboard and intersections of multiple timeframes simultaneously. Viewing both higher and lower timeframes simultaneou

Looking for a trading tool based on the MACD indicator that can display crossovers arrows on all time frames? Introducing trading indicator : All Time Frame MACD Model T ready to help you achieve daily profits. This tool is created using the intersection of two indicator lines of MACD : the main MACD and the signal MACD. Using this tool makes it easier to observe the real-time dashboard and intersections of multiple timeframes simultaneously. Viewing both higher and lower timeframes simultaneou

Looking for a trading tool based on the CCI indicator that can display crossovers arrows on all time frames? Introducing trading indicator : All Time Frame Double CCI Model S ready to help you achieve daily profits. This tool is created using the intersection of two CCI (Double CCI) indicator lines: the main CCI and the signal CCI. Using this tool makes it easier to observe the real-time dashboard and intersections of multiple timeframes simultaneously. Viewing both higher and lower timeframes
Looking for a trading tool based on the CCI indicator that can display crossovers arrows on all time frames? Introducing trading indicator : All Time Frame Double CCI Model T ready to help you achieve daily profits. This tool is created using the intersection of two CCI (Double CCI) indicator lines: the main CCI and the signal CCI. Using this tool makes it easier to observe the real-time dashboard and intersections of multiple timeframes simultaneously. Viewing both higher and lower timeframes
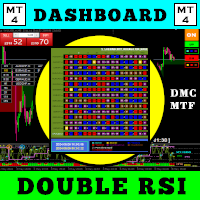
使用此交易工具,您可以同时扫描 15 个市场。
介绍新的交易指标 2024:
️ 仪表板多货币多时间框架双 RSI。
我创建这个交易工具至少有两个原因:
首先,我厌倦了只观察一个市场。 其次,我不想失去进入另一个市场的机会。
这就是为什么我想同时了解其他市场状况。
因此,我需要一台可以同时扫描多个市场状况的扫描仪。
我经常寻找快速 RSI 线 >(或 <=)慢速 RSI 线从 M1 到 H4(或只是 M1 到 M30)的市场。
我还经常寻找从 M1 到 M30 超卖/超买的市场。
如果您同意我的分析,那么这就是您一直在寻找的交易指标。
不要错过市场状况满足上述要求的时刻。
这是一个随机扫描仪或仪表板,具有许多出色的功能:
可以显示快速RSI线的数据 可以显示慢速RSI线的数据 可以显示快速RSI线和慢速RSI线的位置(快线在慢线上方或快线在慢线下方) 可以显示快速RSI线和慢速RSI线的数据水平(看涨、看跌、趋势向上、趋势向下、超买但仍向上和超卖但仍向下) 可显示从M1到MN1的实时数据 可显示15种货币对的数据(多币种外汇/商品/加密货币/股票) 可定制参
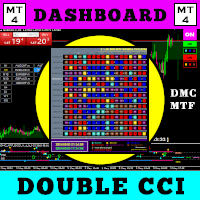
使用此交易工具,您可以同時掃描 15 個市場。
介紹新的交易指標 2024:
️ 儀表板多貨幣多時間框架雙 CCI。
我創建這個交易工具至少有兩個原因:
首先,我厭倦了只觀察一個市場。 其次,我不想失去進入另一個市場的機會。
這就是為什麼我想同時了解其他市場狀況。
因此,我需要一台可以同時掃描多個市場狀況的掃描器。
我經常尋找快速 CCI 線 >(或 <=)慢速 CCI 線從 M1 到 H4(或只是 M1 到 M30)的市場。
如果您同意我的分析,那麼這就是您一直在尋找的交易指標。
不要錯過市場狀況滿足上述要求的時刻。
這是一個隨機掃描器或儀表板,具有許多出色的功能:
可顯示快速CCI線數據 可顯示慢速CCI線數據 可顯示快CCI線和慢CCI線的位置(快線在慢線上方或快線在慢線下方) 可顯示快速CCI線和慢速CCI線的數據水準(看漲、看跌、趨勢向上、趨勢向下、超買但仍向上、超賣但仍向下) 可顯示從M1到MN1的即時數據 可顯示15種貨幣對的資料(多幣種外匯/商品/加密貨幣/股票) 可自訂參數 可自訂顏色 OBOS 級別 漂亮的20儀表板配色方案 配備開/關貨幣

使用此交易工具,您可以同时扫描 15 个市场。
介绍新的交易指标 2024:
️ 仪表板多货币多时间框架随机。
我创建这个交易工具至少有两个原因:
首先,我厌倦了只观察一个市场。 其次,我不想失去进入另一个市场的时机。
这就是为什么我想同时了解其他市场状况。
因此,我需要一台可以同时扫描多个市场状况的扫描仪。
我经常寻找随机主线>(或<=)随机信号线从M1到H4(或只是M1到M30)的市场。
如果您同意我的分析,那么这就是您一直在寻找的交易指标。
不要错过市场状况满足上述要求的时刻。
这是一个随机扫描仪或仪表板,具有许多出色的功能:
可显示随机主线数据 可显示随机信号线数据 可以显示随机主线和信号线的位置(信号线上方主线或信号线下方主线) 可以显示随机主线和信号线的数据水平(看涨、看跌、趋势向上、趋势向下、超买但仍向上、超卖但仍向下) 可显示从M1到MN1的实时数据 可显示15种货币对的数据(多币种外汇/商品/加密货币/股票) 可定制参数 可定制颜色 OBOS 级别 漂亮的20仪表板配色方案 配备开/关货币对转换器 配备蜡烛高时间框架 配备时间点差利润信息 配

交易者您好。
介绍我最好的交易工具。
MTF PPAAF T 型。
多时间范围精确价格行为箭头过滤模型 T。
这个交易工具是我多年来制作各种交易工具后最好的作品。
为什么这个交易工具是最好、最可靠的?
1. 该工具使用6个指标:
双倍 CCI = 快 CCI x 慢 CCI 双随机 = 快随机(快随机主线 x 快随机信号线)& 慢随机(慢随机主线 x 慢随机信号线) 双MACD=快速MACD(快速MACD主线x快速MACD信号线)&慢速MACD(慢速MACD主线x慢速MACD信号线) 六条移动平均线 = MA 1 x MA 2 、MA 3 x MA 4 和 MA 5 x MA 6 Dual Double RSI = 快速 DRSI(快速 DRSI 主线 x 快速 DRSI 信号线)& 慢速 DRSI(慢速 DRSI 主线 x 慢速 DRSI 信号线) RSIMA = RSI x MA
2. 实时9TF仪表板监控(第一个仪表板)。
该仪表板将为您提供有关上述 6 个指标数据的实时信息。 主线是在信号线之上还是之下。 是正向上升还
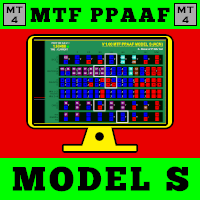
Introducing the advanced trading tools of 2023. MTF PPAAF Model S. This is sub window version of my best trading tool : MTF Precise Price Action Arrow Filtered. Click here to learn more about MTF PPAAF . This trading tool is equipped with various powerful features : MTF = Multi Time Frame = Time Frame can be changed. On/off button. Non Repaint Arrows. Customizable parameter, color etc. Can show all time frame (ATF) crossover arrows of fast stochastic main line & fast stochastic signal line (
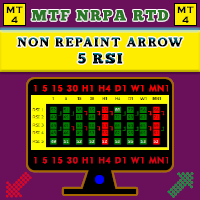
[V 1.00] MTF NRPA 5 RSI RTD 已发布!
非重绘箭头实时仪表板。
如果您厌倦了使用各种 RSI 指标但发现它们不准确,那么试试这个工具。 通常人们只设置 1 个 RSI 来确定一个时间范围内的 OBOS 水平。 坏消息是您无法同时看到不同时间范围内的 OBOS 水平和趋势。 这就是我开发此交易工具的原因。
解释如下:
在这个交易工具上,我使用了五个 RSI。 是的,五个! 默认情况下,我在较大的时间范围内设置 RSI 1 和 RSI 2,即 M30。 RSI 1 和 RSI 2 的交集意味着 M30 时间框架上有趋势变化。 然后我在当前(小)时间范围内设置 RSI 3 和 RSI 4,例如您在 M5 上打开图表。 RSI 3 和 RSI 4 的交集意味着当前时间帧 (M5) 有趋势变化。 然后为了确保趋势运动,我在更高的时间框架 (H1) 上设置了 RSI 5。 当 RSI 5 越过 50 水平(您可以设置时间范围和 OBOS 水平)时,箭头将出现。
这个交易工具有很多令人惊奇的东西:
您可以根据自己的意愿更改五个 RSI 时间范围。 您可以更改线
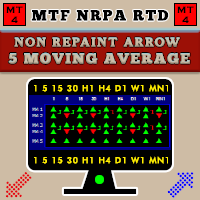
[V 1.00] MTF NRPA 5 移动平均 RTD 已发布!
非重绘箭头实时仪表板。
如果您正在寻找最好的移动平均线指标,那么您来对地方了。 通常人们会设置两条移动平均线,因为两条移动平均线的交点(交叉)将决定下一个价格趋势的方向。 如果快速移动平均线与慢速移动平均线相交且快 > 慢则趋势向上。 相反,如果快速移动平均线与慢速移动平均线相交且快 < 慢,则趋势向下。 两条均线的缺点是看不到长期趋势。 这就是我开发此交易工具的原因。
解释如下:
在这个交易工具中,我使用了五个移动平均线。 是的,五个! 默认情况下,我将 MA 1 和 MA 2 设置在较大的时间范围内,即 H1。 MA 1 和 MA 2 的交集意味着 H1 时间帧上有趋势变化。 然后 MA 3 和 MA 4 我在当前时间范围(小)上设置,例如,您在 M5 上打开图表。 MA 3 和 MA 4 的交叉点表示当前时间范围 (M5) 有趋势变化。 然后为了确认趋势运动,我在当前时间范围内设置了 MA 5。
这个交易工具有很多令人惊奇的东西:
您可以根据自己的喜好更改五个 MA 的时间范围。 您可以更改线条样式
Looking for a trading tool based on the moving average indicator that can display crossovers arrows on all time frames? Introducing trading indicator : All Time Frame Two MA Model T ready to help you achieve daily profits. This tool is created using the intersection of two moving average indicator lines: the main MA1 and the signal MA2. Using this tool makes it easier to observe the real-time dashboard and intersections of multiple timeframes simultaneously. Viewing both higher and lower timef

Looking for a trading tool based on the moving average indicator that can display crossovers arrows on all time frames? Introducing trading indicator : All Time Frame Two MA Model S ready to help you achieve daily profits. This tool is created using the intersection of two moving average indicator lines: the main MA1 and the signal MA2. Using this tool makes it easier to observe the real-time dashboard and intersections of multiple timeframes simultaneously. Viewing both higher and lower timefr