Dashboard Trend Bar Smart Level 9TF Dual MACD
- 指标
- Anon Candra N
- 版本: 1.0
- 激活: 15
提供准确的 MACD 指标。
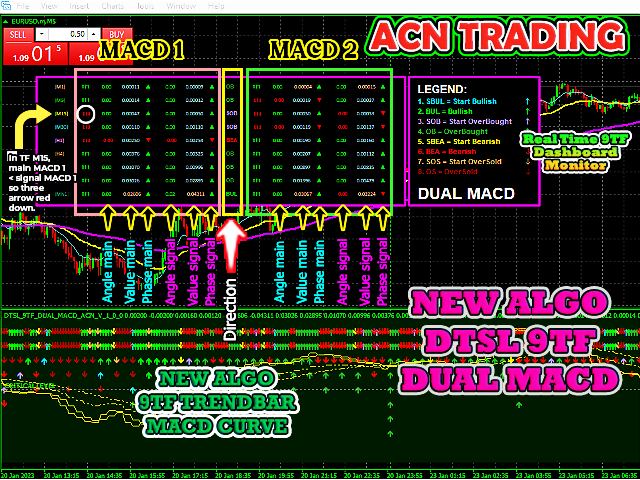
仪表盘趋势栏智能级别 9TF 双 MACD。
双 MACD,即快速 (MACD 1) 和慢速 (MACD 2)
为什么需要第二个 MACD? 使用额外的指标将使我们在实时交易中更有说服力
9TF 快速 MACD 1 曲线
9TF 慢 MACD 2 曲线
9TF实时MACD角度
9TF实时MACD值
9TF 实时 MACD 方向提供准确的 MACD 指标。
仪表盘趋势栏智能级别 9TF 双 MACD。
双 MACD,即快速 (MACD 1) 和慢速 (MACD 2)
为什么需要第二个 MACD? 使用额外的指标将使我们在实时交易中更有说服力
9TF 快速 MACD 1 曲线
9TF 慢 MACD 2 曲线
9TF实时MACD角度
9TF实时MACD值
9TF实时MACD方向/相位
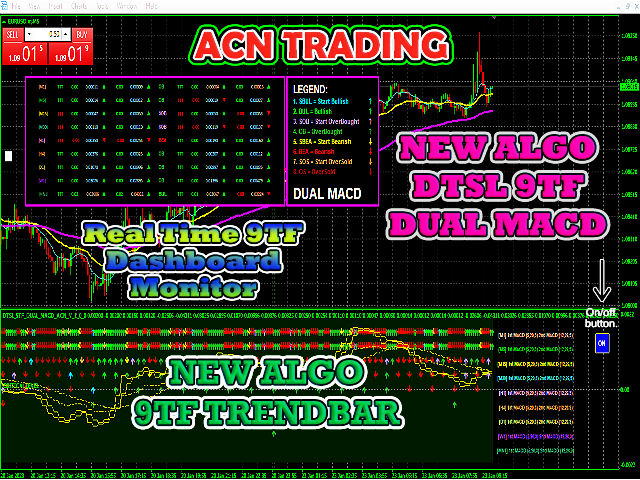
9TF 趋势栏
计算趋势条的新算法
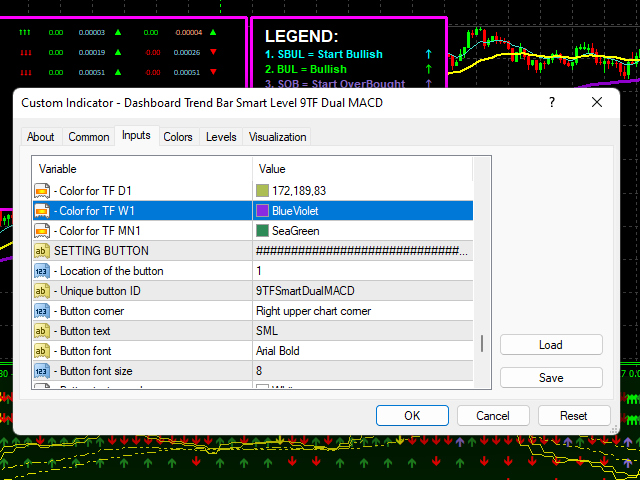
开/关按钮。 只需单击一下即可显示/隐藏指标非常有用
实时 9TF 仪表板监视器
只能显示趋势栏
只能显示 MACD 曲线
只能显示仪表板
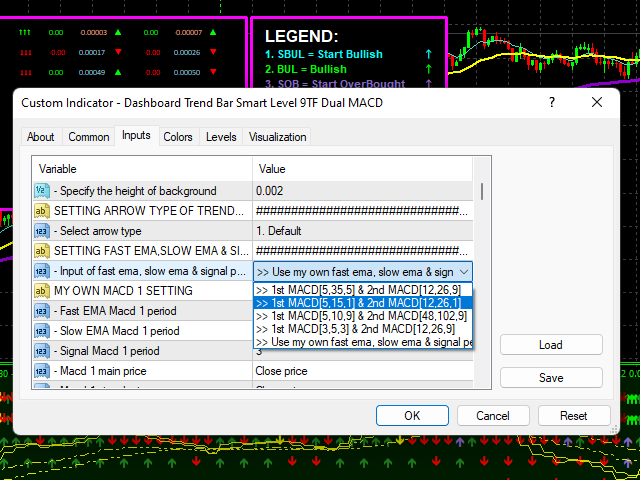
能够选择要显示的 MACD 曲线
能够选择趋势的箭头类型
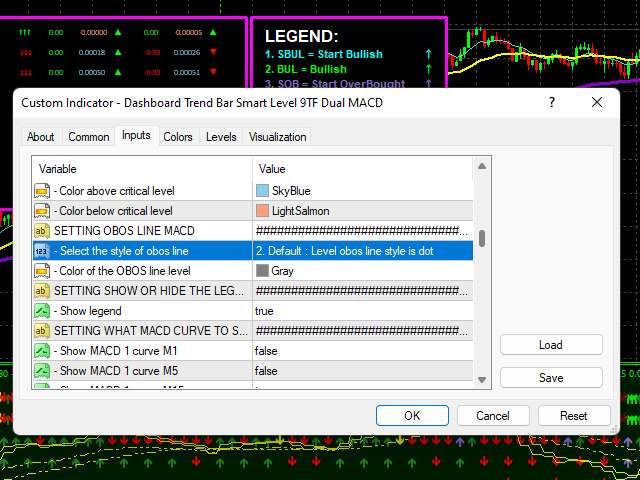
能够选择 obos 线条样式
能够显示/隐藏图例
能够增加/减少栏的数量
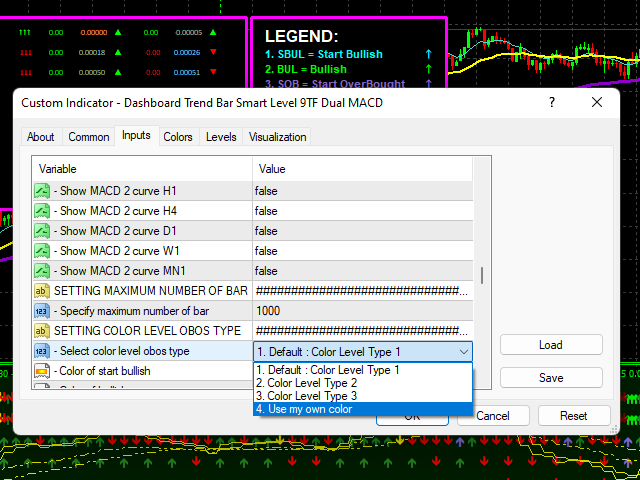
能够选择配色方案级别
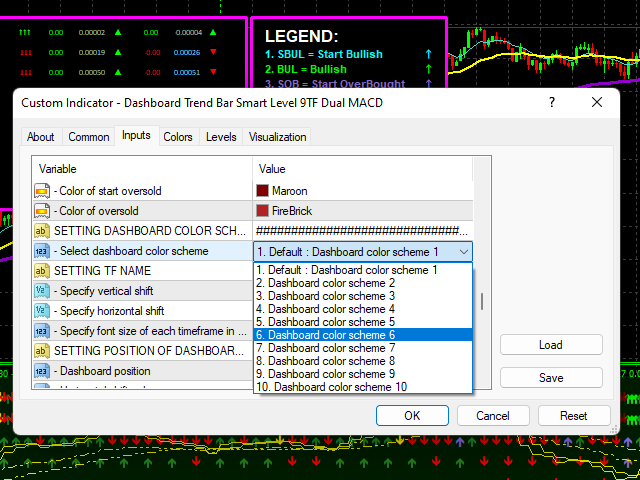
能够选择多达 10 种仪表板趋势栏配色方案
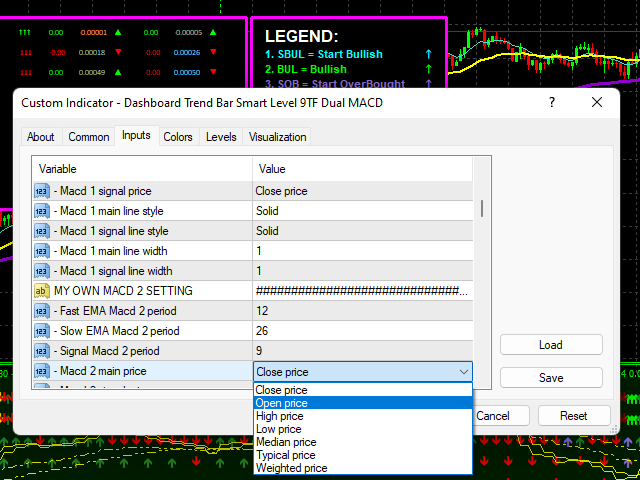
能够改变 MACD 曲线的颜色
该指标经历了一系列的试验。 编程代码是用心编写的。
使用最好的 DTSL 9TF 双 MACD 交易指标进行自信的入场。
立即获取并像专业人士一样进行交易。
谢谢你。