适用于MetaTrader 5的技术指标 - 36

Astral Pulse Oscillator — The Celestial Flow & Energy Resonance Tool Step into the mystic rhythm of market energy with the Astral Pulse Oscillator , a non-repainting fusion of celestial flow mapping and harmonic pulse resonance . This indicator translates hidden energetic fluctuations into radiant visual waves, allowing traders to interpret the unseen emotional tide that moves price — from euphoric expansions to ethereal contractions. Within its luminous subwindow, two astral forces dance: Ce

The DailyWeeklyMarkers indicator helps traders visualize trading weeks by clearly marking the start of each day and week on the chart. It draws vertical separator lines for each day (including weekends if enabled) and highlights the beginning of new trading weeks with double lines for better clarity. This makes it easier to analyze price action within daily and weekly contexts. Who Is This Indicator For? Swing Traders – Helps identify weekly opening gaps and key levels. Day Traders – Vis
FREE

Trend Reversal Candles is an indicator designed to highlight common candlestick reversal and continuation patterns directly on the chart.
It marks detected setups with arrows and labels for easier visual recognition, reducing the need for manual pattern searching. Detected Patterns Bullish and Bearish Engulfing Hammer and Hanging Man Shooting Star Doji variations Other widely used reversal setups Features Displays arrows and pattern names on the chart Works on any symbol (Forex, Gold, Indices, C
这 FVG 区域指标 MT5 是一款功能强大的工具,旨在识别市场中的公允价值差距 (FVG),突出公允价值与市场价格之间的价格不平衡。这种对差距的精确识别使交易者能够发现潜在的市场进入和退出点,从而大大提高他们做出明智交易决策的能力。 FVG 区域指标具有直观且用户友好的界面,可自动扫描图表以查找公允价值缺口,并在价格图表上实时标记这些区域。这使交易者能够快速轻松地识别可能预示即将出现价格调整或趋势延续的潜在价格不平衡。 主要特点包括: 实时间隙检测: 自动识别并标记出现的 FVG。 显示间隙大小(点数): 该指标以点数显示每个已识别差距的大小,帮助交易者了解差距的重要性。 与当前价格的点差: 立即计算并显示当前价格与已确定的公平价值差距有多少点。 清晰的可视化: 视觉上不同的 FVG 区域采用颜色编码以便快速参考,帮助交易者专注于关键市场区域。 无论您是经验丰富的交易员还是技术分析新手, FVG 区域指标 提供有关市场价格不平衡的重要见解,帮助您准确、自信地完善交易策略。
参数 间隙参数 间隙填充检测百分比 -
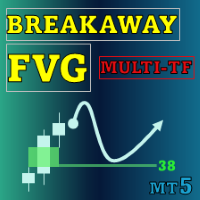
Special offer : ALL TOOLS , just $35 each! New tools will be $30 for the first week or the first 3 purchases ! Trading Tools Channel on MQL5 : Join my MQL5 channel to update the latest news from me Breakaway Fair Value Gaps (FVG) 工具是一种尖端的解决方案,旨在帮助交易者识别价格从平衡中突破的区域,并提供有关修正概率的深入见解。该工具不仅突出关键信号,还包括高级功能以提高决策的准确性。 查看 MT4 版本: Breakaway Fair Value Gaps MT4 查看更多产品: 所有 产品 Breakaway FVG 的关键特点 1. 什么是 Breakaway Fair Value Gap? 定义:
Breakaway FVG 是在价格突破近期历史新 高 或新 低 点时形成的区域。这些区域表明市场的强劲动量,因为买家或卖

KT Psar Arrows使用标准的抛物线转向指标(Parabolic SAR)在图表上绘制箭头。当蜡烛的最高点触及SAR时绘制看涨箭头;当蜡烛的最低点触及SAR时绘制看跌箭头。信号在实时生成,无需等待K线收盘。
特点
对于想要基于抛物线SAR指标开发交易策略的交易者来说,这是一个非常有用的工具。 可以用于寻找市场中的转折点。 支持自定义PSAR参数输入。 提供所有MT4的提醒功能。
注意事项:抛物线SAR是一个滞后且严格机械化的指标。每一笔潜在交易都应该通过明确定义的规则进行筛选。
输入参数 PSAR步长:输入步长值。 PSAR最大值:输入最大值。 显示PSAR点:显示/隐藏PSAR点。即使不显示PSAR点,箭头功能也能正常工作。 其余输入项均为直观设置,无需特别说明。
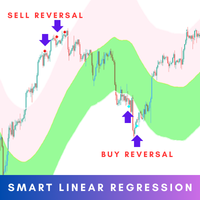
The Smart Linear Regression indicator is a powerful, non-repainting tool designed for traders looking for enhanced accuracy in market analysis. Unlike the typical linear regression channels that often repaint, this indicator provides reliable insights without changing past values, making it more trustworthy for forecasting future price movements. MT4 Version - https://www.mql5.com/en/market/product/124893/ Overview: The Smart Linear Regression Indicator goes beyond the basic linear regr

KT MACD 背离指标显示价格与振荡器之间的常规背离和隐藏背离。如果你的交易策略是基于趋势反转,可以使用 MACD 的常规背离来捕捉潜在的转折点。而如果你的策略是基于趋势延续,MACD 的隐藏背离将是一个不错的选择。
KT MACD 背离的局限性
将 MACD 背离作为单独的入场信号可能存在一定风险。并非所有的背离都能解释为反转信号。为了获得更好的效果,建议将其与价格行为分析和其他交易方法结合使用。
功能特点
标记价格与振荡器之间的常规和隐藏背离。 为提高准确率并减少图表杂乱,会自动忽略不对称的背离。 支持趋势反转和趋势延续两种交易策略。 完全支持嵌入到智能交易系统中使用。 可用于入场信号和出场信号。 支持所有 MetaTrader 警报功能。
什么是背离? 一般来说,如果价格创出更高高点,那么振荡器也应创出更高高点;如果价格创出更低低点,那么振荡器也应同步走低。当这种正常的行为没有出现时,就表示价格和振荡器之间出现了背离。背离主要分为两种类型:
常规背离
常规看涨背离:当价格创出更低低点,但振荡器却创出更高低点。 常规看跌背离:当价格创出更高高点,但振荡器却创出更低高点。
100PIPSsignals — 黄金 (M1) 快速 EMA 交叉系统 一款轻量级 EMA 交叉指标,专为 1 分钟图上的黄金差价合约设计。它用清晰的箭头和金色圆圈标记低风险入场点,通过可配置的最低点差目标来验证走势,并可发送警报/通知。
工作原理(简单) 该指标使用两条指数移动平均线(快速 EMA 和中速 EMA)。
当快速 EMA 向上穿越中速 EMA 时,会出现买入信号箭头;当快速 EMA 向下穿越中速 EMA 时,会出现卖出箭头。
下一个柱状图的开盘价会显示一个金色圆圈,指示实际建议的入场价格。
该指标通过检查入场后的价格走势来验证每个信号:在有效期内未达到可配置的最低点差目标的信号将被移除。已验证的交易会在图表上标注点差收益。
将其用于 XAU(黄金)差价合约 (CFD),1 分钟时间周期,并在交易前通过检查更高时间周期来确认信号。 主要特点 专为黄金(CFD/金属)设计 — 针对 1 分钟时间周期进行了优化。
信号由快速 EMA / 中速 EMA 交叉生成。
向上箭头 = 买入信号,向下箭头 = 卖出信号。
金色圆圈标记实际入场点(下一个开启的柱线)。

交易助手 - 您的得力助手 这款指标旨在 为交易者提供建议和支持 ,实时提供市场量化分析。它不是一个自动决策工具,而是一个 智能助手 ,提供: 市场诊断 (上涨/下跌趋势、盘整、波动性) 一般建议 (何时买入、卖出或观望) 建议的风险管理 (基于ATR的止损和止盈) 心理学建议 以保持交易纪律 它非常适合那些寻求**“第二双眼睛”**来帮助验证他们的想法或提醒重要交易方面的交易者。 用户手册 可配置参数 1. 通用参数 分析时间周期 (Timeframe for analysis): 用于分析的时间周期(默认为当前图表的时间周期)。 推荐: 使用您进行交易的相同时间周期(H1、M15等)。 显示面板 (Show Panel): 启用/禁用可视化面板。 ATR周期 (ATR Period): 用于计算波动性和管理风险的ATR周期。 推荐: 14(标准)或20(适用于较大时间周期)。 2. 详细级别 详细级别 (NivelDetalle): 基本级别 (NIVEL_BASICO): 仅显示市场状态和主要建议。 中级级别 (NIVEL_INTERMEDIO): 添加关键指标(斜率、波动性、S
FREE

This indicator calculates the difference between the SELL aggression and the BUY aggression that occurred in each Candle, plotting the balance of each one graphically. Note: This indicator DOES NOT WORK for Brokers and/or Markets WITHOUT the type of aggression (BUY or SELL).
Be sure to try our Professional version with configurable features and alerts: Delta Agression Volume PRO
Settings
Aggression by volume (Real Volume) or by number of trades (Tick Volume) Start of the Aggression Delta
FREE
描述
Candlestick Pattern Analyzer 是一款面向离散交易者和系统交易者的高级工具,旨在自动识别主要日式蜡烛图形态,并对其历史表现进行详细的统计分析。
该指标非常适合希望验证图形态实际有效性,并将其与确认筛选(如趋势、关键水平、成交量等)以及明确的风险管理策略结合使用的交易者。 主要功能 自动检测超过 20 种蜡烛图形态(吞没形态、十字星、光头光脚线、锤头、流星、孕线等) 计算每种形态出现后可调节数量的后续 K 线内的平均收益和累计收益 显示检测到的形态总数,以客观评估其出现频率 在图表上通过彩色框和文字标注直观突出每个形态 新图形态出现时实时推送通知和警报 界面完全可定制:选择启用的形态、配色方案、分析周期和数据显示位置 优势
许多交易者对蜡烛图形态的解读依赖直觉和主观判断。Candlestick Pattern Analyzer 提供定量化、可视化的方法,帮助你识别在所选标的或时间框架内真正具有统计优势的图形态。 使用场景 研究具有实际统计优势的蜡烛图形态 构建基于客观数据的交易策略 实时接收可视化信号和交易提醒 重要提示
本工具非自动交易系统,而是
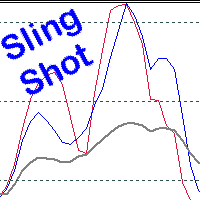
Scalping, Mean reversion or Position trading strategy
Get into an established trend on a pullback in the market. Use the Pinch in the indicator for profit taking. Use the Pinch as a mean reversion strategy, scalping back to a moving average line.
Input Parameters Fast Sling Shot configuration. Slow Sling Shot configuration. Dual Sling Shot configuration. Price line configuration. Trigger zones or levels. Example of Sling Shot trade idea: Price line sets the mood, below the baseline level (50)
MACD-V — Volatility-Normalized Momentum Indicator Inspired by award-winning quantitative trader Alex Spiroglou ,
the MACD-V is a powerful evolution of the classic MACD — delivering a volatility-normalized momentum framework that produces consistent, actionable signals across all securities and timeframes. While the traditional MACD measures the difference between two EMAs, the MACD-V goes a step further by dividing this difference by the market’s volatility (ATR).
This normalization makes the
FREE

The Expert Advisor for this Indicator can be found here: https://www.mql5.com/en/market/product/115564 The Contraction/Expansion Breakout Indicator for MetaTrader 5 (MT5) is a powerful tool designed to identify and signal the breakout of bullish and bearish contraction or expansion formations in financial markets. Utilizing advanced algorithmic calculations, this indicator helps traders spot significant price movements that often accompany these formations, providing valuable insights for stra
FREE

Multset This is inte_plays indicator, which helps the trader to enter the trades appropriately it plots an arrow when there is appropriate environment which permits trading
Features 1. Sends push notification on mobile devices 2. Plots arrow on chart when the setting is found
TimeFrame Is suggested to be used on higher time frames only, especially starting 15min and above for proper moves
For more informations please Visit: https://t.me/Tz_Fx_Lab Subscribe to our Youtube channel: https:
FREE

The Moving Average Slope (MAS) subtracts the moving average level n-periods ago from the current moving average level. This way, the trend of the moving average can be drawn on the moving average line.
Features Observe uptrends and downtrends at a glance. The indicator is non-repainting. Returns buffer values for the trend of the moving average to be used as part of an EA. (see below)
Inputs Moving Average Period : The period of the moving average (MA). Slope Period : Number of periods between
FREE

Range Perfect 指标简介 Range Perfect(RP)是由 MX Robots 开发的专有 MetaTrader 5 指标,专为在区间波动或趋势衰竭阶段交易的用户设计。它能够识别趋势疲劳,并在 XAUUSD、EURUSD、主要外汇货币对、比特币等加密货币及其他高波动性资产上定位高概率反转区域。 与大多数需要多重确认的指标不同,Range Perfect 本身就是一个完整的交易策略。从示例信号和图表中可以看到,RP 能够单独提供高质量的买卖信号,无需与其他指标组合使用。而当它与其他技术工具结合时,整体准确率可提升至 85% 以上。 该指标基于人工智能算法开发,可更精准地识别市场结构、趋势耗尽阶段以及不可见的支撑与阻力区域。 Range Perfect 的独特优势 Range Perfect 结合了高级数学模型与智能市场分析技术,构建出一套强大的信号系统,能够高精度识别价格的转折点。它不仅能够定位潜在的反转区域,还能自动识别肉眼难以察觉的隐形支撑位与阻力位。 MX Robots 表示,RP 是其 AI 引擎开发出的最强定制指标之一。根据其内部为期六个月的测试,该指标单独使
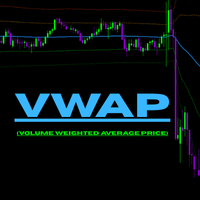
PVWAP Improved MT5 – 高级成交量加权平均价指标 PVWAP Improved MT5 是我个人 VWAP 指标的增强版和优化版。该指标显示成交量加权平均价,并提供多条标准差通道,用于识别潜在的支撑、阻力以及价格动能衰减区域。指标适用于所有周期,并在处理大量历史数据时依然运行流畅。 指标用途 VWAP 表示大量成交发生时的平均价格,是判断市场位置和公平价值的重要参考。 主要用途: 价格高于 VWAP:市场偏多 价格低于 VWAP:市场偏空 标准差通道(+1、+2、-1、-2)显示超买和超卖区域 帮助识别潜在的进场、离场或反弹位置 用于判定市场是趋势运行還是均值回归 该指标非常适合日内交易、剥头皮以及波段交易者,用于分析市场真实压力。 主要特性 使用 MetaTrader 5 的真实成交量進行計算 Daily 模式:每天重置,適合日內交易 Continuous 模式:VWAP 持續計算不中斷 最多 4 條標準差通道:+1、+2、-1、-2 顏色、線型、線寬完全可自定義 支持所有品種和所有周期 計算快速,適合回測和實時交易 指標穩定清晰,易於整合到任何交易策略中

Zigzag Indicator For RSI, To easily identify the highs and lows of the rsi signal. It is easier to observe divergent and convergent signals. Default setting: InpRsi =14 //Rsi Period InpDepth =12; // Depth InpDeviation =5; // Deviation InpBackstep =3; // Back Step
If you want open Exness account try this link : https://one.exness-track.com/a/teg5teg5 Dev buy taphu: Ha Van Tan - hatatrata - Trader's profile - MQL5 community Email: tan.ha@outlook.com
FREE
VWAP Indicator, the short form of Volume Weighted Average Price, is similar to a moving average but takes into consideration the tick volume of the candles. The indicator calculates the moving average multiplying the price of each candle for the tick volume in the candle. Said calculation weighs with more significance price where more transactions were made.
Features: Visual styling customizable Period customizable Ease of use
FREE

The indicator My Big Bars can show bars (candles) of a higher timeframe. If you open an H1 (1 hour) chart, the indicator puts underneath a chart of H3, H4, H6 and so on. The following higher timeframes can be applied: M3, M5, M10, M15, M30, H1, H3, H4, H6, H8, H12, D1, W1 and MN. The indicator chooses only those higher timeframes which are multiple of the current timeframe. If you open an M2 chart (2 minutes), the higher timeframes exclude M3, M5 and M15. There are 2 handy buttons in the lower r
FREE

ATR is a measure of volatility introduced by market technician J. Welles Wilder Jr. in his book, "New Concepts in Technical Trading Systems". In general, traders are accustomed to seeing the ATR in the form of a sub-window indicator. What I am presenting here is a simplified version of ATR - just the current ATR number - very useful for monitoring just the very moment of the current chart. If you want to monitor several timeframes in the same chart, just add the ATR Monitor indicator several tim
FREE

PreCogniTrade : Un Indicador Técnico Avanzado para Predecir el Mercado (Fase Beta) El PreCogniTrade es un indicador técnico revolucionario diseñado para los traders que buscan una ventaja competitiva en los mercados financieros. Este indicador no solo analiza las tendencias actuales, sino que también predice los movimientos futuros de los precios con una precisión asombrosa, lo que lo convierte en una herramienta de incalculable valor para cualquier estrategia de trading. Características Pri
FREE

TrendScanner ALMA — A Lightweight Trend Watcher That Works Silently TrendScanner ALMA quietly monitors the trend status of your selected symbols and timeframes, scanning at regular intervals to detect subtle shifts and notify you—without cluttering your chart. Features ALMA-Based Trend Detection Built on the Arnaud Legoux Moving Average (ALMA), this scanner delivers smooth, responsive trend signals while filtering out market noise. Silent Monitoring of Trend Changes Detects not only uptren
FREE

Trade with Quotes for MT5 Inspirational indicator displaying scrolling trading quotes in English and Vietnamese, with a real-time bar countdown timer. Customizable font, speed, and position. Optimized for all timeframes, lightweight, and MQL5 Market-compliant. Toggle scrolling with Spacebar. Indicator truyền cảm hứng hiển thị quote trading chạy ngang bằng tiếng Anh và Việt, kèm bộ đếm ngược nến theo thời gian thực. Tùy chỉnh font, tốc độ, vị trí. Tối ưu cho mọi khung thời gian, nhẹ, đạt chuẩn MQ
FREE

"We have developed a highly accurate trading signal system applicable to all assets on the 15-minute (M15) timeframe. Calibrated against actual Gold price behavior, this system allows users to trade every candlestick effectively, regardless of market conditions—whether the market is trending, moving sideways, or reversing. The system features real-time arrows and color-coded indicators that signal immediate Buy or Sell entry points. This allows traders to use it as a reliable confirmation tool t
FREE

I present the well-known Moving Average indicator connected to the ATR indicator.
This indicator is presented as a channel, where the upper and lower lines are equidistant from the main line by the value of the ATR indicator.
The indicator is easy to use. The basic settings of the moving average have been saved, plus the settings for the ATR have been added.
Moving Average Parameters:
MA period Shift MA Method
Moving Average Parameters:
ATR TF - from which timeframe the values are taken A
FREE

Introducing the Professional Indicator ARKA – Candle Close Time
Do you want to always know the exact remaining time for the current candle to close? Or do you want to instantly see the real-time broker spread right on your chart without any extra calculations?
The ARKA – Candle Close Time indicator is designed exactly for this purpose: a simple yet extremely powerful tool for traders who value clarity, precision, and speed in their trading.
Key Features:
Displays the exact time re
FREE
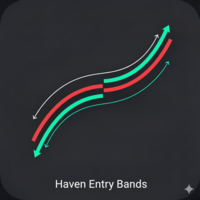
Haven Entry Bands - 您的精准入市导航 隆重推出 Haven Entry Bands – 这不仅仅是图表上的一组线条,而是一个用于识别趋势和寻找高概率入场点的综合系统。该指标基于平滑的价格行为和自适应波动率的组合,使其能够根据斐波那契比率构建动态的支撑和阻力位。 更多产品 -> 点击此处 . 停止猜测在哪里进入市场。Haven Entry Bands能自动判断是多头还是空头在主导市场,并高亮显示开仓的关键区域,从而解放您的时间,让您专注于做出最明智的决策。 核心指标信号 该指标生成三种类型的信号,每种信号都有其特定目的: 入场信号 (Entry Signals) – 当基准线改变方向时,出现在新趋势的最初阶段。这是在新行情启动时 进入市场的首要信号 。 反弹信号 (Bounce Signals) – 当价格回调至中央基准线并从中反弹,延续趋势时出现。这是在小幅回调后 顺势追加入场的理想时机 。 拒绝/止盈信号 (Rejection / TP Signals) – 当价格达到外部的斐波那契水平时触发。这些信号可能预示着当前动能的衰竭,可作为 获利了结(止盈) 或寻找反

This is the MT5 version. Get Dual Onset MT4 here
It is an algorithm to detect trend changes early. You should try multiple values for the Multiplier parameter (1 <value <10 recommended). At first glance you can see effective entries. This is, in fact, one of the rows that Geleg Faktor initially had. But it was removed because it was no longer needed. The other rows were sufficient for G.Faktor's effectiveness, but I still wanted to share this one.
Always test before using it on your live ac
FREE

Introduction MT5 ships with the Envelopes indicator. This indicator allows you to create equidistant bands from a moving average by specifying a “deviation.” Unfortunately, the deviation is an arbitrary number. You might determine that 0.220 works well to contain 95% of close prices for USDCHF,H1, but when you change the period to H4, most of the bars are now outside the bands. So, I created this self-tuning indicator. Instead of specifying a percent “deviation,” you specify the percent of bars
FREE

This LEGIT Indicator Can Accurately Predict the Outcome of One Bar.
Imagine adding more filters to further increase your probability!
Unlike other products, Binary Options PRO can analyze past signals giving you the statistical edge.
How Increase Your Probability
Information revealed here www.mql5.com/en/blogs/post/727038 NOTE: The selection of a Good Broker is important for the overall success in trading Binary Options.
Benefits You Get
Unique algorithm that anticipates price weakness. Gene

As médias coiote automatizam a leitura de analise de médias rápidas e lentas no saldo do volume e preço. Quando as médias estão em modo compra, a coloração do candle fica azul.
Quando as médias estão em modo venda, a coloração do candle fica magenta. Quando a coloração fica verde ou vermelho, temos a tomada das médias no volume mas não no preço, quando isso ocorre é um sinal de atenção.
A concepção do indicador é ser utilizado para operações em saída de consolidações na direção da tendencia do
FREE
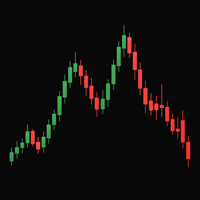
Simple Strategy Indicator The Simple Strategy indicator is a reliable tool for identifying trend direction, leveraging three popular technical indicators: MACD, RSI, and Stochastic. It provides clear trading signals for quick market analysis. Trend Detection Logic Buy signal: MACD above signal line, RSI > 50, Stochastic > 50 Sell signal: MACD below signal line, RSI < 50, Stochastic < 50 Advantages Suitable for various assets: forex, stocks, cryptocurrencies, indices Optimal on daily (D1) timefr
FREE

The indicator plots a curve of the difference between the values of two trading instruments (currency pairs).
The purpose of the indicator is to observe the processes of divergence and convergence of the values of two trading instruments. The results obtained can be used for trading strategies of statistical arbitrage, pair trading, correlation, and others.
Trading strategy
The indicator is attached to the chart of any trading instrument. In the input parameters, the names of trading instr
FREE

VWAP BAR It´s power full indicator of candle by candle when lined up with greate analysis, you have great opportunity, finder defense candle. Is a good ideia from order flow method, now your meta trader 5 inside you time frame chart .
What is the Volume Weighted Average Price (VWAP)?
The volume weighted average price (VWAP) is a trading benchmark used by traders that gives the average price a security has traded at throughout the day, based on both volume and price. It is important be
FREE

“Circle Rising Point” 是一款基于 周期论 的指标,不论您的交易周期是短周期还是长周期,您都可以通过这款指标 寻找不同周期,不同波段的起涨点和起跌点 ,因此在不同周期图表上,展现给您的信号都是不同的,适用于 左侧交易 。 这款指标建议搭配多周期窗口配合使用分析。 指标介绍 适用产品 这款指标适用于任何交易品种, 外汇、加密货币、贵金属、股票、指数。 适用周期 Circle Rising Point 指标适用于所有时间帧 - 从分钟 (M1) 到日线 (D1)。 适用人群 有一定基础的交易者和专家级交易者。
最大盈利潜力
Circle Rising Point指标的入场信号通常出现在不同波段下跌趋势快结束的时候,即使在入场信号出现后继续下跌,也不会有很大的跌幅, 从而最大限度地降低风险,并增加盈利。 多语言支持 指标面板将自动以您的语言显示。 视觉和声音警报 您不会错过信号,因为每个信号都显示在屏幕上,并带有声音通知。 操作便利 您只需要在设置面板根据您的喜欢设置交易信号的颜色即可。
如何使用Circle Rising Point指标进行交易?
订阅并在您的终
FREE

Magnified Price Experience trading like never before with our Magnified Price indicator by BokaroTraderFx , designed exclusively for MetaTrader 5. This revolutionary tool provides traders with instant insights into price movements, offering a clear advantage in today's fast-paced markets.
Key Features: 1. Real-time Precision: Instantly magnify price action to uncover hidden trends and patterns. 2. Enhanced Visibility: Clear visualization of price movements with adjustable zoom levels. 3. User
FREE

Short Market Description (recommended) Market Periods Synchronizer highlights higher-timeframe (HTF) sessions directly on your current chart, so you can trade the lower timeframe with full higher-timeframe context. Draws vertical lines for each HTF bar (e.g., H1 on an M5 chart) Optional body fill (green for bullish, red for bearish) for each HTF candle Optional Open/Close markers with labels to spot key reference levels fast Optional minor-timeframe dividers (e.g., M30 & M15) only inside each
FREE

如果产品有任何问题或者您需要在此产品上添加功能,请联系我 Contact/message me if you encounter any issue using the product or need extra feature to add on the base version.
PA Touching Alert is a tool to free you from watching price to touch certain critical price levels all day alone. With this tool, you can set two price levels: upper price and lower price, which should be greater than/less than the current price respectively. Then once price touches the upper price or lower price, alert and/or notification would be sent
FREE

the AK CAP toolbox free to use;
it includes the same indicators we use for our daily trading and we think the simpler the better. Lightweight indicator for use on all timeframes. that includes VWAP with vwap value indicator on top right. 3 EMA: FAST, MEDIUM, SLOW the candle timer to show how much time left in a candle.
colors and positions are fully customizable.
enjoy
FREE

Certainly! Here's the revised Chinese translation including the information about the indicator not repainting its signals and being resistant to market noise:
介绍 Volatility Doctor RSI,这是一款基于可信赖的RSI指标构建的突破性工具,旨在提升您的交易体验。
我们的指标不仅提供实时的RSI读数,还准确预测了未来10步内RSI读数的位置,适用于您选择的任何时间框架和任何偏好的交易符号。此外,我们强调指标不会重新绘制其信号,确保您获得可靠的交易指导,同时对市场噪音具有很强的抵抗力。
自适应智能:这个智能工具学习并动态调整,无缝融入您独特的交易策略,增强您的决策过程。
立即使用 Volatility Doctor RSI 提升您的交易。
祝您和平、繁荣和交易盈利。
Volatility Doctor.
FREE

For those Price Action traders who love to trade strong Price points, like yesterday's HIGH and LOW, here is an indicator to ease the identification of those values, drawn directly on your chart! MIN/MAX of the Day will automatically draw 2 lines showing you those points for you, AND, if you like any HIGH and LOW in the past, not just yesterday's prices. It can also be configured to additionally show today's HIGH and LOW prices - just configure the refresh rate of those lines at your own taste/s
FREE
XAU Scalper MT5 MT4 版本 一个用于观察黄金货币对短期价格走势的分析工具。 XAU Scalper 指标根据 K 线稳定性、RSI 和短期动量提供买入和卖出信号。它旨在帮助交易者在 XAU 货币对的短暂市场波动期间确定潜在的入场点。 特点 K 线稳定性指数: 衡量 K 线实体与影线的比例,以评估价格行为的可靠性。 RSI 指数: 跟踪相对强弱,指示潜在的超买或超卖情况。 K 线增量长度: 定义分析的近期 K 线数量,以检测方向变化。 信号过滤: 可选择避免重复警报,以便进行集中的图表分析。 警报: 通过弹出窗口、声音、电子邮件和移动警报发送买入和卖出通知。 使用指南 将指标附加到 XAU 货币对并选择所需的时间周期(推荐 m1–m15)。 根据市场波动性调整 K 线稳定性和 RSI 参数。 观察指标信号,并将其与总体趋势分析或支撑/阻力位相结合。 使用适合快节奏交易的短期目标和严格止损。 启用警报,以便在无需持续监控图表的情况下接收通知。 注意 它不需要外部
FREE

StrikeZone Macd Atr is an advanced volatility-adaptive oscillator that scales the traditional MACD using ATR.
This approach solves the common problem of conventional MACD: it does not react properly to changing volatility.
With ATR scaling, momentum becomes clearer, smoother, and more meaningful across all market conditions. Key Features 1. ATR-Scaled MACD Oscillator The indicator adjusts (MACD – Signal) by ATR ratio, allowing: Reduced noise during high-volatility periods Enhanced sensitivity du
FREE
SMA-ATR-Visual Indicator
The SMA-ATR-Visual is a technical analysis indicator designed to assist traders in identifying market trends, measuring volatility, and visualizing potential entry signals on the chart. Main Components Simple Moving Averages (SMAs): The indicator plots two SMAs — a fast SMA (default 9-period) and a slow SMA (default 21-period) — to help detect short and medium term trend direction. ATR-Based Volatility Bands: Upper and lower bands are calculated using the Average True R
FREE

此多指标/振荡器(以下简称指标)、多时间框架和多品种指标可识别价格与一个、两个或三个指标之间何时出现背离。它识别常规/经典(趋势逆转)和隐藏(趋势延续)背离。它具有 RSI 和 MA 趋势过滤器选项,可以仅过滤掉最强的设置。结合您自己的规则和技术,该指标将允许您创建(或增强)您自己的强大系统。 它可以通过 3 种方式使用: 设置主要指标和第二/第三指标,并将默认值“当前”保留为第二时间范围。通过这样做,您只会在您选择的每个时间范围内出现双重背离时收到警报。 设置主要指标和第二/第三指标并将第二/第三背离的时间范围设置为例如 H4,或将“一个时间范围更高”设置为 True。通过这样做,您只会在 H4 时间范围内或高于主要背离的一个时间范围内出现第二/第三个背离时收到警报。 仅设置主要指标。通过这样做,您将在所选指标出现背离时收到警报。 特征
可以检测以下指标的背离:MACD、随机指标、OsMA、RSI、CCI、Awesome (AO)、ADX、ATR、OBV、MFI、动量和综合指数。 可以同时监控您的市场报价窗口中可见的所有交易品种。仅将指标应用于一张图表并立即监控整个市场。 可以监控从
Multi-TF Trend Dashboard Short Description / Slogan: See the entire market trend in a single glance! A simple, clean, and powerful dashboard for every trader. Full Description: (1. For Free Distribution) Hello MQL5 Community, I am excited to share the Multi-TF Trend Dashboard , a tool I developed to simplify trend analysis. This indicator is offered completely free as a contribution to this amazing community. (2. Indicator's Functionality) Are you tired of constantly switching between timeframe
FREE
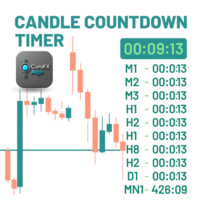
ClaroFxAlgo Candle Countdown Timer – MetaTrader 5 Indicator Overview CandleCountdownTimer is a powerful yet lightweight MT5 indicator that displays dynamic countdowns to the next candle close, helping traders gain precise timing awareness across all timeframes. Its sleek, customizable design ensures critical timing data is visible—without cluttering your charts. Key Features ️ Main Timer Display – Live countdown to the next candle close on current timeframe Multi-Timeframe Panel – View
FREE

Haven QQE PRO - 您在所有时间框架上的趋势可视化指南 隆重推出 Haven QQE PRO – 一款基于QQE算法的实用工具,旨在解决交易者的核心任务:快速识别当前趋势并顺势交易。该指标可同时分析多个时间框架的数据,并清晰地显示市场上是买方还是卖方占主导地位。 其他产品 -> 点击这里 . 无需在图表之间来回切换。所有决策所需的信息都集中在一处。 您会收到哪些信号? 该指标提供三种协同工作的可视化信号: 多时间框架仪表盘
这是您的主要参考。图表角落的面板显示所有重要时间框架(例如M5, M15, H1, H4)的趋势状态( 看涨、看跌、横盘 )。让您能够即时评估整体市场情况。 子窗口中的直方图
显示 您当前 时间框架的动能: 蓝色 — 看涨动能,买方力量更强。 红色 — 看跌动能,卖方力量更强。 黄色 — 横盘。市场犹豫不决,没有明确趋势。 价格图表上的箭头
指示潜在的入场点: 主箭头: 当QQE信号线交叉时出现。表示局部动能变化的信号。 零轴交叉箭头: 当QQE主线穿越零轴时出现。表示动能增强的信号。 如何使用?实用示例 以下是在交易中应用该指标的几种
Swing High & Low Trendline Indicator is a professional tool that automatically identifies swing points on your chart and draws trendlines for easy visualization.
No need to manually scan candles, the indicator highlights key highs and lows based on your chosen settings, helping you analyze market structure and trade with confidence. Features: Automatically detects swing highs & swing lows Draws clean trendlines directly on the chart Works on all symbols (forex, indices, crypto, stocks,
FREE
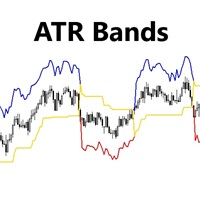
Indicator Shows ATR bands and Trailing Stop Line. Use it in your trend following strategy to improve your stop loss trailing and Trend. Adjust ATR Period and ATR Factor for your Symbol. This indicator has 3 outputs: 0- Upper Channel Data 1- Lower Channel Data 2- Main Line Data Please call me if you need more input parameters or modified version of this indicator.
FREE

For those traders and students who follow the famous brazilian trader Igor Rodrigues (Mago Trader) here it is his famous 2 EMAs - based on Phi ratios - and packed with a twist: a Filling Area , to easily and visually spot the corresponding trend on the chart. You can turn On and Off this filling. If you don't know Igor Rodrigues and you are a brazilian trader and student, just google for him... Very simple and useful indicator.
If you are looking also for the MACD -based indicator of this trade
FREE

ROMAN5 时间突破指标自动绘制日线的支撑和阻力突破箱体。它可帮助用户识别何处进行买入、卖出。当新信号出现时,它可发出提示和声音。它还具有发送邮件功能。您的邮件地址和 SMTP 服务器设置应该在 MetaTrader 5 的 "邮箱" 标栏里的设置窗口里指定。 蓝色向上箭头 = 买。 红色向下箭头 = 卖。 您可以使用一款我的移动止损产品,来自动移动止损,并包括设置盈亏平衡。 ROMAN5 分型移动止损 ROMAN5 抛物线SAR 移动止损 ROMAN5 布林带移动止损 ROMAN5 HeikenAshi 移动止损 ROMAN5 均线移动止损 ROMAN5 高级移动止损 如果您希望尝试 EA, 参见 ROMAN5 时间突破 EA 。 版本 1.2: 发送推送通知至移动终端。
FREE
Rinse and Repeat indicator for 3 day/session/week setups. Check out our other products for fxer.net:
https://www.mql5.com/en/market/product/114888
https://www.mql5.com/en/market/product/114890
Indicator daily features: Daily close/high/low Weekly open/high/low/close Month open/high/low/close Daily breakouts Daily failed breakouts Asia/London/New York sessions Inside days Outside days Green days Red days
Indicator weekly features:
Weekly breakouts Week dividers Indicator other features: Das
FREE

Description The Profit and Loss Indicator by Creative Tech Solutions is a robust and comprehensive tool designed to help traders monitor their trading performance in real-time. This indicator provides detailed metrics on profits and drawdowns, ensuring traders are always informed about their trading activities and performance. With customisable alerts and display settings, this indicator is an essential tool for any serious trader. Features Real-Time Metrics : Monitor profit and drawdown percent
FREE

This is an OLD indicator which was rather efficient to be paired with MA Cross, Bollinger Bands, Dochian Channel and many other strategies and this provides you with market change of BEAR and BULL trends. Since there isn't much listed in MT5 Market, I would like to share my very own indicator for your usage. Please feel free to comment or criticize for better and improvement of the indicator listed.
FREE

The true strength index is a technical indicator used in the analysis of financial markets that attempts to show both trend direction and overbought/oversold conditions. It was first published William Blau in 1991. The indicator uses moving averages of the underlying momentum of a financial instrument. The True Strength Index (TSI) is a momentum oscillator that ranges between limits of -100 and +100 and has a base value of 0.
FREE

FTU 垂直线 此指标会在您选择的时间(分钟或小时)绘制垂直线,以在图表上显示过去和未来的时间。 特点: 多个可调时间 更改线条颜色和数量 用途: 用于研究或衡量特定柱状图收盘价,为未来新闻或小时收盘价等做计划。 在一定范围内更改柱状图颜色和数量。适用于任何时间范围、产品/货币对,无需重绘,快速加载 FTU chuízhí xiàn cǐ zhǐbiāo huì zài nín xuǎnzé de shíjiān (fēnzhōng huò xiǎoshí) huìzhì chuízhí xiàn, yǐ zài túbiǎo shàng xiǎnshì guòqù hé wèilái de shíjiān. Tèdiǎn: Duō gè kě tiáo shíjiān gēnggǎi xiàntiáo yánsè hé shùliàng yòngtú: Yòng yú yánjiū huò héngliáng tèdìng zhùzhuàng tú shōupán jià, wèi wèilái xīnwén huò xiǎoshí shōupán jià děng zuò jìh
FREE

This indicator is stand alone version from MP Pivot Levels (All in one) containing Demark's Pivots.
Calculations: PP = X / 4 R1 = X / 2 - LOWprev S1 = X / 2 - HIGHprev Uses: When the pair currency price may change the direction of movement. Possible constraints of support and resistance that creates plateaus for the currency pair prices. Tendency identification by comparing the present prices according to current day's pivot point and also the prior day's pivot points. ____________
FREE

VWAP RSJ is an indicator that plots the Hourly, Daily, Weekly and Monthly VWAP Lines.
Large institutional buyers and mutual funds use the VWAP ratio to help move into or out of stocks with as small of a market impact as possible. Therefore, when possible, institutions will try to buy below the VWAP, or sell above it. This way their actions push the price back toward the average, instead of away from it. Based on this information I developed this indicator that combines 4 types of VWAP Tim
FREE

MultiVision Dashboard – Monitor Multiple Markets at a Glance.
The MultiVision Dashboard is an advanced, user-friendly MQL5 indicator that allows traders to monitor multiple symbols and timeframes simultaneously in a single, intuitive dashboard. It's designed to simplify market analysis by presenting essential data clearly, helping traders quickly identify opportunities and make better trading decisions.
Key Features
Flexible Symbol & Timeframe Selection
Customize the dashboard with your prefe
FREE

VWAP FanMaster:精准掌握回调策略!
VWAP FanMaster 是专为追求 精准入场点 和 高效回调交易 的交易者打造的终极指标。 它结合了 VWAP(加权平均成交价) 与 斐波那契扇形线 ,清晰标绘出市场中的重要价格区域。 主要特点 简单而强大 :只需移动垂直线,指标将自动绘制 VWAP 和 斐波那契扇形线 。
智能交易策略 :等待价格回到绘制的区域,以捕捉 完美回调 的支撑和阻力点。
高级可视化工具 :快速识别 价格共振区域 ,做出果断的交易决策。 为什么选择 VWAP FanMaster? 易于使用 ,适合新手和资深交易者。
提升交易精度 ,通过结合两种强大的分析工具。
改善风险管理 ,提供清晰一致的价格预测。 优化您的交易策略,用 VWAP FanMaster 轻松掌控市场!
FREE

Maximum Minimum Candle indicator is a basic indicator (but useful) that shows the highest and lowest candle in a period of time .
The indicator shows the maximum candle and the minimum candle for a defined period of time. You can choose the number of candles that make up the period The indicator will show with color points the maximum and minimum values. A message tells you when the price reaches the maximum or minimum.
Parameters number_of_candles: It is the number of candles that will be c
FREE

Purpose DG DayInfo is a free indicator that shows information about: Day's maximum prices; Day's minimum prices; Day's percentual variations; Daily candle direction (Up, Down or Flat); Candle timer; This way, DG DayInfo helps you to see day's maximum and minimum, check day's percentual variation and time left to close candle.
Key features Designed to be simple to use, with a few parameters Works in ALL pairs Works within ALL time frames*
Main Indicator Parameters Days - Set to how many days yo
FREE

The Market Master is a comprehensive, all-in-one trading indicator designed to enhance your trading strategy
Features:
Trend Filter VWAP Break Of Structure patterns Daily, Weekly, Monthly highs/lows Fractals Channels Volume Profile Currency Strength Meter Fair Value Gap News Filter
The idea behind this indicator was to create a trading tool that has everything a trader needs

This project did not reach the basic funding number, so I am abandoning it momentarily. The system is now free for other traders to continue the idea. You can follow my new project through my signals.
A tool for institutional investor, now avaliable for Home users. We equip you like banks equip their analysts!
How it works
Focused on the Forex market, it takes advantage of the need of nations to control the value of their currency and the world exchange variations to analyze, through the pro
FREE

https://www.mql5.com A double moving average indicator This indicator uses the system's own two different time period of moving average indicators to reflect the movement of market prices. It is recommended that you use the default parameter Settings, which you can set according to your own experience to get the best predictive power. I hope it can provide some help for your trading.
FREE
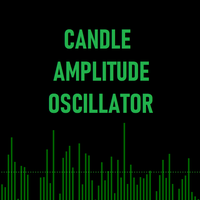
蜡烛振幅振荡器 (Candle Amplitude Oscillator) 使用蜡烛振幅振荡器,清晰洞察市场波动性。这款轻巧高效的工具超越了简单的价格分析,向您展示每根K线内部的“真实能量”,助您做出更明智的交易决策。 您无需再猜测市场是活跃还是平静,这款指标为您提供了一个精确、标准化的波动性度量方式,适用于任何交易品种和任何时间周期。
什么是蜡烛振幅? 蜡烛振幅(Candle Amplitude)衡量的是一根K线从其最高点到最低点的总距离。指标随后巧妙地将此范围转换为一个通用的百分比值。这是一个关键优势,因为它提供了一种标准化的方式来比较完全不同品种之间的波动性——从像EUR/CHF这样波动较小的货币对,到像比特币这样剧烈波动的加密货币。一个2%的振幅无论在哪里都意味着相同的情况。
工作原理 该指标在您的主图表下方的独立窗口中绘制两个元素: 振幅直方图 (The Amplitude Histogram): 直方图中的每一根柱子代表一根价格K线,显示其计算出的振幅百分比。较高的柱形表示波动性更强,而较短的柱形则表示市场处于平静的盘整状态。 动态平均线 (The Dynamic
FREE
MetaTrader市场是您可以下载免费模拟自动交易,用历史数据进行测试和优化的唯一商店。
阅读应用程序的概述和其他客户的评论,直接下载程序到您的程序端并且在购买之前测试一个自动交易。只有在MetaTrader市场可以完全免费测试应用程序。
您错过了交易机会:
- 免费交易应用程序
- 8,000+信号可供复制
- 探索金融市场的经济新闻
注册
登录