Advanced Price Movement Predictor Basic Edition 5
- 指标
- 版本: 3.0
- 更新: 29 十一月 2021

它预测最有可能的短线价格走势,基于先进的数学计算。
功能
- 评估即时价格走势;
- 计算实时市场趋势;
- 计算最重要的支撑和阻力位;
- 算法优化,在进行复杂数学计算时系统资源消耗最小。
- 最佳性能自调整, 所以它可以工作于任何品种 (无论它有多奇葩) 以及任意时间帧;
- 与所有 MetaTrader 平台兼容, 不管报价位数或其它参数;
- 与所有其它工具兼容 (指标, EA 或脚本),不会减缓终端性能和交易操作。
介绍
构建一般交易策略的许多经典指标都基于简单的数学,不是因为创建这些指标时,没有优秀的数学家 (事实上,那时的数学家有可能比现在更好),但因为电脑还不存在,或是它们太简单,持续处理复杂数学操作的能力低下。如今,任何智能手机都完胜几十年前最强大的计算机。所以,处理海量信息的能力如今不再是限制,除了极其复杂的模拟处理。
高级价格走势预测者 (APMP) 指标利用当前处理能力的优势,通过一些最先进的数学、统计和概率的概念,来捕获价格波动的本质。
APMP 不能用来预测它自己,由于价格运动是一种非平稳随机过程,因此,它是不可预测的。但是,它可以对即时的价格走势进行动态的、高可靠的评估。
基于同样的分析, APMP 显示当前实时行情趋势。为何是实时趋势?其它指标得到的不是实时趋势吗?迄今为止,获取趋势信息几乎一直来自经典指标,比如移动均线,布林带或抛物线 SAR,或简单地在两个或多个极点之间手工画线等传统方法 (或两条并行线)。
显然,这些指标和方法仍然有效,尤其是因为它们被大部分交易者使用,且大多获得持续的盈利?我们有他们不具备的直觉。有了这个指标,您可以加强或改善您目前的交易方法,或者您可以简单地观察它,因为您将会看到,即使更多混乱的行为,如市场价格,大量数据,也都要受限于严谨的强大的数学法则。
如何使用它
基本上,使用 APMP 与您经常使用的常规趋势,支撑和阻力位等没有区别。基本的区别在于这些指标计算的可靠性和健壮性。
该 APMP 的常规用法如下:
对于基于趋势的交易策略,交易者必须在支撑区域附近,且趋势向上时买入,并在接近阻力区域,且趋势下跌时卖出。
对于基于趋势调整(逆势)交易策略,交易者必须在支撑区域附近,且趋势下跌时买入,而在阻力区域附近,且趋势向上时卖出。
请注意,极点即可作为支撑位也可作为阻力位,所以我们在设计交易策略时,记住这一要点,并要特别注意价格接近这些位置时的行为。
止损可以设置在开仓价加/减支撑位和阻力位间距的一半,止盈可以设置为之前间距的两倍。此外,当支撑和阻力位正在朝着有利方向移动时,使用追踪止损功能是个好主意。
上述策略轮廓只是一个基本的建议,但 APMP 提供了足够的信息来创建各种交易策略,以及增强现有的。
很有兴趣听到,以这个指标研发出不同的策略。
它如何工作
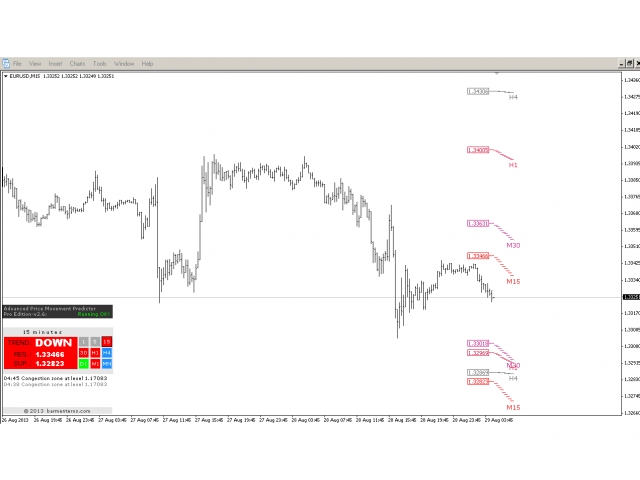
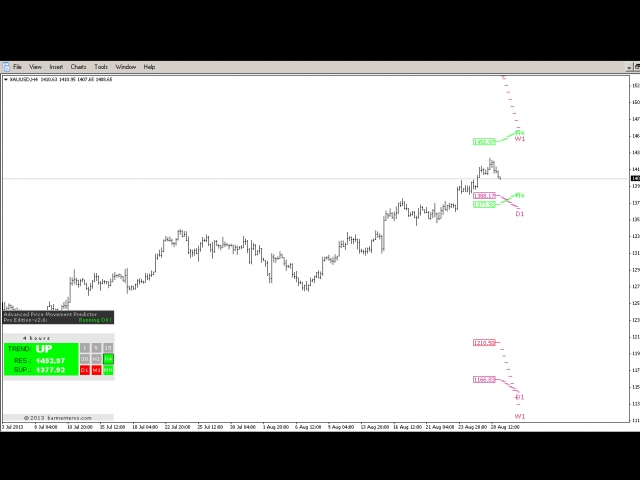
APMP 显示以下信息:
- 当前时间帧,和其余更高时间帧的最接近市场价格的支撑和阻力位。
- 当前时间帧,和其余更高时间帧的实时趋势和更多可能的短线价格走势。
- 出现密集区域,或是价格穿越重要位置时提示。密集区域是指两个或多个级别黏合。
用户也可以启用对话框和邮件提示。无论 APMP 和 MetaTrader 的提示都伴随着蜂鸣声(声音提示)。此外,所有提示都打印在“Experts”标栏,以供未来参考和分析。
关于我们
我们是一个小的程序员/交易员团队,为交易界提供专业的编程服务,主要是为 MetaTrader 平台。我们的团队已有 7 年 (平均) 交易经验,并且大约 6 年 (平均) 的 MetaTrader 专用编程。我们已经为世界各地的众多客户和我们自己开发了脚本,指标和 EA,比如像高级价格走势预测者(APMP)指标的情况。
您可以在此找到我们: barmenteros.com


Выглядит многообещающе. Понравилась простота настроек (их вообще нет) и однозначность предсказаний. Его не нужно "уметь читать". Он дает четкий прогноз. Чисто трендовый индикатор, не точка входа.