适用于MetaTrader 5的技术指标 - 35

Jackson Support and Resistance it a powerful advance support and resistance indicator which provide signal base on price action, it Design to make things easy for everyone to draw support and resistance. we believe most strategies are built with support and resistance as a foundation .Having support and resistance perfect can be a game change to you way of trading. It flexible to all instrument .don't forget to watch our video on how to us this indicator prefect and progressive.
FREE
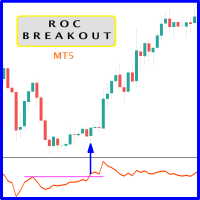
When prices breakout resistance levels are combined with Rate of Change oscillator "ROC" oscillator breaks out its historical resistance levels then probability emerges to record farther prices. It's strongly encouraged to confirm price breakout with oscillator breakout since they have comparable effects to price breaking support and resistance levels; surely, short trades will have the same perception. Concept is based on find swing levels which based on number of bars by each side to confirm
FREE

In which direction should I trade today? For “TREND followers”, we need to determine the TREND . This indicator determines the Trend based on the price High, Low and Close of every bar, for a given period and timeframe. Calculating and plotting the Trend UP and Trend DOWN lines. If the: “Trend UP” line (Green) is above the “Trend DOWN” line (Red), then it is a BULLISH Trend (see "Screenshots" tab). “Trend DOWN” line (Red) is above the “Trend UP” line (Green), then it is a BEARISH Trend (see "
FREE

Read detailed blogpost with screenshots here: https://www.mql5.com/en/blogs/post/764306
Note: This is the MT5 only version. The MT4 version is available here: https://www.mql5.com/en/market/product/149941
Features Kalman smoothing to reduce market noise. Supertrend bands for trend direction. Color-coded dots and arrows for quick reading. Arrow signals for trend continuation. Alerts for trend changes. Adjustable inputs for different styles.
How to Use
Green dots = bullish bias. Red dots = bea

CustomRSI50 - 带50水平的自定义RSI指标 描述 CustomRSI50 是一个基于流行的相对强弱指数 (RSI) 的自定义技术指标。 该指标提供了清晰且可定制的RSI可视化,特别强调50水平,这对于许多交易者在分析市场动量时至关重要。 主要特点 可配置的RSI周期 突出显示的50参考水平 可定制的价格类型 在单独窗口中显示 0到100的固定刻度,便于解释 可定制参数 RSI_Period: 允许设置RSI计算周期(默认:14) applied_price: 允许选择用于计算的价格类型(默认:收盘价) 如何使用CustomRSI50 将指标应用到你的MetaTrader 5图表。 根据个人喜好定制RSI周期和价格类型。 观察RSI相对于50水平的移动: 高于50的值表示看涨动量。 低于50的值表示看跌动量。 信号解释与高周期确认 该指标基于RSI相对于50水平的交叉来生成信号。以下是如何利用它来获得可靠信号: 进场信号: 当RSI在蜡烛收盘时穿越50水平时,可以按1:1.5的风险/回报比进场,并可根据需要延长。 高级别周期确认: 通过观察RSI在更高级别周期上的表现,可
FREE
SMA-ATR-Visual Indicator
The SMA-ATR-Visual is a technical analysis indicator designed to assist traders in identifying market trends, measuring volatility, and visualizing potential entry signals on the chart. Main Components Simple Moving Averages (SMAs): The indicator plots two SMAs — a fast SMA (default 9-period) and a slow SMA (default 21-period) — to help detect short and medium term trend direction. ATR-Based Volatility Bands: Upper and lower bands are calculated using the Average True R
FREE

"We have developed a highly accurate trading signal system applicable to all assets on the 15-minute (M15) timeframe. Calibrated against actual Gold price behavior, this system allows users to trade every candlestick effectively, regardless of market conditions—whether the market is trending, moving sideways, or reversing. The system features real-time arrows and color-coded indicators that signal immediate Buy or Sell entry points. This allows traders to use it as a reliable confirmation tool t
FREE

Binary Connect (THI Reversal) is a professional Signal Indicator designed for Binary Options and Scalping. It helps traders identify high-probability reversal points using a combination of RSI and Bollinger Bands . ️ Please Note: This product is a Technical Indicator that displays entry arrows on the chart. It is NOT an Expert Advisor (EA) and does not place trades automatically on its own. Key Features: Clear Signals: Displays visual "Call" (Green) and "Put" (Red) arrows on the chart. No Re
FREE

Positions panel
This is a panel for counting current icon holdings. Convenient traders at any time to view the position and profit and loss situation. Perfect for traders who like to hold multiple orders at the same time. Main functions: Position statistics Total profit Average price calculation TP price calculation ST price calculation Positions valume
FREE

According to Bill Williams' trading strategy described in the book "Trading Chaos: Maximize Profits with Proven Technical Techniques" the indicator displays the following items in a price chart: 1.Bearish and bullish divergent bars: Bearish divergent bar is colored in red or pink (red is a stronger signal). Bullish divergent bar is colored in blue or light blue color (blue is a stronger signal). 2. "Angulation" formation with deviation speed evaluation. 3. The level for placing a pending order (

This Indicator represents the standard Heikin Ashi Candle converter from normal candles. They are applied on a different chart, so you can identify easily both prices. You can also change candles to your favourite colours. If you want to, you can use this indicator into an iCostum, so you can apply other indicators over this on, because there are excellent indicators combined with this type of candles
FREE

The indicator is based on Robert Miner's methodology described in his book "High probability trading strategies" and displays signals along with momentum of 2 timeframes. A Stochastic oscillator is used as a momentum indicator.
The settings speak for themselves period_1 is the current timeframe, 'current' period_2 is indicated - the senior timeframe is 4 or 5 times larger than the current one. For example, if the current one is 5 minutes, then the older one will be 20 minutes The rest of the s
FREE
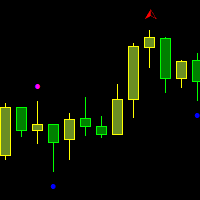
The indicator draws two types of Bill Williams' fractals: Broken fractals – the price has been at least once above or below these fractals. Unbroken fractals – new fractals where the price has not yet moved above or below them. You can configure the color of the fractals, as well as the number of bars used for the indicator's display.
фрактал Вильямса фрактал БВ фракталы Вильямса пробой фрактала пробитый фрактал Торговый хаос broken fractal unbroken fractal Williams fractal Trading Haos Bi
FREE

TrendScanner ALMA — A Lightweight Trend Watcher That Works Silently TrendScanner ALMA quietly monitors the trend status of your selected symbols and timeframes, scanning at regular intervals to detect subtle shifts and notify you—without cluttering your chart. Features ALMA-Based Trend Detection Built on the Arnaud Legoux Moving Average (ALMA), this scanner delivers smooth, responsive trend signals while filtering out market noise. Silent Monitoring of Trend Changes Detects not only uptren
FREE

指标:Currency Strength Meter Pro (货币强弱计专业版) 市场广度可视化 (Market Breadth Visualization) 优点: 该指标以整洁的“仪表盘”形式显示,代替了杂乱的图表。交易者只需扫一眼即可知道市场上哪个货币对最强或最弱。 益处: 节省逐个查看图表的时间,并帮助快速做出选币决策。 自动排名与排序 (Auto-Ranking & Sorting) 优点: 拥有“水平排名”模式,自动将货币对从“最强”到“最弱”进行排序。 益处: 让您立即看到日/周/月的赢家 (Winners) 和输家 (Losers),这是相对强弱交易策略的核心。 智能货币逻辑 (Smart Currency Logic) 优点: 在垂直模式下,工具能智能处理基础货币位置不同的货币对(如 EURUSD 与 USDJPY)。系统会自动“反转”数值,使条形图方向与主货币(如 USD)的强弱一致。 益处: 减少分析基础货币或报价货币位置时的混淆。 多时间周期灵活性 (Multi-Timeframe Flexibility) 优点: 可选择查看日内 (Daily)、周 (Wee

Introducing the "Super Trend Filter Oscillator," your ultimate trading companion designed to enhance your technical analysis and help you make informed decisions in the financial markets. This innovative oscillator is crafted to provide valuable insights into market trends and price movements, assisting traders like you in identifying potential entry and exit points. Features: Trend Identification: The Super Trend Filter Oscillator excels in detecting prevailing market trends, whether they are b
FREE

主要城市的时间。北京时间、东京时间、悉尼时间、惠灵顿时间、纽约时间、法兰克福时间、伦敦时间、迪拜时间。 城市时间可选择开启或者关闭。 点差变色提醒。设置点差提醒点数,例如,设置100点,点差大于100点,文字会变红色。 Time in major cities. Beijing time, Tokyo time, Sydney time, Wellington time, New York time, Frankfurt time, London time, Dubai time. City time can be turned on or off. Dot difference color change reminder. Set the point difference reminder points. For example, set 100 points. If the point difference is greater than 100 points, the text will turn red.
FREE

Simple Super Trend indicator for MetaTrader 5. A trend indicator similar to moving averages. Use it for entry and exit signals. It gives accurate signals on precise time. Works as a Trailing SL/TP. This indicator can also be used on multiple timeframes where you place it on a larger timeframe then go to a lower timeframe. Super Trend needs to be used in conjunction with other indicators like rsi, Parabolic SAR, MACD, etc to receive filtered signals.

Moving Average Crossover with Alert is a indicator that can show buy and sell arrow types of alerts supported by the platform based on the crossover of two moving averages according to the parameters given by the trader. You can change inputs by yourself. This indicator only show the arrows to buy or sell to execute the trade you have to do it by yourself. For more information see the screenshot.

正在寻找一个强大的指标来让您的交易更上一层楼? 看看我们独特的基于 RSI 的指标,它结合了 MQL5中最好的相对强度指数 (RSI)、移动平均线和 Heiken-Ashi 指标。
我们的指标提供无任何滞后的实时数据,让您自信地做出明智的交易决策。 它非常适合所有级别的交易者,从初学者到专家。
通过可自定义的设置和参数,您可以轻松地根据您的交易风格和偏好调整指标。 无论您是日内交易者还是长线投资者,我们基于 RSI 的指标都可以帮助您识别趋势反转并最大化您的利润。
我们技术娴熟的开发人员团队孜孜不倦地创建了一个提供无与伦比的准确性和性能的指标。 通过结合 RSI、移动平均线和 Heiken-Ashi 指标,我们为希望保持领先地位的交易者创建了一个真正的强大工具。
它是 RSI、移动平均线和 Heiken-Ashi 指标的强大组合,没有它您就不想交易。
100% 不重涂 100% 无延迟

MT4 版本 https://www.mql5.com/en/market/product/139061 MT5 版本 https://www.mql5.com/en/market/product/139062
半趋势 Heikin Ashi 仪表盘 – 智能多货币对和多时间框架趋势扫描仪 半趋势 Heikin Ashi 仪表盘是一款革命性的分析工具,它将交易者最喜爱的两大指标——半趋势和 Heikin Ashi——的强大功能整合到一个紧凑且信息丰富的仪表盘中。该指标专为希望在一个屏幕上监控数十个货币对和多个时间框架的交易者而设计,可提供清晰准确的趋势信号,让您不会错过任何潜在的入场机会。
主要特点: 多货币对扫描 一次最多可监控 30 个交易品种!使用您的关注列表(XAUUSD、NAS100、EURUSD 等)进行自定义。
支持多时间框架 检测从 M1 到 MN 的趋势信号,适用于剥头皮交易者和波段交易者。
可视化仪表盘 简洁专业的界面,以清晰易读的颜色代码显示当前趋势状态(买入/卖出/等待)。
实时警报和通知 当新信号出现时,直接在屏幕、电子邮件或移动设备上收到通知。

Ichimoku Alerts 是一款利用 Ichimoku 指标识别市场机会的指标。它可检测四种类型的信号。当转换线 (Tenkansen) 或基准线 (Kijunsen) 上出现反转形态,且两条线均呈上升或下降趋势时,该指标将发出警报,并生成风险管理工具,自动计算交易规模以及潜在的止损和止盈水平。如果信号出现在转换线上,止损位将设置在基准线上;如果信号出现在基准线上,止损位将设置在最近的迟行云线上。用户也可以手动设置止损位,以点数为单位。 功能 - 适用于所有市场和所有时间周期。 - 可检测四种类型的信号: 转换线买入、基准线买入、转换线卖出和基准线卖出。 - 检测到信号时发出警报。 - 检测到信号时发送推送通知。 - 内置风险管理工具。

(谷歌翻译) 该指标基于作为源代码示例提供的原始 ZigZag 以及 MetaTrader 安装。 我用一些额外的功能重写了它,用于显示“深度”通道和相应的突破。 它还允许人们观察先前的之字形点。 可选地,它可以在发生突破时提醒用户。 警报可以简单地在终端上,也可以通过移动设备上的推送通知,使用您自己的自定义文本。 (谷歌翻譯) 該指標基於作為源代碼示例提供的原始 ZigZag 以及 MetaTrader 安裝。 我用一些額外的功能重寫了它,用於顯示“深度”通道和相應的突破。 它還允許人們觀察先前的之字形點。 可選地,它可以在發生突破時提醒用戶。 警報可以簡單地在終端上,也可以通過移動設備上的推送通知,使用您自己的自定義文本。 (Original text) This indicator is based on the original ZigZag provided as a source code example with MetaTrader installations. I rewrote it with some extra features for displaying t
超级趋势多货币扫描仪表板 MT5 是一款功能强大的工具,旨在使用超级趋势指标监控多个货币对和时间框架。它以网格格式组织信号,显示每个符号在从 M1 到 MN1 的时间框架上的趋势状态。交易者可以启用或禁用特定时间框架以适应其策略。 MT4版本可在此处找到: SuperTrend Multicurrency Scanner MT4 详细文档请点击此处: 文档 主要功能: 超级趋势集成:支持完全可定制的超级趋势参数,包括周期和乘数,以鲜绿色高亮显示上升趋势,以红色高亮显示下降趋势,并可调整线条宽度以提高清晰度。 汇合警报:当多个时间框架在同一趋势方向对齐时,高亮显示汇合信号,提供高信心的交易机会。 自定义警报:通过弹出窗口、电子邮件或推送通知提供实时通知,确保交易者及时了解关键市场动态。 响应式设计:动态适应任何屏幕尺寸,清晰显示信号,并指示每个趋势变化发生前的K线数量。 用户自定义:提供灵活的配置选项,包括面板大小、趋势颜色和时间框架过滤器,允许交易者根据其特定需求定制工具。 多符号支持:扫描广泛的货币对,包括主要、次要和外来符号,确保全面的市场覆盖。 注意 :超级趋势多货币扫描仪表板

提升您的交易策略,使用 Big Candle Scanner Dashboard MT5,这是一个多资产仪表板,旨在检测多个货币对和时间框架中的超大牛市和熊市蜡烛,信号潜在动量转变或波动性激增。源于经典蜡烛图分析技术,由交易者如 Steve Nison 在 1990 年代通过他的日本蜡烛图工作普及,这个工具已成为外汇和加密爱好者利用显著价格运动的必备品。它广泛用于识别趋势启动、突破或反转在动态市场中,大蜡烛往往先于主要趋势——提供好处如早期入场机会,通过确认高成交量运动改善风险管理,以及通过自动化扫描减少屏幕时间,使其理想用于剥头皮、日间交易者和波动交易者在外汇对、指数、商品如黄金 (XAUUSD) 和加密货币如 BTCUSD。 Big Candle Scanner Dashboard MT5 呈现一个可自定义的网格界面,显示大蜡烛的实时信号,由石灰绿箭头标记牛市 (向上) 和红色箭头标记熊市 (向下),具有可调节面板大小、颜色 (例如,海绿色标题、钢蓝符号) 和文本缩放以实现最佳可见性。它扫描用户定义的对 (默认包括主要对如 EURUSD、GBPUSD 和异国对) 跨越所有时间框架从
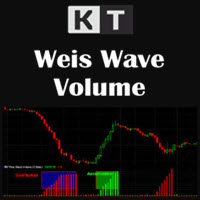
KT Weis 波浪成交量指标是一种基于当前市场趋势和价格运动方向描述的技术指标。该指标基于成交量,并在价格图表中显示价格上涨和下跌时的累计成交量。
此外,在指标窗口中还显示了绿色和上升的红色波浪柱状图。
绿色代表上涨趋势;价格上涨越多,绿色成交量就越大。红色代表下跌波浪;随着价格下跌,红色成交量也会相应增大。通过分析每一波的形态,您可以更好地理解市场的波动状态和趋势方向。
功能特色
该指标为任何市场提供价格波动和成交量数据。 有助于判断趋势方向及其强度。 您可以根据自己的偏好自定义设置和颜色方案。 支持所有时间周期的图表使用。
KT Weis 波浪成交量的工作原理 Weis 波浪成交量通过对每一波内的成交量进行累加,从而形成交替波段的累计成交量柱状图。
正是这种累计成交量,使 Weis 波浪图表具有独特性。它能够比较波浪序列的特性,例如施加力量(以成交量表示)与实际结果(体现在价格柱上的变动)之间的关系。
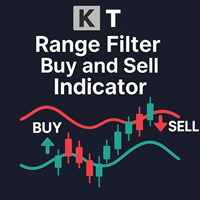
KT Range Filter Buy and Sell 指标简化了微小的价格波动和噪音,使价格走势更加平滑且趋势更加明确。虽然 QQE 平滑通常应用于 RSI,该指标则将此概念直接应用于价格,提供了一种独特且有效的市场分析方法。
该指标具有三条带结构,由一条主平均线以及上带和下带组成。这些带通过范围倍数计算,为价格在定义边界内的移动提供了清晰的可视化表示。
功能特点
通过过滤市场噪音,有助于识别趋势并生成精准的买入和卖出信号。由于其适应性强,非常适合不同交易风格的交易者。 配备了用户友好的界面和丰富的自定义选项,适合初学者和有经验的交易者使用。它提供了宝贵的市场洞察,有助于优化交易策略和决策过程。 支持所有 MetaTrader 警报类型,让您随时掌握市场动态,不错过任何重要的行情变化。
参数设置 该指标注重易用性,使其对新手和资深交易者都非常友好。直观的界面只需几个简单设置即可开始使用,确保用户可以快速根据自身需求进行个性化调整。 它提供广泛的自定义选项,使交易者能够根据自己的策略进行调整。用户可以更改平均线和通道带的可见性,从而更清晰、准确地解读交易信号。
总结
总的来

KT Price Border 创建了一个由三条带组成的价格通道,用于识别市场中的潜在高点和低点。这些水平还可以用作动态市场支撑和阻力。 中间带还可以用于识别趋势方向,因此它也可以作为趋势跟踪指标。此外,其简单易用的特点以及清晰的交易信号,使新手交易者受益匪浅。
功能特点
适用于大多数外汇货币对。 可用于低时间框架和高时间框架。 适用于剥头皮交易、日内交易和波段交易。 支持趋势交易和逆势交易策略。 当价格突破价格带时,可发送提醒通知。 价格带还可作为动态支撑和阻力水平。
理解价格边界的概念 该指标的工作原理类似于布林带。下轨表示市场超卖区域,同时充当动态支撑。 上轨表示市场超买区域,同时充当动态阻力。中间带用于确定趋势方向。 如果价格收于中间带上方,则表明市场仍处于上升趋势;相反,如果价格收于其下方,则表明市场仍处于下降趋势。
专业建议 使用 KT Price Border 进行交易时,可以自由选择自己偏好的入场、止损和止盈方法。 与任何指标一样,应遵循更广泛的市场趋势,并在模拟账户上进行练习,直到完全掌握。请记住,即使是最好的交易指标,在长期交易中也无法保证 100% 的胜
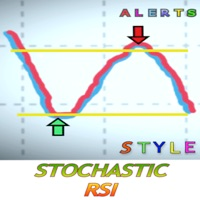
什么是随机RSI?
随机RSI(StochRSI)是技术分析中使用的一个指标,其范围在0和1之间(或在某些图表平台上为0和100),是通过将随机振荡器公式应用于一组相对强度指数(RSI)值而不是标准价格数据来创建的。这个版本包括提醒,不要错过真正的好机会。当你想接收买入信号或卖出信号时,你可以设置参数。为了接收任何信号,你必须通过MetaQuotes ID连接你的桌面版和Metatrader应用程序。MetaQuotes ID在你的MT4/5应用程序的设置>>聊天和信息中找到。在桌面上是在工具>>选项>>通知。你把ID放在桌面版上,激活通知,就可以开始了。
试试MT4版本, 这里
因为风格很重要
我知道每次都要点击属性来改变蜡烛的颜色、背景是浅色还是深色,以及放置或删除网格是多么令人厌烦。这里有一个一键式的解决方案。 三个可定制的按钮可以选择交易者想要的蜡烛样式。 一个按钮可以在白天和夜晚模式之间切换。 一个按钮可以在图表上显示或隐藏网格。 ***** 在设置中,你可以选择按钮在屏幕上的显示位置*****。
另外,请考虑查看我的其他产品 https://www.mql5

指标简介 该指标根据移动平均公式设计而成,相对于 RSI 或 CCI 更稳定, 具有较小的滞后性 。该指标有三条线,设置了5个参数,两个周期参数和线条width宽度,均可手动输入设置。如果指标低于20,则为买入区域,高于80为卖出区域,也可参考金叉或下叉以及上下箭头信号; 该指标能为你带来什么? 准确的入场信号:指标设置了上下箭头信号,当出现向下箭头选择做空, 出现向上箭头选择做多 。 多周期趋势分析:将该指标加载到大周期和小周期,配合使用效果更好,根据大周期指标颜色看方向,根据小周期指标信号入场。 价格高低位判断:指标的值始终介于0-100之间,可以据此分析价格的相对位置,设置了两条临界线,当高于80时候为超买区,可选择高点做空,低于20为超卖区,选择低点做多; 设计新的EA:根据多周期指标趋势线位置或单周期 指标背离设计新的EA; 报警功能:当出现上下箭头信号以及两条线在高于80区域出现死叉或者低于20区域出现金叉时候,它能够发送邮件和massages到手机客户端,同时在电脑图表窗口发送Alert警报,让你不用一直盯盘也可以即时获得信号提醒,每次消息提醒重复次数可以手动修改,三种类

The ONLY RSI Indicator You'll Ever Need - Works with ANY Broker, ANY Symbol! Finally, an RSI indicator that automatically adapts to YOUR broker's symbol naming conventions! Whether you trade Forex, Gold, Bitcoin, or Stock Indices - this universal indicator detects and monitors related symbols automatically. KEY FEATURES & BENEFITS UNIVERSAL COMPATIBILITY Auto-Detects Broker Patterns : Works with ANY broker suffix (.m, .pro, .raw, etc.) All Asset Classes : Forex, Metals (Gold/Silver), Crypto,
FREE
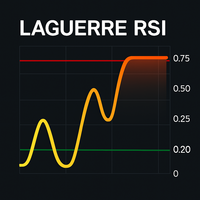
拉盖尔RSI(Laguerre RSI):高级振荡指标 拉盖尔RSI(Laguerre RSI) 是一种基于数字滤波器的高级振荡指标,由 约翰·埃勒斯(John Ehlers) 开发。该指标利用一种称为 拉盖尔滤波器(Laguerre filter) 的技术来平滑价格波动,从而更精确地检测 超买 和 超卖 区域,同时减少市场噪音。 拉盖尔RSI的波动范围在 0到1之间 ,其标准水平如下: 超买: 高于 0.75 超卖: 低于 0.25 该指标是检测 市场转向 、 精确入场点 和 信号确认 的理想选择。 可选功能 拉盖尔RSI包含以下可选功能: 声音、电子邮件或推送警报 关键区域之间的视觉填充 灵活的平滑参数设置( gamma ) 用户手册 可配置参数: 1. 主要配置 gamma (0.1 到 0.9): 控制平滑程度。 较低的值 → 更高的灵敏度,更多的信号。 较高的值 → 更大的平滑度,更少的噪音。 overbought / oversold : 用于标记极端区域的水平。 默认值: overbought = 0.75 oversold = 0.25 2. 视觉外观 mainLine
FREE

介绍 RSIScalperPro - 这款基于 RSI 指标的革命性交易指标适用于 MetaTrader 5,专为一分钟图表的剖刺交易而设计。借助 RSIScalperPro,您将拥有一个强大的工具箱,用于精确的入场和出场信号,提升您的交易水平。 RSIScalperPro 使用两种不同的 RSI 指标,为超买和超卖区域提供清晰的信号。您可以根据自己的偏好自定义两个 RSI 的时间周期和限制值,以实现您的交易策略的最佳效果。图表上的明显箭头使您可以轻松识别何时进入或退出交易。 RSIScalperPro 的另一个亮点是三个可自定义的移动平均线,帮助您识别趋势方向并确认强大的交易信号。这使您可以早早发现趋势并参与到盈利交易中。 此外,您可以设置 RSIScalperPro 发出每个新交易信号的听觉警报。这样,即使您不经常坐在计算机屏幕前,也不会错过任何重要的交易机会。 RSIScalperPro 提供用户友好的界面,并且在 MetaTrader 5 中很容易插入和配置。您可以根据个人交易偏好自定义指标,并利用其多样化的功能,提高交易成果。 利用 RSIScalperPro 的优势,提高

随机振荡器多货币扫描仪表板 MT5 是一款功能强大的工具,旨在使用随机振荡器监控多个货币对和时间框架。它以网格格式组织信号,显示每个符号在从 M1 到 MN1 的时间框架上的状态。交易者可以启用或禁用特定时间框架以适应其策略。 MT4版本可在此处找到: Stochastic Oscillator Multicurrency Scanner MT4 详细文档请点击此处: 文档 该工具根据以下随机振荡器策略显示信号: 超买/超卖策略:当随机振荡器进入或退出超买(高于上水平)或超卖(低于下水平)区域时生成信号,表明潜在的反转。 反转水平策略:当随机振荡器回穿用户定义或自动计算的上水平或下水平时触发信号,提示动能的转变。 交叉策略:当随机振荡器的%K线与%D线交叉时激活信号,可针对趋势或区间交易进行定制。 主要功能: 随机振荡器集成:支持四种进场策略,包括进入或退出超买/超卖区域的信号、反转水平和交叉。参数如K周期、D周期、减速因子和水平可完全定制,以进行精确分析。 汇合警报:当多个时间框架在同一方向对齐时,高亮显示汇合信号,增强交易设置的可靠性。 自定义警报:通过弹出窗口、电子邮件或推送通知

使用 Cm Ultimate Ma Mtf MT5 提升您的交易决策,这是一个强大的移动平均指标,提供高度自定义和灵活性用于多时间框架分析. 基于 TradingView 流行概念并为 MT5 优化, 它支持如 Tilson T3 等高级 MA 类型, 自 2010 年代以来因从不同时间框架绘制双 MA 的能力而受欢迎. 非重绘且用户友好, 它用箭头突出价格交叉和 MA 交叉, 理想用于外汇和加密等波动市场的趋势检测. Cm Ultimate Ma Mtf 在 multi-timeframe 灵活性方面出色, 默认当前时间框架但允许从另一个绘制第二 MA 用于交叉检测和基于方向的颜色变化. Highlight bars 和箭头用于价格/MA 交叉提供视觉 cues 用于入/出场. 优势包括用于平滑信号的灵活 MA 类型, 用于关键事件的警报, 以及通过缓冲区的 EA 集成, 改进剥头皮或波段交易中的胜率. 跨资产通用, 其通知确保及时行动, 在无需持续监控的情况下提升盈利能力. MQL 产品安装指南 | 在 MT4/MT5 上更新购买的 MQL 产品 关键功能 多时间框架灵活性: 默认
使用 SSL Channel Indicator MT5 提升您的交易精准度,这是一款动态工具,旨在通过创新的Semaphore Signal Level (SSL) 方法可视化价格趋势动态。植根于MQL5和Forex Factory等交易社区推广的技术分析概念,该指标使用两个10周期简单移动平均线(SMA)—一个用于高点,一个用于低点—形成一个响应迅速的价格通道。以其在识别趋势变化方面的简单性和有效性而闻名,是寻求清晰反转或延续信号的交易者的首选,无需复杂计算。 SSL Channel Indicator 通过“翻转技术”在信号趋势形成和转变方面表现出色,价格在基于SMA的高/低通道上下交替。当价格低于高点SMA时保留高点通道,当价格高于低点SMA时保留低点通道,为趋势反转或延续提供清晰的视觉提示。优势包括为趋势跟随或反转策略提供精确的入场/出场时机,减少震荡市场中的噪音,适用于外汇、股票、指数、商品或加密货币。可定制的警报确保您保持主动性,无需持续监控图表即可在趋势或反转市场中提升潜在盈利能力。 MQL 产品安装指南 | 在 MT4/MT5 上更新购买的 MQL 产
KT Adaptive RSI 指标将自适应模块与经典 RSI 相结合,根据当前市场状况动态识别超买和超卖水平。传统的 RSI 假设当数值高于 70 时为超买,低于 30 时为超卖,但对于所有交易品种来说,这并不总是准确的。 我们的自适应模块会快速分析历史数据,自适应地确定最佳的超买和超卖阈值。这有助于交易者根据实时市场行为做出更精确的进出场决策,从而提高交易的准确性和信心。
均值回归入场
如果某个交易品种在经历极端波动后往往会回到平均价格,您可以利用指标识别的动态超买和超卖区间来精准入场。这种方法有助于捕捉短期价格波动并快速锁定利润。
趋势跟随入场
如果某个交易品种通常处于强趋势中,您可以利用这些动态超买和超卖区间顺势入场,从而有信心把握价格走势,获取更大的潜在收益。
功能特点
该指标适用于趋势跟随和均值回归两种策略,在任何市场环境中帮助您精准找出进出场点。 自适应模块高效运行,提供智能分析而不会占用过多 CPU 资源。 如果您常常难以在传统 RSI 中确定理想的超买和超卖水平,这款自适应 RSI 将让您的交易决策更轻松。 指标用不同颜色清晰标出超买和超卖区域,并在图表中直接标
KT Two Pole Oscillator 是一款帮助交易者通过高级平滑算法识别精准市场信号的指标。它结合了基于偏差的计算和独特的双极滤波方法,生成清晰的视觉信号,让交易者更容易理解并及时采取行动。 得益于其自适应特性,双极滤波器在不同的市场环境中都能保持稳定,无论是趋势行情还是震荡行情,都是一个实用的工具。
功能亮点
双极滤波: 平滑震荡器信号,去除市场噪音,清晰显示市场动量和趋势方向。 超买/超卖识别: 当市场达到极端水平时能清晰标识,提示可能的反转或回调。 范围从 1 到 -1: 明确定义的震荡区间,有助于减少尤其在接近零线时出现的虚假信号。 高度可定制: 可以调整震荡器周期、颜色风格及其他参数,灵活适配个人交易风格。 全面提醒功能: 通过 MetaTrader 警报和推送通知实时提醒您信号,即使不在电脑前也不错过交易机会。
如何解读信号 当震荡器线从下向上穿越信号线时,会出现蓝色圆点,表示买入信号;当震荡器线从上向下穿越信号线时,会出现红色圆点,表示卖出信号。这些视觉标记便于快速识别可操作的交易机会。
专业建议
靠近 +1 和 -1 极端值处的信号通常更为可靠,因为它们

KT Higher High Lower Low 标记以下摆动点及其对应的支撑/阻力水平,帮助交易者更好地识别市场趋势: Higher High: 价格创出的新高点,比之前的高点更高,通常表示市场处于上升趋势,买方力量强劲。 Lower High: 价格创出的高点比之前的高点低,说明市场可能正在进入调整阶段,或趋势反转的可能性增加。 Lower Low: 价格创出的新低点,比之前的低点更低,通常意味着市场处于下降趋势,卖方力量占主导地位。 Higher Low: 价格创出的低点比之前的低点更高,这可能表明市场正在走强,多头趋势可能正在形成或延续。
特点 可以通过调整左右柱的数量来控制摆动点的强度,使交易者能够根据市场情况灵活调整分析策略。 在新的 HH、LH、LL 和 HL 出现时提供警报,以便交易者可以及时把握市场变化,不错过任何重要机会。 当价格触及关键的支撑或阻力水平时,系统会自动提供警报,有助于交易者更好地管理交易,制定更精准的进出场计划。

此供需区域指标在图表上绘制区域并在价格达到或突破区域时发送警报。也可以使用它来提醒常规双顶/底部而不是区域。可以使用 RSI、ADX、成交量和发散过滤器来过滤出最强的设置。结合您自己的规则和技术,该指标将允许您创建(或增强)自己的强大系统。该指标适用于已经熟悉供应需求以及在决定关闭或打开交易时如何使用它的更有经验的交易者。 特征
支持以下分歧: MACD、OsMA、RSI、CCI、随机指标和真棒。 这些区域有 3 种颜色(可通过输入进行调整)。未测试区域为深色,测试区域为中等,破损区域为浅色。 区域外边界的价格以及区域测试的数量都写在每个区域。 该指标可以将信号写入全局变量,EA 可以使用这些变量进行自动交易。 输入参数
请在 此处 找到输入参数的说明和说明。
KT QQE Advanced 是对经典 QQE 振荡指标的改良版本,通过彩色柱状图配合快线与慢线 Trailing Line(TL)更直观、更精细地呈现市场动向,让交易者在瞬息万变的行情中也能一眼捕捉强弱转换、动能变化与潜在买卖区间。
与传统 QQE 不同,KT QQE Advanced 采用柱状体并附带超买/超卖水平,使过度延伸的行情一目了然,有助于及时做出高概率决策。
应用场景
借助多周期(MTF)扫描器,跨越所有时间周期快速捕捉买卖信号。 更精准地判断趋势方向,避免逆势操作。 及时识别超买/超卖状态,规避追高杀跌风险。 直观展示价格动能强弱,辅助顺势加仓或减仓。
输入参数 RSI 周期 平滑周期 MTF 扫描器 提醒设置
QQE 究竟是什么? QQE 全称 Quantitative Qualitative Estimation(定量定性估测)。它基于超平滑 RSI 与 ATR 的结合,既保留 RSI 的动量属性,又通过波动率因子过滤噪音。 不同于普通 RSI,QQE 采用 Wilder RSI,并用改良的指数移动平均进行平滑处理。 Wilder 平滑公式:前一 MA

由於經紀公司的技術和邏輯操作,我花了很長時間才推出了這個後方指標,它結合了具有以下功能的眾多策略:
市場趨勢識別:了解市場的整體趨勢。
反轉點:辨識市場可能改變方向的潛在點。
進入和退出點:確定進入和退出交易的最佳時間。
若要全面了解如何使用該指標,請觀看隨附的影片。此外,下載提供的指標以進行完整分析。 ------------------------------------------------------------------------ https://www.mql5.com/en/market/product/92909
AND https://www.mql5.com/en/market/product/109519

Astral Pulse Oscillator — The Celestial Flow & Energy Resonance Tool Step into the mystic rhythm of market energy with the Astral Pulse Oscillator , a non-repainting fusion of celestial flow mapping and harmonic pulse resonance . This indicator translates hidden energetic fluctuations into radiant visual waves, allowing traders to interpret the unseen emotional tide that moves price — from euphoric expansions to ethereal contractions. Within its luminous subwindow, two astral forces dance: Ce
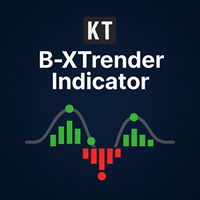
KT B-Xtrender 是一款对最初由 Bharat Jhunjhunwala 在 IFTA 期刊中提出的趋势跟踪工具的高级改进版本。我们在原始概念的基础上进行了优化,带来了更精确的信号和内置提醒,帮助交易者在趋势市场中捕捉更稳健的交易机会。 虽然它可以应用于不同周期的图表,但在 4 小时和日线等较高周期上表现最为出色。
功能特点
双趋势视角: 结合短周期与长周期分析,更容易区分普通回调与真正的趋势反转。 清晰明了的信号: 提供直接的买卖提示以及加仓与减仓点,让交易管理更有条理和信心。 短周期直方图: 展示趋势内部的修正行情。绿色代表短期动能增强,红色则提示短期疲弱。 长周期直方图: 通过快慢均线配合 RSI 平滑处理来确认市场主趋势方向。 趋势一致性: 当两个直方图方向一致时,信号更强,有助于避免过早入场和错误反转判断。 过滤噪音: 避免被日常波动干扰,重点关注更重要的市场结构变化。 适用于多种市场: 可用于股票、外汇和商品市场。虽然可应用于多周期,但在 H4 和日线等较高周期中表现最佳。 内置提醒功能: 当趋势形成、延续或反转时自动提醒,无需一直盯盘。 直观视觉表达: 绿

Trend Reversal Candles is an indicator designed to highlight common candlestick reversal and continuation patterns directly on the chart.
It marks detected setups with arrows and labels for easier visual recognition, reducing the need for manual pattern searching. Detected Patterns Bullish and Bearish Engulfing Hammer and Hanging Man Shooting Star Doji variations Other widely used reversal setups Features Displays arrows and pattern names on the chart Works on any symbol (Forex, Gold, Indices, C

这 FVG 区域指标 MT5 是一款功能强大的工具,旨在识别市场中的公允价值差距 (FVG),突出公允价值与市场价格之间的价格不平衡。这种对差距的精确识别使交易者能够发现潜在的市场进入和退出点,从而大大提高他们做出明智交易决策的能力。 FVG 区域指标具有直观且用户友好的界面,可自动扫描图表以查找公允价值缺口,并在价格图表上实时标记这些区域。这使交易者能够快速轻松地识别可能预示即将出现价格调整或趋势延续的潜在价格不平衡。 主要特点包括: 实时间隙检测: 自动识别并标记出现的 FVG。 显示间隙大小(点数): 该指标以点数显示每个已识别差距的大小,帮助交易者了解差距的重要性。 与当前价格的点差: 立即计算并显示当前价格与已确定的公平价值差距有多少点。 清晰的可视化: 视觉上不同的 FVG 区域采用颜色编码以便快速参考,帮助交易者专注于关键市场区域。 无论您是经验丰富的交易员还是技术分析新手, FVG 区域指标 提供有关市场价格不平衡的重要见解,帮助您准确、自信地完善交易策略。
参数 间隙参数 间隙填充检测百分比 -
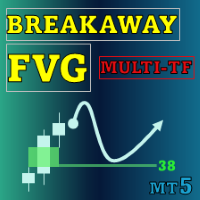
Special offer : ALL TOOLS , just $35 each! New tools will be $30 for the first week or the first 3 purchases ! Trading Tools Channel on MQL5 : Join my MQL5 channel to update the latest news from me Breakaway Fair Value Gaps (FVG) 工具是一种尖端的解决方案,旨在帮助交易者识别价格从平衡中突破的区域,并提供有关修正概率的深入见解。该工具不仅突出关键信号,还包括高级功能以提高决策的准确性。 查看 MT4 版本: Breakaway Fair Value Gaps MT4 查看更多产品: 所有 产品 Breakaway FVG 的关键特点 1. 什么是 Breakaway Fair Value Gap? 定义:
Breakaway FVG 是在价格突破近期历史新 高 或新 低 点时形成的区域。这些区域表明市场的强劲动量,因为买家或卖

KT Psar Arrows使用标准的抛物线转向指标(Parabolic SAR)在图表上绘制箭头。当蜡烛的最高点触及SAR时绘制看涨箭头;当蜡烛的最低点触及SAR时绘制看跌箭头。信号在实时生成,无需等待K线收盘。
特点
对于想要基于抛物线SAR指标开发交易策略的交易者来说,这是一个非常有用的工具。 可以用于寻找市场中的转折点。 支持自定义PSAR参数输入。 提供所有MT4的提醒功能。
注意事项:抛物线SAR是一个滞后且严格机械化的指标。每一笔潜在交易都应该通过明确定义的规则进行筛选。
输入参数 PSAR步长:输入步长值。 PSAR最大值:输入最大值。 显示PSAR点:显示/隐藏PSAR点。即使不显示PSAR点,箭头功能也能正常工作。 其余输入项均为直观设置,无需特别说明。

The Box Range Indicator for MT5 helps traders visualize key price zones by automatically detecting and highlighting market structures. It dynamically draws upper, lower, and middle levels based on price action, making it an effective tool for identifying support and resistance zones, breakouts, and trend reversals .
Key Features: • Automatic Box Detection – Identifies price ranges based on market movements. • Dynamic High and Low Updates – Adjusts in real time to reflect market conditions.
FREE
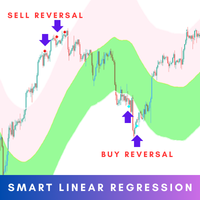
The Smart Linear Regression indicator is a powerful, non-repainting tool designed for traders looking for enhanced accuracy in market analysis. Unlike the typical linear regression channels that often repaint, this indicator provides reliable insights without changing past values, making it more trustworthy for forecasting future price movements. MT4 Version - https://www.mql5.com/en/market/product/124893/ Overview: The Smart Linear Regression Indicator goes beyond the basic linear regr

KT MACD 背离指标显示价格与振荡器之间的常规背离和隐藏背离。如果你的交易策略是基于趋势反转,可以使用 MACD 的常规背离来捕捉潜在的转折点。而如果你的策略是基于趋势延续,MACD 的隐藏背离将是一个不错的选择。
KT MACD 背离的局限性
将 MACD 背离作为单独的入场信号可能存在一定风险。并非所有的背离都能解释为反转信号。为了获得更好的效果,建议将其与价格行为分析和其他交易方法结合使用。
功能特点
标记价格与振荡器之间的常规和隐藏背离。 为提高准确率并减少图表杂乱,会自动忽略不对称的背离。 支持趋势反转和趋势延续两种交易策略。 完全支持嵌入到智能交易系统中使用。 可用于入场信号和出场信号。 支持所有 MetaTrader 警报功能。
什么是背离? 一般来说,如果价格创出更高高点,那么振荡器也应创出更高高点;如果价格创出更低低点,那么振荡器也应同步走低。当这种正常的行为没有出现时,就表示价格和振荡器之间出现了背离。背离主要分为两种类型:
常规背离
常规看涨背离:当价格创出更低低点,但振荡器却创出更高低点。 常规看跌背离:当价格创出更高高点,但振荡器却创出更低高点。

100PIPSsignals — 黄金 (M1) 快速 EMA 交叉系统 一款轻量级 EMA 交叉指标,专为 1 分钟图上的黄金差价合约设计。它用清晰的箭头和金色圆圈标记低风险入场点,通过可配置的最低点差目标来验证走势,并可发送警报/通知。
工作原理(简单) 该指标使用两条指数移动平均线(快速 EMA 和中速 EMA)。
当快速 EMA 向上穿越中速 EMA 时,会出现买入信号箭头;当快速 EMA 向下穿越中速 EMA 时,会出现卖出箭头。
下一个柱状图的开盘价会显示一个金色圆圈,指示实际建议的入场价格。
该指标通过检查入场后的价格走势来验证每个信号:在有效期内未达到可配置的最低点差目标的信号将被移除。已验证的交易会在图表上标注点差收益。
将其用于 XAU(黄金)差价合约 (CFD),1 分钟时间周期,并在交易前通过检查更高时间周期来确认信号。 主要特点 专为黄金(CFD/金属)设计 — 针对 1 分钟时间周期进行了优化。
信号由快速 EMA / 中速 EMA 交叉生成。
向上箭头 = 买入信号,向下箭头 = 卖出信号。
金色圆圈标记实际入场点(下一个开启的柱线)。

Trend magic indicator uses cci and atr to create buy and sell in the market . this a a line that changes its color when any of the conditions occur ie buy and sell . I find the indicator given you a bit of a better entry when you change the parameters to CCI=20, ATR=100, ATR MULTIPLIER= 2.
Set up entry just above the indicatror afetr a retracement. Set your stop loss a 20 cents to a dollar (depending on share size) below your entry. Be ready to enter a new position above indicator again if you
FREE

Get ALERTS for break of your TRENDLINES, SUPPORT LINES, RESISTANCE LINE, ANY LINE!!
1. Draw a line on the chart (Trend, support, resistance, whatever you like) and give it a name (e.g. MY EURUSD line) 2. Load the Indicator and input the Line Name the same name in Indicator INPUT so system knows the name of your line (= MY EURUSD line) 3. Get Alerts when Price breaks the line and closes Works on All Time frames and charts LEAVE A COMMENT AND IF THERE IS ENOUGH INTEREST I WILL WRITE AN EA WHICH W
FREE

This indicator draws the Donchian Channel, filling the background with colors. The color of the middle line is changed following the current trend, based on the standard interpretation of the Donchian Channel.
Input Parameters: Period of the Channel (default is 20) Validate Signals (boolean value to filter out false breakouts, default is false) Background Settings
Show Background (default is true) U ptrend Color (default is DodgerBlue ) Downtrend Color (default is Orchid) Background Tran
FREE
描述
Candlestick Pattern Analyzer 是一款面向离散交易者和系统交易者的高级工具,旨在自动识别主要日式蜡烛图形态,并对其历史表现进行详细的统计分析。
该指标非常适合希望验证图形态实际有效性,并将其与确认筛选(如趋势、关键水平、成交量等)以及明确的风险管理策略结合使用的交易者。 主要功能 自动检测超过 20 种蜡烛图形态(吞没形态、十字星、光头光脚线、锤头、流星、孕线等) 计算每种形态出现后可调节数量的后续 K 线内的平均收益和累计收益 显示检测到的形态总数,以客观评估其出现频率 在图表上通过彩色框和文字标注直观突出每个形态 新图形态出现时实时推送通知和警报 界面完全可定制:选择启用的形态、配色方案、分析周期和数据显示位置 优势
许多交易者对蜡烛图形态的解读依赖直觉和主观判断。Candlestick Pattern Analyzer 提供定量化、可视化的方法,帮助你识别在所选标的或时间框架内真正具有统计优势的图形态。 使用场景 研究具有实际统计优势的蜡烛图形态 构建基于客观数据的交易策略 实时接收可视化信号和交易提醒 重要提示
本工具非自动交易系统,而是
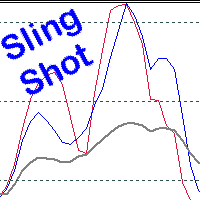
Scalping, Mean reversion or Position trading strategy
Get into an established trend on a pullback in the market. Use the Pinch in the indicator for profit taking. Use the Pinch as a mean reversion strategy, scalping back to a moving average line.
Input Parameters Fast Sling Shot configuration. Slow Sling Shot configuration. Dual Sling Shot configuration. Price line configuration. Trigger zones or levels. Example of Sling Shot trade idea: Price line sets the mood, below the baseline level (50)

SuperTrend Indicator for MetaTrader 5 The SuperTrend Indicator is a classic trend-following tool designed to help traders identify the current market direction with clarity and precision. Based on Average True Range (ATR), it dynamically adapts to price volatility to outline potential support or resistance levels in trending markets. Key Features Trend Visualization
Displays color-coded trend lines directly on the chart:
• Uptrend – green line
• Downtrend – red line Signal Arrows
Shows arrows
FREE

Gold Storm Signals - Professional XAU/USD Trading Indicator
Gold Storm Signals is a premium multi-confirmation indicator for Gold (XAU/USD) trading on MetaTrader 5. Get precise buy/sell signals with automatic stop loss and take profit levels displayed directly on your chart.
KEY FEATURES:
- Clear Buy & Sell Signal Arrows - Automatic ATR-Based Stop Loss Calculation - Dual TP Levels (TP1 & TP2) - Complete Alert System (Push, Email, Sound) - Works on All Timeframes (M1 to D1) - No Repainting -
FREE

Highly configurable Adx indicator.
Features: Highly customizable alert functions (at levels, crosses, direction changes via email, push, sound, popup) Multi timeframe ability Color customization (at levels, crosses, direction changes) Linear interpolation and histogram mode options Works on strategy tester in multi timeframe mode (at weekend without ticks also) Adjustable Levels Parameters:
ADX Timeframe: You can set the lower/higher timeframes for Adx. ADX Bar Shift: you can set the of
FREE

变色K线通道指标 这个指标包括两个部分 部分I : 变色K线标 通过变色K线来指示当前市场状况。如果是青色,则是多头市场,如果是红色则是空头市场。 如果颜色正在交替变化中,最好等它变完后,即等K线收盘。 部分II: 通道指标 通道包括内外两层,内层定义为安全区域,外层用了平仓。 交易策略: 如果是颜色是青色,即多头,等价格位于内层通道时开多,价格触及外层轨道则平仓。 如果颜色是红色,即空头,等价格位于内层通道是开空,价格触及外层轨道则平仓。 提示:当且仅当价格位于内层通道时才入场,这点非常重要。
参数解释 ShowColorCandle - true 则画变色K线 AlertColorChange - true.当颜色完成变换后会有弹窗报警 EmailColorChange - true.当颜色完成变换后会发送email提醒 ShowBands - true 则画通道指标 AlertCrossOuterBands - true 价格触及外通道则弹窗报警 AlertCrossOuttrBands - true 价格触及外通道则会发送email提醒 MT4 版本: https://w
This indicator is a **Pivot-Confluence Zone Identifier** that focuses exclusively on identifying key support and resistance levels where price clusters align with classic pivot points. Here's what it does:
## Core Functionality
**Pivot Confluence Detection**: - Only displays price zones that align with classic pivot point levels (R1, R2, R3, S1, S2, S3) - **Excludes the main pivot point** - focuses only on support and resistance levels - Uses a configurable pip range to detect confluence nea
FREE

Range Perfect 指标简介 Range Perfect(RP)是由 MX Robots 开发的专有 MetaTrader 5 指标,专为在区间波动或趋势衰竭阶段交易的用户设计。它能够识别趋势疲劳,并在 XAUUSD、EURUSD、主要外汇货币对、比特币等加密货币及其他高波动性资产上定位高概率反转区域。 与大多数需要多重确认的指标不同,Range Perfect 本身就是一个完整的交易策略。从示例信号和图表中可以看到,RP 能够单独提供高质量的买卖信号,无需与其他指标组合使用。而当它与其他技术工具结合时,整体准确率可提升至 85% 以上。 该指标基于人工智能算法开发,可更精准地识别市场结构、趋势耗尽阶段以及不可见的支撑与阻力区域。 Range Perfect 的独特优势 Range Perfect 结合了高级数学模型与智能市场分析技术,构建出一套强大的信号系统,能够高精度识别价格的转折点。它不仅能够定位潜在的反转区域,还能自动识别肉眼难以察觉的隐形支撑位与阻力位。 MX Robots 表示,RP 是其 AI 引擎开发出的最强定制指标之一。根据其内部为期六个月的测试,该指标单独使

It so happened that it is no longer necessary to write about the principles of operation of indicators of this type. The presented indicator redraws the trend direction until it changes to the opposite. whether this is right or not is up to you to judge. It works well together with SM trend Cloud, which is implemented in the SMak ZigZag EA and Pyramid EA Expert Advisor code. When these two indicators work together, it is possible to determine the further trend movement with a high degree of pr
FREE
The THREE DRAGONS is a technical indicator that portrays three mystical Chinese dragons flying through the price chart:
1. The Green Dragon (SeaGreen): - The most agile and fastest of the three - Reacts quickly to market direction changes - Usually leads the movements
2. The Red Dragon (Tomato): - Moves with balance between speed and caution - Confirms movements initiated by the Green Dragon - Its interactions with the Green Dragon may indicate opportunities
3. The Black Dragon (Black): - Th
FREE

Camarilla Swing Trade Indicator is an Indicator. Support and resistance points are calculated from the High Low Close of the previous TF Week's price.
What are Camarilla Pivot Points?
1.Camarilla Pivot Points is a modified version of the classic Pivot Point. 2.Camarilla Pivot Points was launched in 1989 by Nick Scott, a successful bond trader. 3.The basic idea behind Camarilla Pivot Points is that price tends to revert to its mean until it doesn't. 4.Camarilla Pivot Points is a mathematical pr
FREE

TK - Rainbow 指标 描述: TK - Rainbow 指标是一个强大的技术分析工具,旨在通过多条线的方式提供市场趋势的清晰视图。通过30条计算不同周期的线,它提供了广泛的价格运动分析。该指标使用双色方案来突出显示上升和下降趋势,使市场状况一目了然。 主要特点: 30条线: 每条线代表不同的平滑周期,以涵盖广泛的市场趋势。 双色方案: 使用两种颜色区分上升(冷色)和下降(暖色)趋势。 可定制设置: 调整线宽、样式和步长以适应您的交易偏好。 如何使用 TK - Rainbow: 应用指标: 从 MetaTrader 5 的指标列表中将 TK - Rainbow 指标添加到您的图表中。 配置参数: 步长 (inpStep): 定义每条线之间的周期增量。调整此设置以设置线条间距。 价格 (inpPrice): 选择用于计算的价格类型(例如,收盘、开盘、最高、最低)。 线宽 (inpLinesWidth): 设置线条的厚度以提高清晰度。 线样式 (inpLinesStyle): 选择线条的样式(例如,实线、虚线)。 解读颜色: 上升趋势: 冷色(蓝色)的线条表示上升趋势。 下降趋势:
FREE
PVWAP Improved MT5 – 高级成交量加权平均价指标 PVWAP Improved MT5 是我个人 VWAP 指标的增强版和优化版。该指标显示成交量加权平均价,并提供多条标准差通道,用于识别潜在的支撑、阻力以及价格动能衰减区域。指标适用于所有周期,并在处理大量历史数据时依然运行流畅。 指标用途 VWAP 表示大量成交发生时的平均价格,是判断市场位置和公平价值的重要参考。 主要用途: 价格高于 VWAP:市场偏多 价格低于 VWAP:市场偏空 标准差通道(+1、+2、-1、-2)显示超买和超卖区域 帮助识别潜在的进场、离场或反弹位置 用于判定市场是趋势运行還是均值回归 该指标非常适合日内交易、剥头皮以及波段交易者,用于分析市场真实压力。 主要特性 使用 MetaTrader 5 的真实成交量進行計算 Daily 模式:每天重置,適合日內交易 Continuous 模式:VWAP 持續計算不中斷 最多 4 條標準差通道:+1、+2、-1、-2 顏色、線型、線寬完全可自定義 支持所有品種和所有周期 計算快速,適合回測和實時交易 指標穩定清晰,易於整合到任何交易策略中

The TRIXe Indicator is the combination of the TRIX indicator (Triple Exponential Moving Average) with the addition of an EMA (Exponential Moving Average) signal. It provides signs of trend continuity and the start of a new trend.
The entry and exit points of operations occur when the indicator curves cross.
It performs better when combined with other indicators.
FREE

The Candle High Low Exit indicator uses the highest high and the lowest low of a range to draw trailing stop lines (orange under buys, magenta over sells) that advance with the trend until the trend changes direction. Moreover, the trailing stop lines are generated to support the order’s trend direction (long or short): In an upward trend, the long trailing stop line (orange line under buy) appears and advances upward until the close crosses under the line.
In a downward trend, the short trai
FREE
MetaTrader市场是一个简单方便的网站,在这里开发者可以出售自己的交易应用程序。
我们将帮助您发布您的产品,并向您解释如何为市场准备您的产品描述。市场上所有的应用程序都是加密保护并且只能在买家的电脑上运行。非法拷贝是不可能的。
您错过了交易机会:
- 免费交易应用程序
- 8,000+信号可供复制
- 探索金融市场的经济新闻
注册
登录