
价格行为分析工具包开发(第 17 部分):TrendLoom EA 工具

内容
引言
趋势分析师的市场分析和入场确认方法各不相同。许多交易者会查看多个时间周期,例如 M1、M5 和 M15,或 H1、H4 和 W1,以验证他们的入场并提高信号的可靠性。您无需切换时间周期来评估整体趋势,只需按一下按钮,即可获得及时的更新,或自动获取更新。您是否曾遇到过这样的情况:在较低时间周期上看到卖出信号并入场交易,然后打开较高时间周期的图表,却发现那是一个买入趋势?
TrendLoom EA 就是为了防止这种错误而设计的。它的特色是一个包含七个按钮的面板,这些按钮代表了不同的交易风格。每个按钮显示三个时间周期,这些时间周期会一起使用移动平均线进行分析,以生成买入、卖出或中性信号。这个强大的工具提供快速的确认更新,并在检测到相关信号时持续刷新。
策略概览
TrendLoom EA 的结构是一个图形界面(面板)。该面板包含七个按钮,每个按钮对应一个特定的交易策略。- 短期关注 (M1, M5, M15)
- 剥头皮/日内交易 (M5, M15, H1)
- 波段交易 (M15, H1, H4)
- 趋势交易 (H1, H4, D1)
- 多时间周期趋势确认 (H1, H4, W1)
- 短期剥头皮/中期趋势 (M5, H1, D1)
- 长期趋势 (H1, D1, W1)
让我们来逐步了解当按下按钮时,EA 如何生成买入、卖出或中性信号。
- 收集数据:对于三个时间周期中的每一个(例如 M1、M5 和 M15),EA 会获取最后一根已完整形成 K 线的收盘价。
- 计算 SMA:对于每个时间周期,EA 会计算一个 50 周期的简单移动平均线(SMA)。这个 SMA 作为当前价格的基准。
- 如果价格高于 SMA,则视为看涨信号,并赋值为 +1。
- 如果价格低于 SMA,则视为看跌信号,并赋值为 -1。
- 当价格等于 SMA 时,信号为中性(0)。
组合信号
- 将三个单独的信号(每个时间周期一个)相加。
- 确定最终信号:
- 如果总和为 2 或更高,则表明有强烈的看涨势头。EA 返回“买入”信号。
- 如果总和为 -2 或更低,则表明有强烈的看跌势头。EA 返回“卖出”信号。
- 否则,信号为混合或中性,因此 EA 返回“中性”。
让我们查看下面的图表以更好地理解该过程。

图 1. 流程图
MQL5实现
在最顶部,您会注意到头部注释和 EA 的属性定义。这些行作为EA的基础数据,指定了其版权、版本,并将其链接到其来源。#property strict 指令用于强制执行更严格的编译规则,以帮助防止常见的编码错误。
//+------------------------------------------------------------------+
//|                                                 TrendLoom EA.mq5 |
//|                                  Copyright 2025, MetaQuotes Ltd. |
//|                                             https://www.mql5.com |
//+------------------------------------------------------------------+
#property copyright "Copyright 2025, MetaQuotes Ltd."
#property link      "https://www.mql5.com/en/users/lynnchris"
#property version   "1.00"
#property strict
接下来,代码包含了几个头文件,这些文件提供了对话框、按钮、标签和面板控件。它还引入了图表对象控件,用于在图表上显示文本。这种模块化的包含方式允许 EA 使用预构建的用户界面类。
这些 include 指令引用了您 MetaEditor 的 include 文件夹中的库。Controls 子文件夹中的文件提供了对话框和按钮的内置类。它们还提供了标签和面板的类。这种设计简化了构建交互界面的过程,无需重写代码。ChartObjects 子文件夹中的文件 (ChartObjectsTxtControls.mqh) 允许您在图表上显示动态文本。
#include <Controls/Dialog.mqh>
#include <Controls/Button.mqh>
#include <Controls/Label.mqh>
#include <Controls/Panel.mqh>
#include <ChartObjects/ChartObjectsTxtControls.mqh>  // Adjusted include path (singular folder)
然后,代码定义了用于文本对齐和颜色值的常量。这种做法提高了代码的清晰度和可维护性。
#ifndef ALIGN_LEFT
  #define ALIGN_LEFT   0
#endif
#ifndef ALIGN_CENTER
  #define ALIGN_CENTER 1
#endif
#ifndef ALIGN_RIGHT
  #define ALIGN_RIGHT  2
#endif

#define clrSilver 0xC0C0C0
EA 声明了输入参数,用于调整面板及其按钮的外观和位置。PanelX、PanelY 和 PanelWidth 设置了面板的几何形状,而颜色输入则定义了视觉主题。按钮的尺寸由 btnWidth、btnHeight 和 btnSpacing 控制,EA 允许您自定义布局和颜色。这种配置提供了灵活性,使您可以根据需要定制用户界面。
//---- Input parameters -----------------------------------------------
input int    PanelX               = 10;
input int    PanelY               = 10;
input int    PanelWidth           = 250;
input int    btnWidth             = 220;
input int    btnHeight            = 30;
input int    btnSpacing           = 5;

input color  PanelBackgroundColor = clrDimGray;
input color  PanelHeaderColor     = clrBlueViolet;
input color  ButtonBgColor        = clrBlack;
input color  ButtonTextColor      = clrBlueViolet;
input color  AnalysisTextColor    = clrLime;
数组用于存储按钮的名称和文本,这使得更新或添加新按钮变得快速而简单。这种设计将所有与按钮相关的信息集中在一处,因此修改只需进行微小的调整。它还提高了用户界面的一致性,并减少了出错的可能性。该方法为未来的增强提供了灵活性,并保持了代码的整洁和有序。
//---- Button Names and Texts (7 analysis options) --------------------
string buttonNames[7] =
  {
   "btnShortTerm",
   "btnScalping",
   "btnSwing",
   "btnTrend",
   "btnMTFTrend",
   "btnShortScalper",
   "btnLongTerm"
  };

string buttonTexts[7] =
  {
   "Short Term Focus\n(M1, M5, M15)",
   "Scalping/Intraday\n(M5, M15, H1)",
   "Swing Trading\n(M15, H1, H4)",
   "Trend Trading\n(H1, H4, D1)",
   "MTF Trend Confirm\n(H1, H4, W1)",
   "Short Scalper/Mid Trend\n(M5, H1, D1)",
   "Long Term Trend\n(H1, D1, W1)"
  };
全局宏定义了面板标题和分析标签的名称。这些宏确保了整个代码的一致性,并作为这些标识符的单一来源。通过集中管理这些名称,对面板组件的更新变得更加容易,并减少了拼写错误的风险。这种方法简化了维护工作,并确保了代码的一致性和清晰性。
// Global object names for panel header and analysis label
#define PANEL_BG "PanelBG"
#define PANEL_HEADER "PanelHeader"
#define ANALYSIS_LABEL "AnalysisResult"
接着,代码声明了两个辅助函数:GetSMA 用于计算简单移动平均线,AnalyzeTimeframes 用于执行跨多个时间周期的市场分析。这些函数构成了市场分析的核心逻辑。
//--- Helper function declarations
double GetSMA(string symbol, ENUM_TIMEFRAMES timeframe, int period, int shift);
string AnalyzeTimeframes(ENUM_TIMEFRAMES tf1, ENUM_TIMEFRAMES tf2, ENUM_TIMEFRAMES tf3);
自定义类 CTrendLoomPanel 继承自 CAppDialog。它将所有用户界面元素(如标题标签、主面板、按钮和结果标签)组合在一起。这种设计创建了一个模块化的界面,更易于管理和扩展。
创建面板
CreateTrendPanel 方法首先创建一个对话框窗口。然后,它设置一个带有自定义文本、颜色、字体大小和字体样式的标题标签。对齐方式通过 ObjectSetInteger 函数设置。
bool CreateTrendPanel(const long chart, const string name, const int x1, const int y1, const int x2, const int y2)
{
   if(!CAppDialog::Create(chart, name, 0, x1, y1, x2, y2))
   {
      Print("Failed to create TrendLoom dialog.");
      return false;
   }
   if(!m_lblHeader.Create(0, "TrendLoomHeader", 0, 10, 10, x2 - x1 - 20, 30))
   {
      Print("Failed to create header label.");
      return false;
   }
   m_lblHeader.Text("TrendLoom EA");
   m_lblHeader.Color(PanelHeaderColor);
   m_lblHeader.FontSize(14);
   m_lblHeader.Font("Segoe UI");
   Add(m_lblHeader);
   if(!ObjectSetInteger(0L, m_lblHeader.Name(), OBJPROP_ALIGN, (long)ALIGN_CENTER))
      Print("Failed to set header alignment");
该方法继续创建主面板并动态计算其尺寸。然后,它创建每个按钮并依次将它们定位。最后,在按钮下方添加一个结果标签,以显示分析输出信息。
处理事件
OnEvent 方法处理用户交互。当按钮被点击时,它会使用相应的时间周期参数调用 AnalyzeTimeframes。分析结果会在面板上更新,并显示一个警报。
bool OnEvent(const int id, const long &lparam, const double &dparam, const string &sparam)
{
   if(sparam == "btnShortTerm")
   {
      string res = AnalyzeTimeframes(PERIOD_M1, PERIOD_M5, PERIOD_M15);
      string out = "Short Term Focus: " + res;
      UpdateResults(out);
      Alert(out);
      return true;
   }
   else if(sparam == "btnScalping")
   {
      string res = AnalyzeTimeframes(PERIOD_M5, PERIOD_M15, PERIOD_H1);
      string out = "Scalping/Intraday: " + res;
      UpdateResults(out);
      Alert(out);
      return true;
   }
   // Additional conditions for other buttons
   return false;
}
更新用户界面
UpdateResults 方法使用新的分析数据刷新结果标签。然后,它调用 ChartRedraw,使更新的信息立即显示。
void UpdateResults(const string &result)
{
   m_lblResults.Text("Analysis Result: " + result);
   ChartRedraw();
}
核心分析函数
计算简单移动平均线 (SMA)
GetSMA 函数通过使用 iMA 函数创建一个指标句柄来计算 SMA。它从指标缓冲区复制 SMA 值,然后释放该句柄以释放资源。
double GetSMA(string symbol, ENUM_TIMEFRAMES timeframe, int period, int shift)
{
   int handle = iMA(symbol, timeframe, period, 0, MODE_SMA, PRICE_CLOSE);
   if(handle == INVALID_HANDLE)
   {
      Print("Failed to create iMA handle for timeframe ", timeframe);
      return 0.0;
   }
   double sma[];
   if(CopyBuffer(handle, 0, shift, 1, sma) <= 0)
   {
      Print("Failed to copy buffer for timeframe ", timeframe);
      IndicatorRelease(handle);
      return 0.0;
   }
   double result = sma[0];
   IndicatorRelease(handle);
   return result;
}
分析多个时间周期
AnalyzeTimeframes 函数获取三个时间周期的收盘价和 SMA,当价格高于 SMA 时分配看涨信号,当价格低于 SMA 时分配看跌信号。它将各个信号相加,以产生最终建议:当总和为 2 或更高时为“买入”,当总和为 -2 或更低时为“卖出”,否则为“中性”。每个时间周期被独立评估,以捕捉市场趋势的平衡视图,而 shift 参数确保只使用最后完成的 K 线进行分析。结合来自多个时间周期的信号可以减少短暂市场噪音的影响,而调整 SMA 周期可以进一步优化交易信号的敏感性。
string AnalyzeTimeframes(ENUM_TIMEFRAMES tf1, ENUM_TIMEFRAMES tf2, ENUM_TIMEFRAMES tf3)
{
   int period = 50;
   int shift  = 1; // last completed candle

   double price1 = iClose(_Symbol, tf1, shift);
   double sma1   = GetSMA(_Symbol, tf1, period, shift);
   int signal1   = (price1 > sma1) ? 1 : (price1 < sma1 ? -1 : 0);

   double price2 = iClose(_Symbol, tf2, shift);
   double sma2   = GetSMA(_Symbol, tf2, period, shift);
   int signal2   = (price2 > sma2) ? 1 : (price2 < sma2 ? -1 : 0);

   double price3 = iClose(_Symbol, tf3, shift);
   double sma3   = GetSMA(_Symbol, tf3, period, shift);
   int signal3   = (price3 > sma3) ? 1 : (price3 < sma3 ? -1 : 0);

   int sum = signal1 + signal2 + signal3;
   if(sum >= 2)
      return "BUY";
   else if(sum <= -2)
      return "SELL";
   else
      return "NEUTRAL";
}
EA的生命周期函数用于处理初始化、清理资源和事件处理。OnInit 函数使用输入参数创建 TrendLoom 面板。如果面板创建失败,EA 将返回一个初始化错误。
int OnInit()
{
   if(!TrendPanel.CreateTrendPanel(0, "TrendLoom Panel", PanelX, PanelY, PanelX + PanelWidth + 20, PanelY + 400))
   {
      Print("Failed to create TrendLoom Panel.");
      return INIT_FAILED;
   }
   return INIT_SUCCEEDED;
}
OnDeinit 函数在 EA 被移除或图表关闭时,通过销毁面板来进行清理。
void OnDeinit(const int reason)
{
   TrendPanel.Destroy(reason);
}
最后,OnChartEvent 函数将图表事件转发给面板的事件处理器,以确保界面保持响应。
void OnChartEvent(const int id, const long &lparam, const double &dparam, const string &sparam)
{
   TrendPanel.ChartEvent(id, lparam, dparam, sparam);
}
在您的 MetaEditor 中,所需的文件存储在 include 文件夹中。要访问代码片段中所示的指定文件,请参考下图所示的子文件夹。这种组织结构确保编译器能够在 include/Controls 文件夹中找到对话框、按钮、标签和面板控件文件,并在 include/ChartObjects 文件夹中找到图表对象控件文件。
#include <Controls/Dialog.mqh>
#include <Controls/Button.mqh>
#include <Controls/Label.mqh>
#include <Controls/Panel.mqh>
#include <ChartObjects/ChartObjectsTxtControls.mqh>  // Adjusted include path (singular folder)
步骤 1
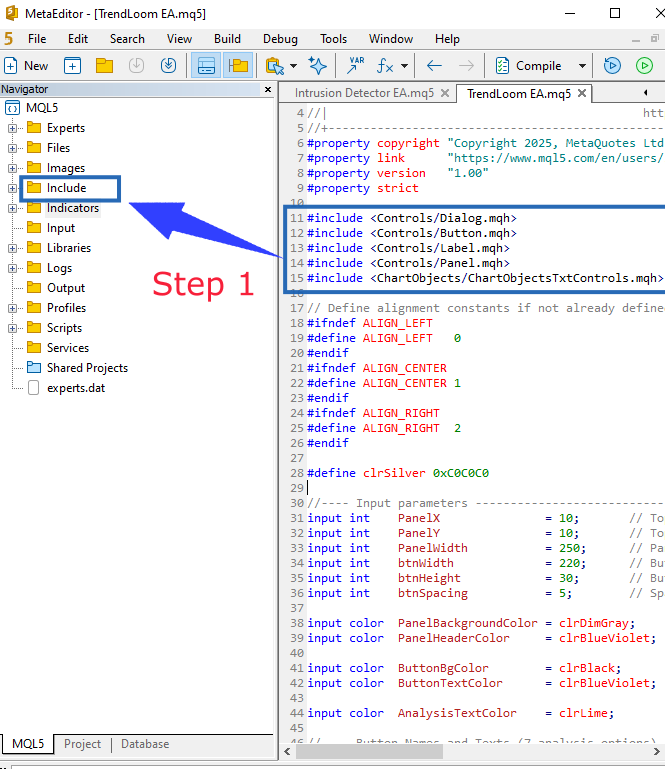
图 2. 步骤 1
步骤 2
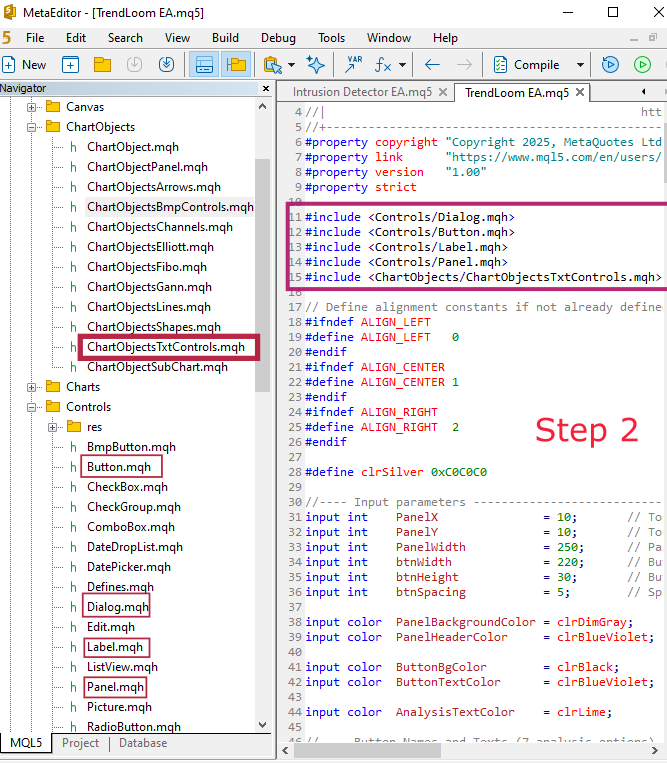
图 3. 步骤 2
MQL5代码
//+------------------------------------------------------------------+
//|                                                 TrendLoom EA.mq5 |
//|                                  Copyright 2025, MetaQuotes Ltd. |
//|                                             https://www.mql5.com |
//+------------------------------------------------------------------+
#property copyright "Copyright 2025, MetaQuotes Ltd."
#property link      "https://www.mql5.com/en/users/lynnchris"
#property version   "1.00"
#property strict

#include <Controls/Dialog.mqh>
#include <Controls/Button.mqh>
#include <Controls/Label.mqh>
#include <Controls/Panel.mqh>
#include <ChartObjects/ChartObjectsTxtControls.mqh>  // Adjusted include path (singular folder)

// Define alignment constants if not already defined
#ifndef ALIGN_LEFT
#define ALIGN_LEFT   0
#endif
#ifndef ALIGN_CENTER
#define ALIGN_CENTER 1
#endif
#ifndef ALIGN_RIGHT
#define ALIGN_RIGHT  2
#endif

#define clrSilver 0xC0C0C0

//---- Input parameters -----------------------------------------------
input int    PanelX               = 10;       // Top-left X coordinate of panel
input int    PanelY               = 10;       // Top-left Y coordinate of panel
input int    PanelWidth           = 250;      // Panel width (for longer text)
input int    btnWidth             = 220;      // Button width
input int    btnHeight            = 30;       // Button height
input int    btnSpacing           = 5;        // Spacing between buttons

input color  PanelBackgroundColor = clrDimGray;     // Panel background color
input color  PanelHeaderColor     = clrBlueViolet;  // Panel header text color

input color  ButtonBgColor        = clrBlack;       // Button background color
input color  ButtonTextColor      = clrBlueViolet;  // Button text color

input color  AnalysisTextColor    = clrLime;        // Analysis result text color

//---- Button Names and Texts (7 analysis options) --------------------
string buttonNames[7] =
  {
   "btnShortTerm",
   "btnScalping",
   "btnSwing",
   "btnTrend",
   "btnMTFTrend",
   "btnShortScalper",
   "btnLongTerm"
  };

string buttonTexts[7] =
  {
   "Short Term Focus\n(M1, M5, M15)",
   "Scalping/Intraday\n(M5, M15, H1)",
   "Swing Trading\n(M15, H1, H4)",
   "Trend Trading\n(H1, H4, D1)",
   "MTF Trend Confirm\n(H1, H4, W1)",
   "Short Scalper/Mid Trend\n(M5, H1, D1)",
   "Long Term Trend\n(H1, D1, W1)"
  };

// Global object names for panel header and analysis label
#define PANEL_BG "PanelBG"
#define PANEL_HEADER "PanelHeader"
#define ANALYSIS_LABEL "AnalysisResult"

//--- Helper function declarations
double GetSMA(string symbol, ENUM_TIMEFRAMES timeframe, int period, int shift);
string AnalyzeTimeframes(ENUM_TIMEFRAMES tf1, ENUM_TIMEFRAMES tf2, ENUM_TIMEFRAMES tf3);

//------------------------------------------------------------------------------
// CTrendLoomPanel class - A modern, modular panel for TrendLoom EA
//------------------------------------------------------------------------------
class CTrendLoomPanel : public CAppDialog
  {
private:
   CLabel            m_lblHeader;
   CPanel            m_panelMain;
   CButton           m_btnShortTerm;
   CButton           m_btnScalping;
   CButton           m_btnSwing;
   CButton           m_btnTrend;
   CButton           m_btnMTFTrend;
   CButton           m_btnShortScalper;
   CButton           m_btnLongTerm;
   CLabel            m_lblResults;

public:
   // Create the TrendLoom Panel dialog
   bool              CreateTrendPanel(const long chart, const string name, const int x1, const int y1, const int x2, const int y2)
     {
      if(!CAppDialog::Create(chart, name, 0, x1, y1, x2, y2))
        {
         Print("Failed to create TrendLoom dialog.");
         return false;
        }
      // Create header label
      if(!m_lblHeader.Create(0, "TrendLoomHeader", 0, 10, 10, x2 - x1 - 20, 30))
        {
         Print("Failed to create header label.");
         return false;
        }
      m_lblHeader.Text("TrendLoom EA");
      m_lblHeader.Color(PanelHeaderColor);
      m_lblHeader.FontSize(14);
      m_lblHeader.Font("Segoe UI");
      Add(m_lblHeader);
      // Set header text alignment to center using ObjectSetInteger
      if(!ObjectSetInteger(0L, m_lblHeader.Name(), OBJPROP_ALIGN, (long)ALIGN_CENTER))
         Print("Failed to set header alignment");

      // Create main panel background
      int panelBottom = 50 + (btnHeight + btnSpacing) * 7 + btnSpacing;
      if(!m_panelMain.Create(0, "TrendLoomPanel", 0, 10, 50, x2 - x1 - 10, panelBottom))
        {
         Print("Failed to create main panel.");
         return false;
        }
      m_panelMain.Color(PanelBackgroundColor);
      m_panelMain.BorderType(BORDER_RAISED);
      m_panelMain.ColorBorder(clrSilver);
      Add(m_panelMain);

      // Starting coordinates for buttons
      int btnX = 20; // relative to dialog
      int btnY = 60;
      int buttonWidth = btnWidth;
      int buttonHeight = btnHeight;

      // Create each button with a modern look
      if(!m_btnShortTerm.Create(0, buttonNames[0], 0, btnX, btnY, btnX + buttonWidth, btnY + buttonHeight))
         return false;
      m_btnShortTerm.Text(buttonTexts[0]);
      m_btnShortTerm.Font("Segoe UI");
      m_btnShortTerm.FontSize(12);
      m_btnShortTerm.Color(ButtonBgColor);
      Add(m_btnShortTerm);
      btnY += buttonHeight + btnSpacing;

      if(!m_btnScalping.Create(0, buttonNames[1], 0, btnX, btnY, btnX + buttonWidth, btnY + buttonHeight))
         return false;
      m_btnScalping.Text(buttonTexts[1]);
      m_btnScalping.Font("Segoe UI");
      m_btnScalping.FontSize(12);
      m_btnScalping.Color(ButtonBgColor);
      Add(m_btnScalping);
      btnY += buttonHeight + btnSpacing;

      if(!m_btnSwing.Create(0, buttonNames[2], 0, btnX, btnY, btnX + buttonWidth, btnY + buttonHeight))
         return false;
      m_btnSwing.Text(buttonTexts[2]);
      m_btnSwing.Font("Segoe UI");
      m_btnSwing.FontSize(12);
      m_btnSwing.Color(ButtonBgColor);
      Add(m_btnSwing);
      btnY += buttonHeight + btnSpacing;

      if(!m_btnTrend.Create(0, buttonNames[3], 0, btnX, btnY, btnX + buttonWidth, btnY + buttonHeight))
         return false;
      m_btnTrend.Text(buttonTexts[3]);
      m_btnTrend.Font("Segoe UI");
      m_btnTrend.FontSize(12);
      m_btnTrend.Color(ButtonBgColor);
      Add(m_btnTrend);
      btnY += buttonHeight + btnSpacing;

      if(!m_btnMTFTrend.Create(0, buttonNames[4], 0, btnX, btnY, btnX + buttonWidth, btnY + buttonHeight))
         return false;
      m_btnMTFTrend.Text(buttonTexts[4]);
      m_btnMTFTrend.Font("Segoe UI");
      m_btnMTFTrend.FontSize(12);
      m_btnMTFTrend.Color(ButtonBgColor);
      Add(m_btnMTFTrend);
      btnY += buttonHeight + btnSpacing;

      if(!m_btnShortScalper.Create(0, buttonNames[5], 0, btnX, btnY, btnX + buttonWidth, btnY + buttonHeight))
         return false;
      m_btnShortScalper.Text(buttonTexts[5]);
      m_btnShortScalper.Font("Segoe UI");
      m_btnShortScalper.FontSize(12);
      m_btnShortScalper.Color(ButtonBgColor);
      Add(m_btnShortScalper);
      btnY += buttonHeight + btnSpacing;

      if(!m_btnLongTerm.Create(0, buttonNames[6], 0, btnX, btnY, btnX + buttonWidth, btnY + buttonHeight))
         return false;
      m_btnLongTerm.Text(buttonTexts[6]);
      m_btnLongTerm.Font("Segoe UI");
      m_btnLongTerm.FontSize(12);
      m_btnLongTerm.Color(ButtonBgColor);
      Add(m_btnLongTerm);
      btnY += buttonHeight + btnSpacing;

      // Create results label below the buttons
      if(!m_lblResults.Create(0, "TrendResults", 0, btnX, btnY, btnX + buttonWidth, btnY + 30))
         return false;
      m_lblResults.Text("Analysis Result: [Waiting for Input]");
      m_lblResults.Font("Segoe UI");
      m_lblResults.FontSize(12);
      m_lblResults.Color(AnalysisTextColor);
      Add(m_lblResults);
      // Set results text alignment to left using ObjectSetInteger
      if(!ObjectSetInteger(0L, m_lblResults.Name(), OBJPROP_ALIGN, (long)ALIGN_LEFT))
         Print("Failed to set results alignment");

      Show();
      return true;
     }

   // Process events (button clicks)
   bool              OnEvent(const int id, const long &lparam, const double &dparam, const string &sparam)
     {
      if(sparam == "btnShortTerm")
        {
         string res = AnalyzeTimeframes(PERIOD_M1, PERIOD_M5, PERIOD_M15);
         string out = "Short Term Focus: " + res;
         UpdateResults(out);
         Alert(out);
         return true;
        }
      else
         if(sparam == "btnScalping")
           {
            string res = AnalyzeTimeframes(PERIOD_M5, PERIOD_M15, PERIOD_H1);
            string out = "Scalping/Intraday: " + res;
            UpdateResults(out);
            Alert(out);
            return true;
           }
         else
            if(sparam == "btnSwing")
              {
               string res = AnalyzeTimeframes(PERIOD_M15, PERIOD_H1, PERIOD_H4);
               string out = "Swing Trading: " + res;
               UpdateResults(out);
               Alert(out);
               return true;
              }
            else
               if(sparam == "btnTrend")
                 {
                  string res = AnalyzeTimeframes(PERIOD_H1, PERIOD_H4, PERIOD_D1);
                  string out = "Trend Trading: " + res;
                  UpdateResults(out);
                  Alert(out);
                  return true;
                 }
               else
                  if(sparam == "btnMTFTrend")
                    {
                     string res = AnalyzeTimeframes(PERIOD_H1, PERIOD_H4, PERIOD_W1);
                     string out = "MTF Trend Confirm: " + res;
                     UpdateResults(out);
                     Alert(out);
                     return true;
                    }
                  else
                     if(sparam == "btnShortScalper")
                       {
                        string res = AnalyzeTimeframes(PERIOD_M5, PERIOD_H1, PERIOD_D1);
                        string out = "Short Scalper/Mid Trend: " + res;
                        UpdateResults(out);
                        Alert(out);
                        return true;
                       }
                     else
                        if(sparam == "btnLongTerm")
                          {
                           string res = AnalyzeTimeframes(PERIOD_H1, PERIOD_D1, PERIOD_W1);
                           string out = "Long Term Trend: " + res;
                           UpdateResults(out);
                           Alert(out);
                           return true;
                          }
      return false;
     }

   bool              ChartEvent(const int id, const long &lparam, const double &dparam, const string &sparam)
     {
      return OnEvent(id, lparam, dparam, sparam);
     }

   // Update the results label and refresh the chart
   void              UpdateResults(const string &result)
     {
      m_lblResults.Text("Analysis Result: " + result);
      ChartRedraw();
     }
  };

// Global instance of the TrendLoom Panel
CTrendLoomPanel TrendPanel;

//------------------------------------------------------------------------------
// Helper functions (core analysis logic)
//------------------------------------------------------------------------------
double GetSMA(string symbol, ENUM_TIMEFRAMES timeframe, int period, int shift)
  {
   int handle = iMA(symbol, timeframe, period, 0, MODE_SMA, PRICE_CLOSE);
   if(handle == INVALID_HANDLE)
     {
      Print("Failed to create iMA handle for timeframe ", timeframe);
      return 0.0;
     }
   double sma[];  // dynamic array to store SMA values
   if(CopyBuffer(handle, 0, shift, 1, sma) <= 0)
     {
      Print("Failed to copy buffer for timeframe ", timeframe);
      IndicatorRelease(handle);
      return 0.0;
     }
   double result = sma[0];
   IndicatorRelease(handle);
   return result;
  }

//+------------------------------------------------------------------+
//|                                                                  |
//+------------------------------------------------------------------+
string AnalyzeTimeframes(ENUM_TIMEFRAMES tf1, ENUM_TIMEFRAMES tf2, ENUM_TIMEFRAMES tf3)
  {
   int period = 50;
   int shift  = 1; // last completed candle

   double price1 = iClose(_Symbol, tf1, shift);
   double sma1   = GetSMA(_Symbol, tf1, period, shift);
   int signal1   = (price1 > sma1) ? 1 : (price1 < sma1 ? -1 : 0);

   double price2 = iClose(_Symbol, tf2, shift);
   double sma2   = GetSMA(_Symbol, tf2, period, shift);
   int signal2   = (price2 > sma2) ? 1 : (price2 < sma2 ? -1 : 0);

   double price3 = iClose(_Symbol, tf3, shift);
   double sma3   = GetSMA(_Symbol, tf3, period, shift);
   int signal3   = (price3 > sma3) ? 1 : (price3 < sma3 ? -1 : 0);

   int sum = signal1 + signal2 + signal3;
   if(sum >= 2)
      return "BUY";
   else
      if(sum <= -2)
         return "SELL";
      else
         return "NEUTRAL";
  }

//+------------------------------------------------------------------+
//| Expert initialization function                                   |
//+------------------------------------------------------------------+
int OnInit()
  {
   if(!TrendPanel.CreateTrendPanel(0, "TrendLoom Panel", PanelX, PanelY, PanelX + PanelWidth + 20, PanelY + 400))
     {
      Print("Failed to create TrendLoom Panel.");
      return INIT_FAILED;
     }
   return INIT_SUCCEEDED;
  }

//+------------------------------------------------------------------+
//| Expert deinitialization function                                 |
//+------------------------------------------------------------------+
void OnDeinit(const int reason)
  {
   TrendPanel.Destroy(reason);
  }

//+------------------------------------------------------------------+
//| Chart Event Handler                                              |
//+------------------------------------------------------------------+
void OnChartEvent(const int id, const long &lparam, const double &dparam, const string &sparam)
  {
   TrendPanel.ChartEvent(id, lparam, dparam, sparam);
  }
//+------------------------------------------------------------------+
结果
对于每一位交易者来说,在实盘交易中使用系统之前进行彻底测试是至关重要的。测试包括在历史数据上进行回测,以查看系统在不冒任何资金风险的情况下本会有怎样的表现。您也可以使用模拟实盘账户来实时观察其实际表现。这个过程有助于您微调和开发一个更可靠的工具,让您可以自信地在实盘账户上使用。就我个人而言,我更喜欢花费大量时间来测试和完善 EA,以获得更稳健的结果。
在本节中,我将展示 EA 在图表上运行的测试结果。我在 Volatility 75 (1s) 上进行了测试,它表现出了出色的盈利能力。每个按钮都按预期工作,当您按下按钮时,分析结果几乎会立即更新。让我们回顾下面的第一个测试。
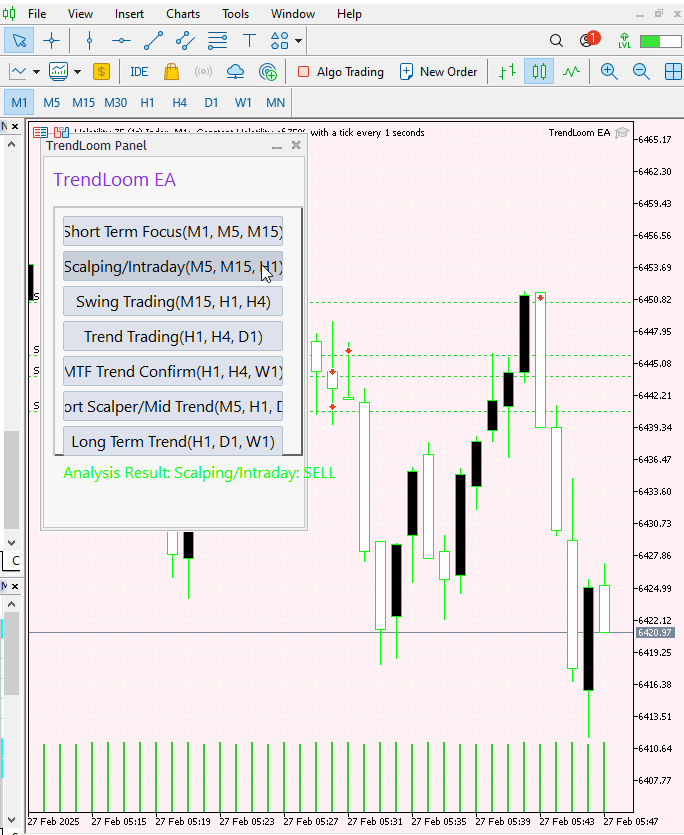
图 4. Volatility 75 (1s) 测试
下图说明了在根据提供的信号执行交易后市场的行为。此图延续了上面 GIF 中显示的交易。我使用 M1 时间周期来提供更广泛的交易视图。
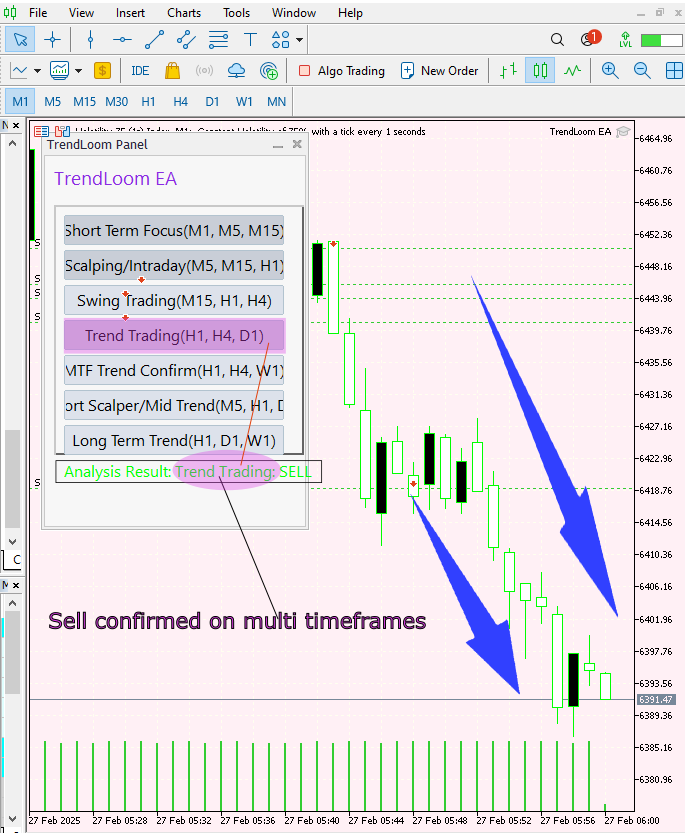
图 5. V 75 (1s) 测试
结论
在创建并测试了该 EA 后,我可以自信地确认它对市场分析产生了积极的影响。其快速的信号处理和整体趋势评估在波动率指数上产生了强大的效果。然而,该工具是作为一种辅助工具,而不是最终的信号提供者。我鼓励您对其进行彻底测试,并根据您的偏好调整参数。您也可以进一步修改它,以自定义按钮的外观。用它来确认您的整体策略,我已经看到它在这方面是有效的。
| 日期 | 工具名称 | 说明 | 版本 | 更新 | 提示 |
|---|---|---|---|---|---|
| 01/10/24 | 图表投影仪 | 用于叠加前一天价格走势(带“幽灵”效果)的脚本。 | 1.0 | 首次发布 | 工具1 |
| 18/11/24 | 分析评论 | 它以表格形式提供前一日的市场信息,并预测市场的未来走向。 | 1.0 | 首次发布 | 工具2 |
| 27/11/24 | 分析大师 | 市场指标每两小时定期更新 | 1.01 | 第二版 | 工具3 |
| 02/12/24 | 分析预测器 | 每两小时定期更新市场指标,并集成Telegram推送功能。 | 1.1 | 第三版 | 工具4 |
| 09/12/24 | 波动性导航工具 | 该EA使用布林带、RSI和ATR指标分析市场状况。 | 1.0 | 首次发布 | 工具5 |
| 19/12/24 | 均值回归信号收割器 | 使用均值回归策略分析市场并提供信号 | 1.0 | 首次发布 | 工具6 |
| 9/01/25 | 信号脉冲 | 多时间框架分析器 | 1.0 | 首次发布 | 工具7 |
| 17/01/25 | 指标看板 | 带按钮的分析面板 | 1.0 | 首次发布 | 工具8 |
| 21/01/25 | 外部资金流 | 通过外部库进行分析 | 1.0 | 首次发布 | 工具9 |
| 27/01/25 | VWAP | 成交量加权平均价格 | 1.3 | 首次发布 | 工具10 |
| 02/02/25 | Heikin Ashi | 势平滑与反转信号识别 | 1.0 | 首次发布 | 工具11 |
| 04/02/25 | FibVWAP | 通过 Python 分析生成信号 | 1.0 | 首次发布 | 工具12 |
| 14/02/25 | RSI 背离 | 价格走势与 RSI 背离的对比 | 1.0 | 首次发布 | 工具13 |
| 17/02/25 | 抛物线转向与反转 (PSAR) | 自动化PSAR策略 | 1.0 | 首次发布 | 工具14 |
| 20/02/25 | 四分位绘制脚本 | 在图表上绘制四分位水平线 | 1.0 | 首次发布 | 工具15 |
| 27/02/25 | 侵入检测器 | 当价格触及四分位水平时进行检测和警报 | 1.0 | 首次发布 | 工具16 |
| 27/02/25 | TrendLoom工具 | 多时间周期分析面板 | 1.0 | 首次发布 | 工具17 |
本文由MetaQuotes Ltd译自英文
原文地址: https://www.mql5.com/en/articles/17329
注意: MetaQuotes Ltd.将保留所有关于这些材料的权利。全部或部分复制或者转载这些材料将被禁止。
本文由网站的一位用户撰写,反映了他们的个人观点。MetaQuotes Ltd 不对所提供信息的准确性负责,也不对因使用所述解决方案、策略或建议而产生的任何后果负责。


哇,太棒了,我可以看出你为此付出了很多努力,感谢你分享了你的方法和代码。