价格行为分析工具包开发(第八部分):指标看板
内容
概述
在我们本系列文章的早期阶段,我们发布了一篇题为《分析大师》的文章,探讨了获取和可视化前一日市场指标的方法。这项基础性工作为开发更复杂的工具奠定了基础。我们很高兴推出了指标面板智能交易系统(EA),这是一款创新且高品质的解决方案,能在MetaTrader 5交易平台内革新市场分析方式。这款工具作为一个无缝集成式应用程序运行,其界面简洁流畅,配备了用于高级分析的专用按钮,具体包括:
- 高低点分析:轻松检测关键价格水平,以评估市场趋势并识别潜在的反转点。
- 成交量分析:分析交易量,以评估市场参与度和流动性状况。
- 趋势分析:通过精确的指标评估方向性强度和持续性。
- 波动率分析:量化市场波动,以制定适合不同交易环境的策略。
- 移动平均线分析:监测动态价格趋势,以更清晰地了解市场行为。
- 支撑/阻力分析:识别关键价格水平,以优化入场、出场和风险管理策略。
每个按钮只需轻松一点,即可提供实时数据,瞬间将复杂的市场数据转化为有价值的见解。指标面板EA由先进算法驱动,确保高速且准确的计算,满足专业交易者的需求。通过使用这款工具,交易者能够将复杂的市场数据转化为简单且有价值的见解。这款EA是那些旨在优化交易策略人士的关键资源。
系统概况
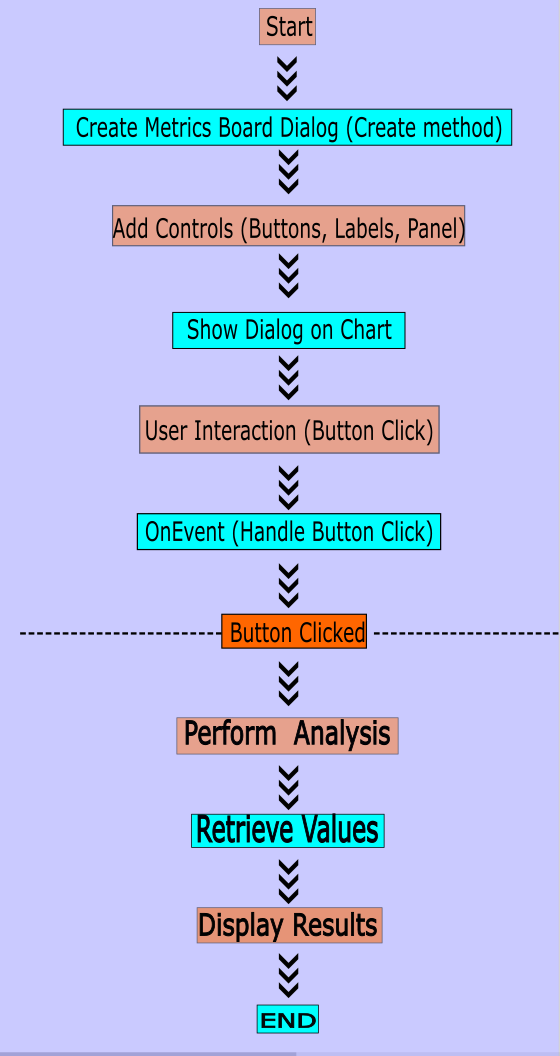
在本节中,我将简要概述系统逻辑。有关步骤的详细说明,请参见代码解析与实现部分。下面让我们逐步分解:
- 类设置:该类创建一个带有不同分析按钮的对话框。
- 事件处理:点击按钮会触发相应的分析方法。
- 分析与展示:在面板中处理并展示市场数据。
- 关闭操作:“关闭”按钮允许用户关闭指标面板。

图例1. EA逻辑概要
MQL5代码
//+------------------------------------------------------------------+
//|                                                Metrics Board.mql5|
//|                                Copyright 2025, Christian Benjamin|
//|                                              https://www.mql5.com|
//+------------------------------------------------------------------+
#property copyright "2025, MetaQuotes Software Corp."
#property link      "https://www.mql5.com/en/users/lynnchris"
#property version   "1.0"
#property strict

#include <Trade\Trade.mqh>
#include <Controls\Dialog.mqh>
#include <Controls\Button.mqh>
#include <Controls\Label.mqh>
#include <Controls\Panel.mqh>

// Metrics Board Class
class CMetricsBoard : public CAppDialog
  {
private:
   CButton           m_btnClose; // Close Button
   CButton           m_btnHighLowAnalysis;
   CButton           m_btnVolumeAnalysis;
   CButton           m_btnTrendAnalysis;
   CButton           m_btnVolatilityAnalysis;
   CButton           m_btnMovingAverage;
   CButton           m_btnSupportResistance;
   CPanel            m_panelResults;
   CLabel            m_lblResults;

public:
                     CMetricsBoard(void);
                    ~CMetricsBoard(void);
   virtual bool      Create(const long chart, const string name, const int subwin, const int x1, const int y1, const int x2, const int y2);
   virtual void      Minimize();
   virtual bool      Run(); // Declaration of Run method
   virtual bool      OnEvent(const int id, const long &lparam, const double &dparam, const string &sparam);
   virtual bool      ChartEvent(const int id, const long &lparam, const double &dparam, const string &sparam);
   virtual void      Destroy(const int reason = REASON_PROGRAM); // Override Destroy method

private:
   bool              CreateButtons(void);
   bool              CreateResultsPanel(void);
   void              OnClickButtonClose(); // New close button handler
   void              PerformHighLowAnalysis(void);
   void              PerformVolumeAnalysis(void);
   void              PerformTrendAnalysis(void);
   void              PerformVolatilityAnalysis(void);
   void              PerformMovingAverageAnalysis(void);
   void              PerformSupportResistanceAnalysis(void);
   double            CalculateMovingAverage(int period);
  };

CMetricsBoard::CMetricsBoard(void) {}

CMetricsBoard::~CMetricsBoard(void) {}

// Override Destroy method
void CMetricsBoard::Destroy(const int reason)
  {
// Call base class Destroy method to release resources
   CAppDialog::Destroy(reason);
  }

//+------------------------------------------------------------------+
//| Create a control dialog                                          |
//+------------------------------------------------------------------+
bool CMetricsBoard::Create(const long chart, const string name, const int subwin, const int x1, const int y1, const int x2, const int y2)
  {
   if(!CAppDialog::Create(chart, name, subwin, x1, y1, x2, y2))
     {
      Print("Failed to create CAppDialog instance.");
      return false; // Failed to create the dialog
     }

   if(!CreateResultsPanel())
     {
      Print("Failed to create results panel.");
      return false; // Failed to create the results panel
     }

   if(!CreateButtons())
     {
      Print("Failed to create buttons.");
      return false; // Failed to create buttons
     }

   Show(); // Show the dialog after creation
   return true; // Successfully created the dialog
  }

//+------------------------------------------------------------------+
//| Minimize the control window                                      |
//+------------------------------------------------------------------+
void CMetricsBoard::Minimize()
  {
   CAppDialog::Minimize();
  }

//+------------------------------------------------------------------+
//| Run the control.                                                 |
//+------------------------------------------------------------------+
bool CMetricsBoard::Run()
  {
// Assuming Run makes the dialog functional
   if(!Show())
     {
      Print("Failed to show the control.");
      return false; // Could not show the control
     }
// Additional initialization or starting logic can be added here
   return true; // Successfully run the control
  }

//+------------------------------------------------------------------+
//| Create the results panel                                         |
//+------------------------------------------------------------------+
bool CMetricsBoard::CreateResultsPanel(void)
  {
   if(!m_panelResults.Create(0, "ResultsPanel", 0, 10, 10, 330, 60))
      return false;

   m_panelResults.Color(clrLightGray);
   Add(m_panelResults);

   if(!m_lblResults.Create(0, "ResultsLabel", 0, 15, 15, 315, 30))
      return false;

   m_lblResults.Text("Results will be displayed here.");
   m_lblResults.Color(clrBlack);
   m_lblResults.FontSize(12);
   Add(m_lblResults);

   return true;
  }

//+------------------------------------------------------------------+
//| Create buttons for the panel                                     |
//+------------------------------------------------------------------+
bool CMetricsBoard::CreateButtons(void)
  {
   int x = 20;
   int y = 80;
   int buttonWidth = 300;
   int buttonHeight = 30;
   int spacing = 15;

// Create Close Button
   if(!m_btnClose.Create(0, "CloseButton", 0, x, y, x + buttonWidth, y + buttonHeight))
      return false;

   m_btnClose.Text("Close Panel");
   Add(m_btnClose);
   y += buttonHeight + spacing;

   struct ButtonData
     {
      CButton        *button;
      string         name;
      string         text;
     };

   ButtonData buttons[] =
     {
        {&m_btnHighLowAnalysis, "HighLowButton", "High/Low Analysis"},
        {&m_btnVolumeAnalysis, "VolumeButton", "Volume Analysis"},
        {&m_btnTrendAnalysis, "TrendButton", "Trend Analysis"},
        {&m_btnVolatilityAnalysis, "VolatilityButton", "Volatility Analysis"},
        {&m_btnMovingAverage, "MovingAverageButton", "Moving Average"},
        {&m_btnSupportResistance, "SupportResistanceButton", "Support/Resistance"}
     };

   for(int i = 0; i < ArraySize(buttons); i++)
     {
      if(!buttons[i].button.Create(0, buttons[i].name, 0, x, y, x + buttonWidth, y + buttonHeight))
         return false;

      buttons[i].button.Text(buttons[i].text);
      Add(buttons[i].button);
      y += buttonHeight + spacing;
     }

   return true;
  }

//+------------------------------------------------------------------+
//| Handle events for button clicks                                  |
//+------------------------------------------------------------------+
bool CMetricsBoard::OnEvent(const int id, const long &lparam, const double &dparam, const string &sparam)
  {
   if(id == CHARTEVENT_OBJECT_CLICK)
     {
      Print("Event ID: ", id, ", Event parameter (sparam): ", sparam);

      if(sparam == "CloseButton") // Handle close button click
        {
         OnClickButtonClose(); // Call to new close button handler
         return true; // Event processed
        }
      else
         if(sparam == "HighLowButton")
           {
            Print("High/Low Analysis Button Clicked");
            m_lblResults.Text("Performing High/Low Analysis...");
            PerformHighLowAnalysis();
            return true; // Event processed
           }
         else
            if(sparam == "VolumeButton")
              {
               Print("Volume Analysis Button Clicked");
               m_lblResults.Text("Performing Volume Analysis...");
               PerformVolumeAnalysis();
               return true; // Event processed
              }
            else
               if(sparam == "TrendButton")
                 {
                  Print("Trend Analysis Button Clicked");
                  m_lblResults.Text("Performing Trend Analysis...");
                  PerformTrendAnalysis();
                  return true; // Event processed
                 }
               else
                  if(sparam == "VolatilityButton")
                    {
                     Print("Volatility Analysis Button Clicked");
                     m_lblResults.Text("Performing Volatility Analysis...");
                     PerformVolatilityAnalysis();
                     return true; // Event processed
                    }
                  else
                     if(sparam == "MovingAverageButton")
                       {
                        Print("Moving Average Analysis Button Clicked");
                        m_lblResults.Text("Calculating Moving Average...");
                        PerformMovingAverageAnalysis();
                        return true; // Event processed
                       }
                     else
                        if(sparam == "SupportResistanceButton")
                          {
                           Print("Support/Resistance Analysis Button Clicked");
                           m_lblResults.Text("Calculating Support/Resistance...");
                           PerformSupportResistanceAnalysis();
                           return true; // Event processed
                          }
     }

   return false; // If we reach here, the event was not processed
  }

//+------------------------------------------------------------------+
//| Handle chart events                                              |
//+------------------------------------------------------------------+
bool CMetricsBoard::ChartEvent(const int id, const long &lparam, const double &dparam, const string &sparam)
  {
   Print("ChartEvent ID: ", id, ", lparam: ", lparam, ", dparam: ", dparam, ", sparam: ", sparam);

   if(id == CHARTEVENT_OBJECT_CLICK)
     {
      return OnEvent(id, lparam, dparam, sparam);
     }

   return false;
  }

//+------------------------------------------------------------------+
//| Analysis operations                                              |
//+------------------------------------------------------------------+
void CMetricsBoard::PerformHighLowAnalysis(void)
  {
   double high = iHigh(Symbol(), PERIOD_H1, 0);
   double low = iLow(Symbol(), PERIOD_H1, 0);

   Print("Retrieved High: ", high, ", Low: ", low);

   if(high == 0 || low == 0)
     {
      m_lblResults.Text("Failed to retrieve high/low values.");
      return;
     }

   string result = StringFormat("High: %.5f, Low: %.5f", high, low);
   m_lblResults.Text(result);
  }

//+------------------------------------------------------------------+
//|                                                                  |
//+------------------------------------------------------------------+
void CMetricsBoard::PerformVolumeAnalysis(void)
  {
   double volume = iVolume(Symbol(), PERIOD_H1, 0);
   Print("Retrieved Volume: ", volume);

   if(volume < 0)
     {
      m_lblResults.Text("Failed to retrieve volume.");
      return;
     }

   string result = StringFormat("Volume (Last Hour): %.1f", volume);
   m_lblResults.Text(result);
  }

//+------------------------------------------------------------------+
//|                                                                  |
//+------------------------------------------------------------------+
void CMetricsBoard::PerformTrendAnalysis(void)
  {
   double ma = CalculateMovingAverage(14);
   Print("Calculated 14-period MA: ", ma);

   if(ma <= 0)
     {
      m_lblResults.Text("Not enough data for moving average calculation.");
      return;
     }

   string result = StringFormat("14-period MA: %.5f", ma);
   m_lblResults.Text(result);
  }

//+------------------------------------------------------------------+
//|                                                                  |
//+------------------------------------------------------------------+
void CMetricsBoard::PerformVolatilityAnalysis(void)
  {
   int atr_period = 14;
   int atr_handle = iATR(Symbol(), PERIOD_H1, atr_period);

   if(atr_handle == INVALID_HANDLE)
     {
      m_lblResults.Text("Failed to get ATR handle.");
      return;
     }

   double atr_value[];
   if(CopyBuffer(atr_handle, 0, 0, 1, atr_value) < 0)
     {
      m_lblResults.Text("Failed to copy ATR value.");
      IndicatorRelease(atr_handle);
      return;
     }

   string result = StringFormat("ATR (14): %.5f", atr_value[0]);
   m_lblResults.Text(result);
   IndicatorRelease(atr_handle);
  }

//+------------------------------------------------------------------+
//|                                                                  |
//+------------------------------------------------------------------+
void CMetricsBoard::PerformMovingAverageAnalysis(void)
  {
   double ma = CalculateMovingAverage(50);
   Print("Calculated 50-period MA: ", ma);

   if(ma <= 0)
     {
      m_lblResults.Text("Not enough data for moving average calculation.");
      return;
     }

   string result = StringFormat("50-period MA: %.5f", ma);
   m_lblResults.Text(result);
  }

//+------------------------------------------------------------------+
//|                                                                  |
//+------------------------------------------------------------------+
void CMetricsBoard::PerformSupportResistanceAnalysis(void)
  {
   double support = iLow(Symbol(), PERIOD_H1, 1);
   double resistance = iHigh(Symbol(), PERIOD_H1, 1);
   Print("Retrieved Support: ", support, ", Resistance: ", resistance);

   if(support == 0 || resistance == 0)
     {
      m_lblResults.Text("Failed to retrieve support/resistance levels.");
      return;
     }

   string result = StringFormat("Support: %.5f, Resistance: %.5f", support, resistance);
   m_lblResults.Text(result);
  }

//+------------------------------------------------------------------+
//| Calculate moving average                                         |
//+------------------------------------------------------------------+
double CMetricsBoard::CalculateMovingAverage(int period)
  {
   if(period <= 0)
      return 0;

   double sum = 0.0;
   int bars = Bars(Symbol(), PERIOD_H1);

   if(bars < period)
     {
      return 0;
     }

   for(int i = 0; i < period; i++)
     {
      sum += iClose(Symbol(), PERIOD_H1, i);
     }
   return sum / period;
  }

// Implementation of OnClickButtonClose
void CMetricsBoard::OnClickButtonClose()
  {
   Print("Close button clicked. Closing the Metrics Board...");
   Destroy();  // This method destroys the panel
  }

CMetricsBoard ExtDialog;

//+------------------------------------------------------------------+
//| Initialize the application                                       |
//+------------------------------------------------------------------+
int OnInit()
  {
   if(!ExtDialog.Create(0, "Metrics Board", 0, 10, 10, 350, 500))
     {
      Print("Failed to create Metrics Board.");
      return INIT_FAILED;
     }

   if(!ExtDialog.Run()) // Call Run to make the dialog functional
     {
      Print("Failed to run Metrics Board.");
      return INIT_FAILED; // Call to Run failed
     }

   return INIT_SUCCEEDED;
  }

//+------------------------------------------------------------------+
//| Deinitialize the application                                     |
//+------------------------------------------------------------------+
void OnDeinit(const int reason)
  {
   ExtDialog.Destroy(reason); // Properly call Destroy method
  }

//+------------------------------------------------------------------+
//| Handle chart events                                              |
//+------------------------------------------------------------------+
void OnChartEvent(const int id, const long &lparam, const double &dparam, const string &sparam)
  {
   ExtDialog.ChartEvent(id, lparam, dparam, sparam);
  }
//+------------------------------------------------------------------+
//+------------------------------------------------------------------+
代码分解与实现
- 头文件与基础数据
//+------------------------------------------------------------------+ //| Metrics Board.mql5| //| Copyright 2025, Christian Benjamin| //| https://www.mql5.com| //+------------------------------------------------------------------+ #property copyright "2025, MetaQuotes Software Corp." #property link "https://www.mql5.com/en/users/lynnchris" #property version "1.0" #property strict注释块明确了脚本的用途并标注了相关贡献者信息,这对于确定作者身份以及确保未来用户能够正确地进行成果归属至关重要。#property指令用于定义脚本的各种特性,例如版权信息、作者或文档链接、版本号,以及设置严格模式,这样有助于在编译过程中发现潜在的问题。
- 包含必要的库
接下来,我们引入应用程序所需的库。这些库提供了预定义的功能,可简化编码工作。
#include <Trade\Trade.mqh>
#include <Controls\Dialog.mqh>
#include <Controls\Button.mqh>
#include <Controls\Label.mqh>
#include <Controls\Panel.mqh>
这里,我们引入了与交易操作和用户界面控件相关的库。例如,Trade.mqh对于执行交易功能至关重要,而Dialog.mqh、Button.mqh、Label.mqh和Panel.mqh则用于创建和管理指标面板的用户界面组件。
- 类定义
class CMetricsBoard : public CAppDialog
{
private:
   CButton           m_btnClose;
   CButton           m_btnHighLowAnalysis;
   CButton           m_btnVolumeAnalysis;
   CButton           m_btnTrendAnalysis;
   CButton           m_btnVolatilityAnalysis;
   CButton           m_btnMovingAverage;
   CButton           m_btnSupportResistance;
   CPanel            m_panelResults;
   CLabel            m_lblResults;
该类还包含一个构造函数和一个析构函数。
public:
                     CMetricsBoard(void);
                    ~CMetricsBoard(void);

CMetricsBoard::CMetricsBoard(void) {}

CMetricsBoard::~CMetricsBoard(void) {}
构造函数用于初始化该类,并且定义析构函数(尽管在此例中为空)以确保在销毁CMetricsBoard 类的实例时,能够执行任何必要的清理操作。这样对于高效管理资源至关重要。
- 创建对话框
Create方法负责构建整个控制对话框。在该方法中,我们首先尝试通过基类(CAppDialog::Create)来创建对话框。如果创建失败,我们会记录错误并返回false。接下来,我们创建结果面板和按钮,并再次检查是否存在潜在失败的情况。最后,如果所有步骤均成功完成,我们将显示对话框并返回true。
bool CMetricsBoard::Create(const long chart, const string name, const int subwin, const int x1, const int y1, const int x2, const int y2)
{
   if(!CAppDialog::Create(chart, name, subwin, x1, y1, x2, y2))
   {
      Print("Failed to create CAppDialog instance.");
      return false;
   }

   if(!CreateResultsPanel())
   {
      Print("Failed to create results panel.");
      return false;
   }

   if(!CreateButtons())
   {
      Print("Failed to create buttons.");
      return false;
   }

   Show();
   return true;
}
现在,运行(Run)对话框出现了。Run方法是让对话框具备实际功能的关键所在。
bool CMetricsBoard::Run()
{
   if(!Show())
   {
      Print("Failed to show the control.");
      return false;
   }
   return true;
}
这里,我们使用Show方法显示对话框。如果显示对话框失败,则会打印错误信息,并返回false。
- 创建结果面板
CreateResultsPanel方法用于构建将显示分析结果的面板。首先,我们创建结果面板并设置其属性,如颜色和尺寸。随后,我们将该面板添加到对话框中。我们还会在面板内创建一个标签用于显示结果,在将其添加到面板之前自定义其外观。如果创建成功,此方法将返回true。
bool CMetricsBoard::CreateResultsPanel(void)
{
   if(!m_panelResults.Create(0, "ResultsPanel", 0, 10, 10, 330, 60))
      return false;

   m_panelResults.Color(clrLightGray);
   Add(m_panelResults);

   if(!m_lblResults.Create(0, "ResultsLabel", 0, 15, 15, 315, 30))
      return false;

   m_lblResults.Text("Results will be displayed here.");
   m_lblResults.Color(clrBlack);
   m_lblResults.FontSize(12);
   Add(m_lblResults);

   return true;
}
- 创建按钮
CreateButtons方法负责初始化对话框中的交互式按钮。
bool CMetricsBoard::CreateButtons(void)
{
   int x = 20;
   int y = 80;
   int buttonWidth = 300;
   int buttonHeight = 30;
   int spacing = 15;

   if(!m_btnClose.Create(0, "CloseButton", 0, x, y, x + buttonWidth, y + buttonHeight))
      return false;

   m_btnClose.Text("Close Panel");
   Add(m_btnClose);
   y += buttonHeight + spacing;

   struct ButtonData
   {
      CButton        *button;
      string         name;
      string         text;
   };

   ButtonData buttons[] =
   {
      {&m_btnHighLowAnalysis, "HighLowButton", "High/Low Analysis"},
      {&m_btnVolumeAnalysis, "VolumeButton", "Volume Analysis"},
      {&m_btnTrendAnalysis, "TrendButton", "Trend Analysis"},
      {&m_btnVolatilityAnalysis, "VolatilityButton", "Volatility Analysis"},
      {&m_btnMovingAverage, "MovingAverageButton", "Moving Average"},
      {&m_btnSupportResistance, "SupportResistanceButton", "Support/Resistance"}
   };

   for(int i = 0; i < ArraySize(buttons); i++)
   {
      if(!buttons[i].button.Create(0, buttons[i].name, 0, x, y, x + buttonWidth, y + buttonHeight))
         return false;

      buttons[i].button.Text(buttons[i].text);
      Add(buttons[i].button);
      y += buttonHeight + spacing;
   }

   return true;
}
在此实现过程中,我们为按钮定义了初始坐标、尺寸和间距。我们逐个创建按钮,首先创建用于关闭面板的按钮,并将其添加到对话框中。随后,我们使用一个ButtonData结构体数组,这使我们能够高效地遍历按钮定义。为每个按钮设置对应的文本,并将其添加到对话框中。如果所有按钮都成功创建,该方法将以返回true作为结束。
- 处理事件
1. 按钮点击
OnEvent方法用于处理由用户交互(如按钮点击)生成的事件。
bool CMetricsBoard::OnEvent(const int id, const long &lparam, const double &dparam, const string &sparam)
{
   if(id == CHARTEVENT_OBJECT_CLICK)
   {
      Print("Event ID: ", id, ", Event parameter (sparam): ", sparam);

      if(sparam == "CloseButton")
      {
         OnClickButtonClose();
         return true;
      }
      // ... Handling for other button clicks
   }

   return false;
}
当事件发生时,我们首先检查该事件是否为按钮点击事件。为方便调试,我们会打印事件详情,并通过调用相应的处理函数对特定按钮点击做出响应。如果点击的按钮是关闭按钮,我们会调用OnClickButtonClose()方法。
2. 图表事件
ChartEvent方法的作用类似,但专门聚焦于处理与图表相关的事件。
bool CMetricsBoard::ChartEvent(const int id, const long &lparam, const double &dparam, const string &sparam)
{
   Print("ChartEvent ID: ", id, ", lparam: ", lparam, ", dparam: ", dparam, ", sparam: ", sparam);

   if(id == CHARTEVENT_OBJECT_CLICK)
   {
      return OnEvent(id, lparam, dparam, sparam);
   }

   return false;
}
该方法会捕获对图表对象的任何点击操作,并将事件传递给OnEvent 方法以进行进一步处理。
- 分析操作
以下方法实现了我们的指标面板可执行的各类市场分析。例如, PerformHighLowAnalysis方法可以获取指定时间段内的最高价和最低价:
void CMetricsBoard::PerformHighLowAnalysis(void)
{
   double high = iHigh(Symbol(), PERIOD_H1, 0);
   double low = iLow(Symbol(), PERIOD_H1, 0);

   Print("Retrieved High: ", high, ", Low: ", low);

   if(high == 0 || low == 0)
   {
      m_lblResults.Text("Failed to retrieve high/low values.");
      return;
   }

   string result = StringFormat("High: %.5f, Low: %.5f", high, low);
   m_lblResults.Text(result);
}
在此方法中,我们使用内置函数获取过去一小时内的最高价和最低价。如果操作成功,结果将显示在标签上。如果失败,则会显示错误信息。
其他分析函数也采用类似的逻辑,例如PerformVolumeAnalysis(成交量分析)、PerformTrendAnalysis(趋势分析)、PerformVolatilityAnalysis(波动性分析)、PerformMovingAverageAnalysis(移动平均分析)和PerformSupportResistanceAnalysis(支撑阻力分析)。每个方法都根据其分析类型检索特定数据,并相应更新用户界面。
- 计算移动平均值
所包含的实用方法之一是CalculateMovingAverage,(计算移动平均线),用于计算指定时间段内的移动平均线。此方法将指定时间段内的收盘价求和,然后除以该数字以确定平均值。在进行计算之前,该方法会检查输入是否有效以及数据是否充足。
double CMetricsBoard::CalculateMovingAverage(int period)
{
   if(period <= 0)
      return 0;

   double sum = 0.0;
   int bars = Bars(Symbol(), PERIOD_H1);

   if(bars < period)
   {
      return 0;
   }

   for(int i = 0; i < period; i++)
   {
      sum += iClose(Symbol(), PERIOD_H1, i);
   }
   return sum / period;
}
- 全局实例与初始化
程序创建了一个全局型CMetricsBoard类的实例,随后执行应用程序的初始化与反初始化流程。
CMetricsBoard ExtDialog;

int OnInit()
{
   if(!ExtDialog.Create(0, "Metrics Board", 0, 10, 10, 350, 500))
   {
      Print("Failed to create Metrics Board.");
      return INIT_FAILED;
   }

   if(!ExtDialog.Run())
   {
      Print("Failed to run Metrics Board.");
      return INIT_FAILED;
   }

   return INIT_SUCCEEDED;
}
在OnInit函数中,我们通过调用Create方法对指标面板进行初始化。如果初始化成功,则继续运行该面板。同时,函数会相应记录错误信息,并指示操作成功或失败。
反初始化流程确保在EA被移除时,资源能够正确地得到释放。
void OnDeinit(const int reason)
{
   ExtDialog.Destroy(reason); // Properly call Destroy method
}
- 图表事件处理
最后,我们定义了OnChartEvent函数来管理与图表相关的事件。这样就将用户交互直接集成到应用程序的功能中。该方法会捕获图表事件,并将其传递给我们CMetricsBoard 实例的ChartEvent方法。
void OnChartEvent(const int id, const long &lparam, const double &dparam, const string &sparam)
{
   ExtDialog.ChartEvent(id, lparam, dparam, sparam);
}
包含函数库
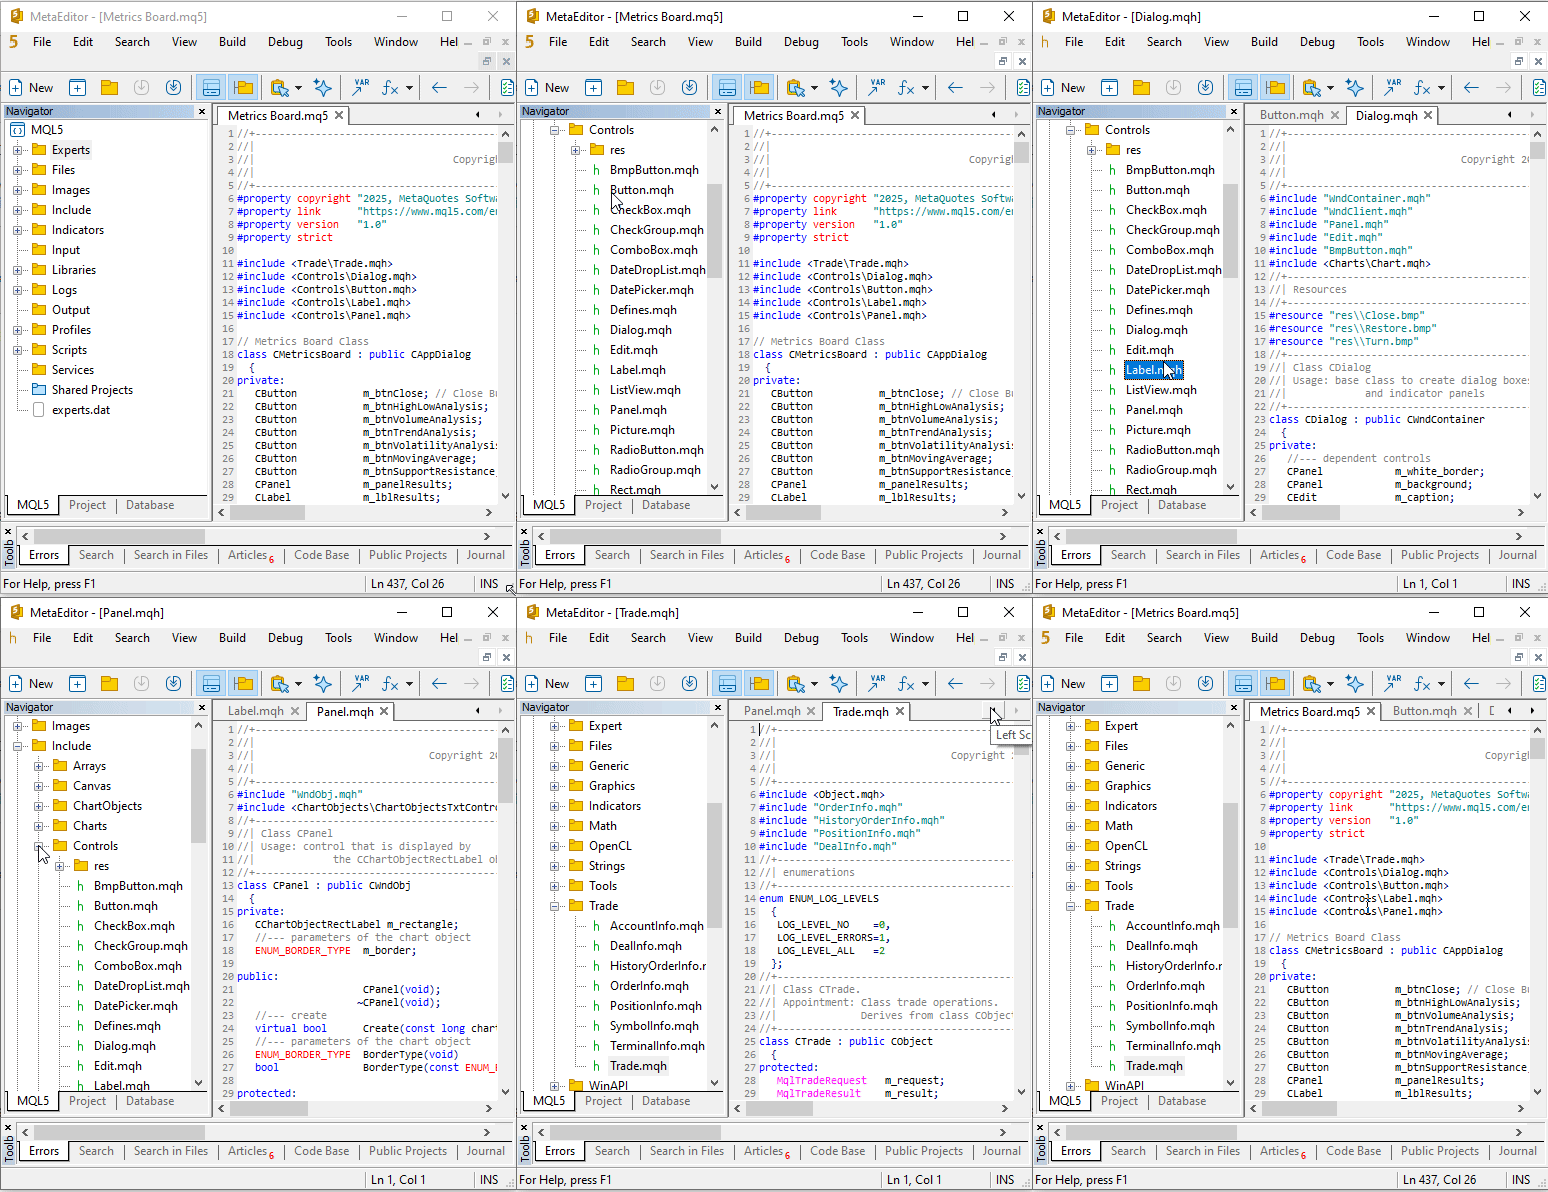
如果在未包含上一节中提到的库的情况下编译代码,可能会遇到错误。要解决此问题,请打开MetaEditor并导航至导航器(Navigator)面板。向下滚动至“包含(Include)”部分,在此处您可以访问所需的库。打开必要的子文件夹,选择相关文件,并逐个编译它们。通过在脚本开头使用#include 指令,确保代码中正确引用了这些库。这一步骤可以确保所有依赖项均正确地加载,避免出现潜在的编译错误。以下GIF动图演示了如何在MetaEditor中访问并包含库。

图例2. 包含函数库
在MQL5中,引入外部库能够让您将外部代码、函数或类集成到自己的程序中,从而增强程序功能,并实现从不同来源复用代码。通过引入某个库,您就可以访问其中定义的函数、类或变量,使它们能够在您的脚本、EA或指标中使用。MQL5中的大多数库都是内置的,为诸如交易功能、技术指标等常见任务提供了现成的解决方案。
成果
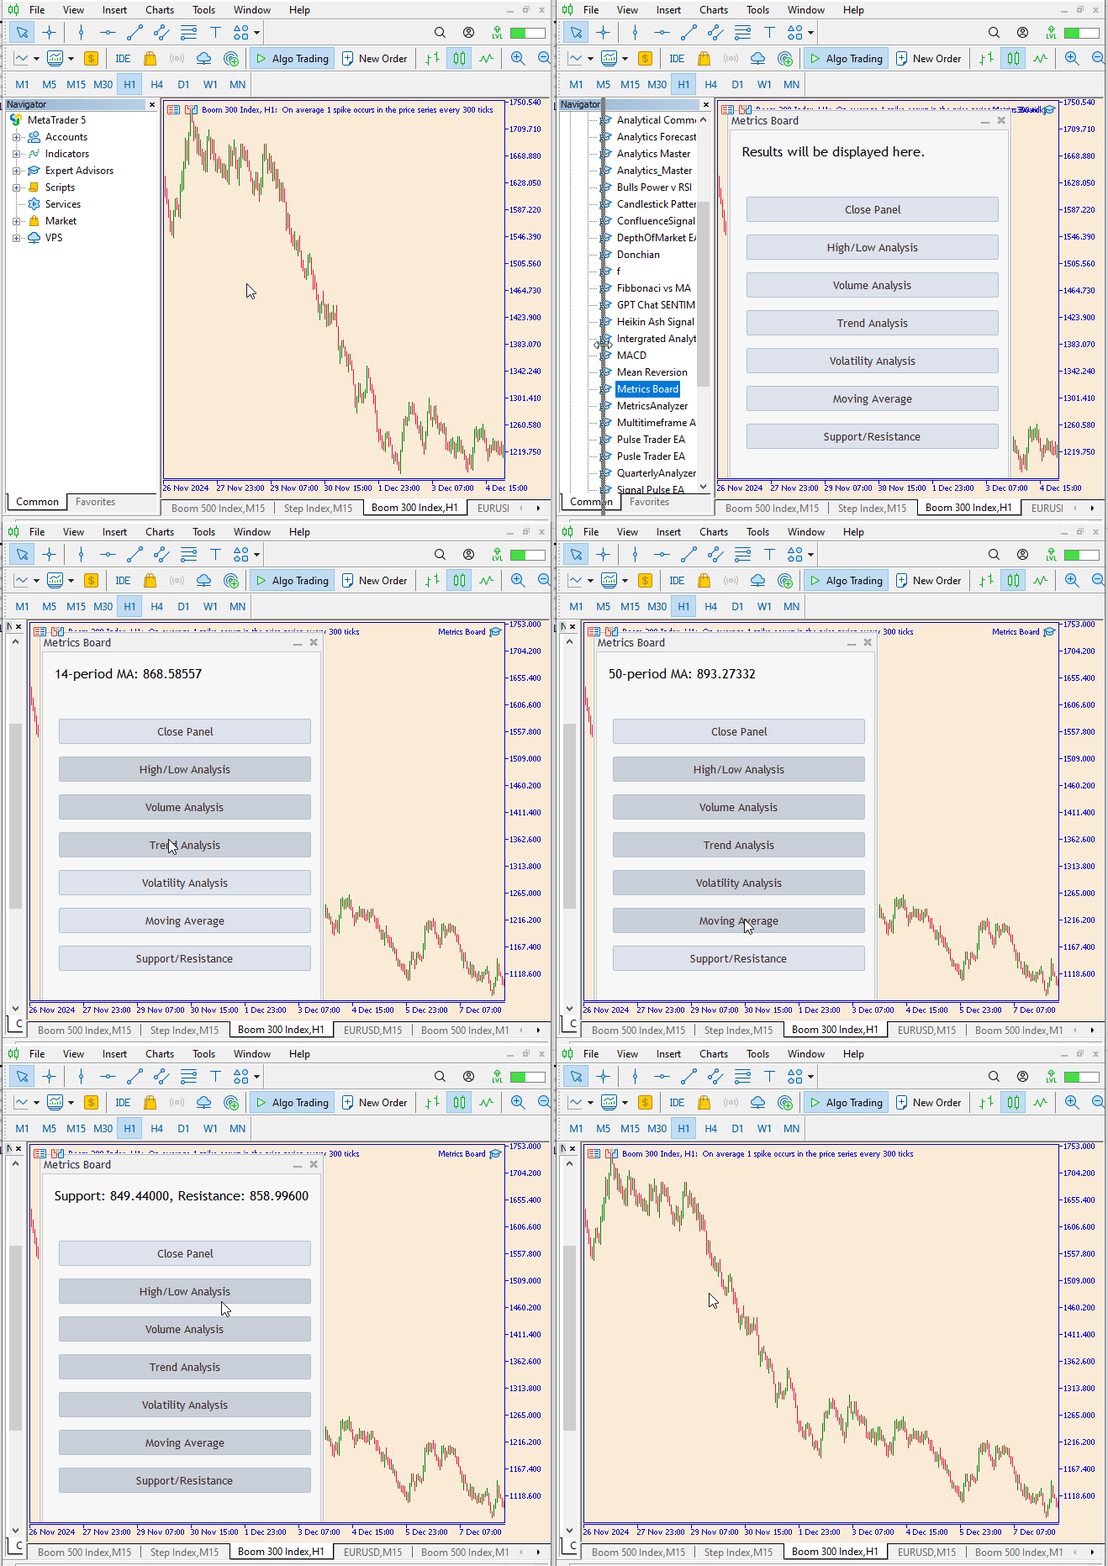
成功编译EA后,您现在可以进入MetaTrader 5,并将该EA附加到图表上。让我们回顾一下在测试期间所获得的成果。

图例3. 成果
根据上图可见,指标面板EA的功能表现优异,能够针对每次按钮操作做出有效响应。这一功能可确保EA实时提供所需指标数据,从而提升用户交互体验和系统性能。
- EA日志
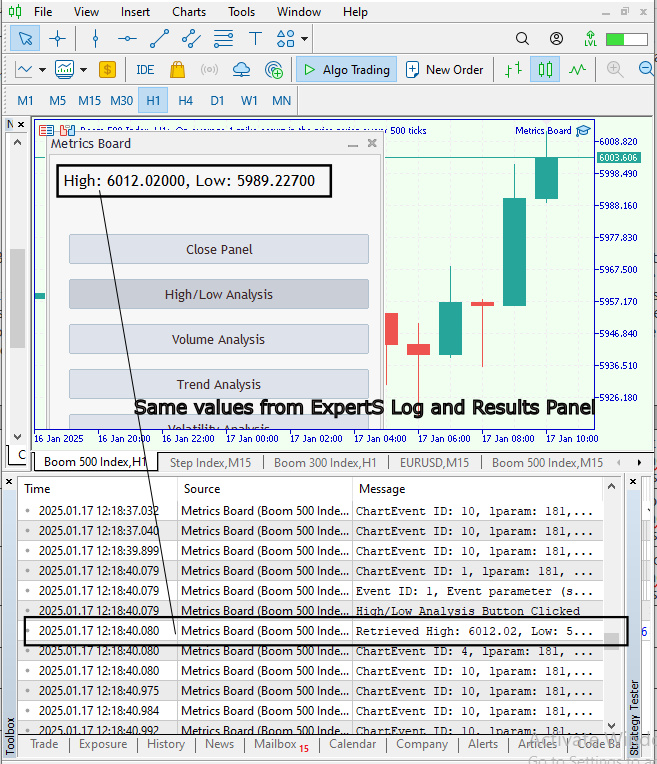
我们还可以在MetaTrader 5中查看EA日志,以观察按钮操作与图表事件之间的交互情况。由于EA内置了日志记录功能,因此能够捕获这些交互信息。让我们查看日志记录信息并分析所记录的内容。

图例4. EA日志
结论
指标面板EA在MetaTrader 5中内置了一个动态且用户友好的面板界面,包含绘图对象函数。其无缝集成效果,让人感觉就像在使用MetaTrader 5的原生控件一样,带来与使用内置应用程序相媲美的体验。在我看来,它在交易工具领域实现了重大突破,提供的功能和易用性超越了我之前开发的一些分析脚本。它允许用户通过单击按钮聚焦特定信息,确保仅显示所需数据,从而简化分析流程。虽然早期那些脚本能够有效实现其功能,但指标面板EA将市场分析提升到了更高的效率和易用性水平。
指标面板EA的主要功能包括:
| 特征 | 优势 |
|---|---|
| 高/低价分析 | 快速识别关键市场价位水平,助力交易者。 |
| 成交量追踪 | 提供最新的交易量更新,以便更好地把握市场背景。 |
| 趋势识别 | 简化识别当前市场趋势的过程。 |
| 支撑/阻力位 | 精准锁定关键价格区域,助力战略性交易决策。 |
该工具赋能交易者高效分析市场,做出更优决策。其简洁的设计简化了复杂的分析流程,使用户能够专注于优化交易策略。展望未来,通过新增功能与进一步优化界面,该工具仍具有巨大的挖掘潜力。
| 日期 | 工具名 | 描述 | 版本 | 更新 | 备注 |
|---|---|---|---|---|---|
| 01/10/24 | 图表展示器 | 以重影效果覆盖前一日价格走势的脚本 | 1.0 | 初始版本 | Lynnchris工具箱的第一个工具 |
| 18/11/24 | 分析评论 | 以表格形式提供前一日的信息,并预测市场的未来方向 | 1.0 | 初始版本 | Lynnchris工具箱的第二个工具 |
| 27/11/24 | 分析大师 | 每两小时定期更新市场指标 | 1.01 | 第二个版本 | Lynnchris工具箱的第三个工具 |
| 02/12/24 | 分析预测 | 集成Telegram通知功能,每两小时定时更新市场指标 | 1.1 | 第三个版本 | 工具数4 |
| 09/12/24 | 波动率导航仪 | 该EA通过布林带、RSI和ATR三大指标综合分析市场状况 | 1.0 | 初始版本 | 工具数5 |
| 19/12/24 | 均值回归信号收割器 | 运用均值回归策略分析市场并提供交易信号 | 1.0 | 初始版本 | 工具数6 |
| 9/01/2025 | 信号脉冲 | 多时间框架分析器 | 1.0 | 初始版本 | 工具数7 |
| 17/01/2025 | 指标看板 | 带分析按钮的控制面板 | 1.0 | 初始版本 | 工具数8 |
本文由MetaQuotes Ltd译自英文
原文地址: https://www.mql5.com/en/articles/16584
注意: MetaQuotes Ltd.将保留所有关于这些材料的权利。全部或部分复制或者转载这些材料将被禁止。
本文由网站的一位用户撰写,反映了他们的个人观点。MetaQuotes Ltd 不对所提供信息的准确性负责,也不对因使用所述解决方案、策略或建议而产生的任何后果负责。
 开发回放系统(第 75 部分):新 Chart Trade(二)
 使用MQL5和Python集成经纪商API与智能交易系统
 交易中的神经网络:多智代自适应模型(终篇)