
使用MQL5与Python构建自我优化的智能交易系统
概要
算法交易开发者面临着一个重大挑战:不断变化的市场条件,这些条件随时间不可预测地变化。随着这些条件的转变,所采用的交易策略也必须随之改变。例如,当市场表现出区间波动行为时,均值回归策略可能是最优选择。然而,当市场开始持续向一个方向趋势化时,趋势跟踪策略则更加合适。
通常,作为开发者,我们会实现一种单一的交易策略,并试图将其普遍应用于所有市场条件,但不幸的是,这种方法无法保证持续成功。或者,我们也可以将多种交易策略编码到一个程序中,允许最终用户根据自己的判断手动选择最合适的策略。
因此,显而易见的是,我们需要设计能够根据当前市场条件自主选择和切换不同策略的程序。为了实现这一目标,我们需要一种量化方法来衡量市场趋势或均值回归走势的强度。一旦我们的EA评估了每次走势的强度,它就可以潜在地选择要跟随的最优策略。
本文展示了如何通过使用转移矩阵来模拟市场行为,并决定是否采用趋势跟踪或均值回归策略,从而智能地实现我们的目标。我们首先对转移矩阵有一个高层次的理解。然后,我们探讨这些数学工具如何用于创建具有增强决策能力的智能交易算法。
引言:安德烈·马尔可夫(Andrey Markov)是谁?

图1:年轻时期的安德烈·马尔可夫(Andrey Markov)
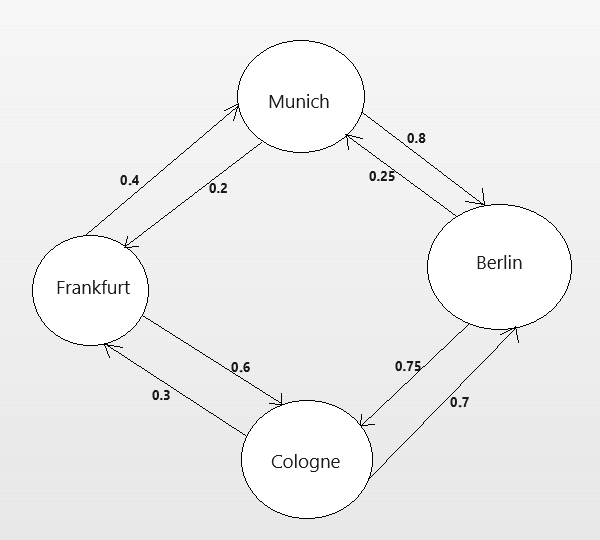
图2:某运输公司虚构马尔可夫模型与客户随机使用路线示意图
让我们解释下上述的马尔科夫链。假设40%从法兰克福上车的乘客倾向于在慕尼黑下车,而另外60%则倾向于前往科隆。在科隆的乘客中,30%倾向于返回法兰克福,而70%通常会前往柏林。这个模型清楚地突出了你的客户最常使用的路线。
此外,注意有些目的地之间没有直接连接。没有连接表明,在公司70年的历史中,没有客户需要在这两个城市之间直接旅行。因此,作为经理,你可以自信地得出结论:增加从法兰克福到柏林的公交车可能不如其他热门路线(如法兰克福到科隆)那么有利可图。
这里要说明的是,转移矩阵显示了从一个状态转换到另一个状态的不同概率。根据安德烈·马尔可夫的说法,任何给定状态的概率仅取决于其当前状态。它帮助我们理解系统如何变化以及它最有可能转换到下一个什么状态。在我们将转移矩阵应用于金融市场之前,我们首先必须定义市场可能处于的所有状态。
构建策略:定义市场状态
定义市场状态的一种有效方法是使用技术指标。在下面的例子中,我们已经在MetaTrader 5终端的一个交易品种上应用了移动平均线。我们可以这样定义状态:“每当一根K线收盘价高于移动平均线时,状态为向上(图中为1),而每当一根K线收盘价低于移动平均线时,状态为向下(图中为2)”。
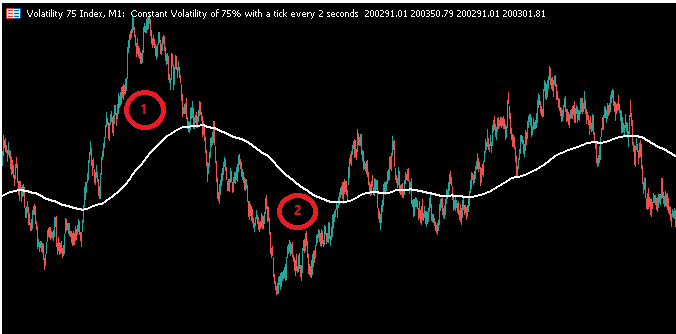
图 3:一个示意图,显示市场状态为 1 或 2。
我们可以构建一个马尔可夫链来模拟市场如何从收盘价高于移动平均线的状态转变为收盘价低于移动平均线的状态。换句话说,一个模拟移动平均线与收盘价之间关系的马尔可夫链可以回答这样的问题:“如果一根K线收盘价高于移动平均线,那么下一根K线的收盘价也高于移动平均线的概率是多少?”如果这个概率超过0.5,市场可能适合趋势跟踪策略。否则,市场更有可能适合均值回归策略。
开始:构建我们的第一个转移矩阵
#Import packages
import pandas as pd
import numpy as np
import MetaTrader5 as mt5
from   datetime import datetime
import pandas_ta as ta
import time
然后,我们需要定义我们的登录凭据,并指定其他感兴趣的全局变量,例如我们希望交易的交易品种,以及我们想要使用的图表时间周期。
#Account login details
login = 123456789
password = "Enter Your Password"
server = "Enter Your Server"
symbol = "EURUSD"
#What timeframe are we working on?
timeframe = mt5.TIMEFRAME_M1
#This data frame will store the most recent price update
last_close = pd.DataFrame()
#We may not always enter at the price we want, how much deviation can we tolerate?
deviation = 100
#The size of our positions
volume = 0
#How many times the minimum volume should our positions be
lot_multiple = 1
现在,我们登录。
#Login
if(mt5.initialize(login=login,password=password,server=server)):
    print("Logged in successfully")
else:
    print("Failed to login")
接着,我们定义我们的交易量。
#Setup trading volume
symbols = mt5.symbols_get()
for index,symbol in enumerate(symbols):
    if symbol.name == "EURUSD":
        print(f"{symbol.name} has minimum volume: {symbol.volume_min}")
        volume = symbol.volume_min * lot_multiple
#Specify date range of data to be collected
date_start = datetime(2020,1,1)
date_end = datetime.now()
在获取数据之后,我们现在可以继续计算转移矩阵,以观察欧元/美元市场的演变情况。
#Fetch market data
market_data = pd.DataFrame(mt5.copy_rates_range("EURUSD",timeframe,date_start,date_end))
market_data["time"] = pd.to_datetime(market_data["time"],unit='s')
#Add simple moving average technical indicator
market_data.ta.sma(length=20,append=True)
#Delete missing rows
market_data.dropna(inplace=True)
#Inspect the data frame
market_data
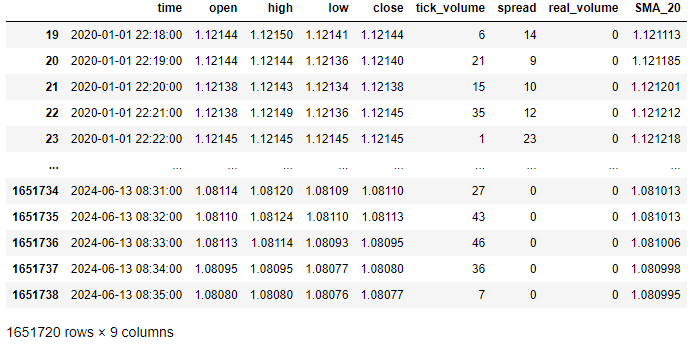
图 4:我们当前格式的数据框架。
我们需要定义两根感兴趣的K线之间必须有多少间隔。在这个例子中,我们感兴趣的问题是“如果当前K线收盘价高于移动平均线,那么下一根K线也收盘价高于移动平均线的概率是多少?”如果你对更长时间范围内的转移概率感兴趣,那么你应该增加这个参数以满足你特定策略的需求。
#Define how far ahead we are looking
look_ahead = 1
计算转移矩阵并不难:
- 首先,定义所有可能的状态(我们定义了两种简单状态:向上和向下)。
- 统计有多少K线属于每个相应状态。
- 计算处于“向上”状态的所有K线中,有多少比例的K线被另一根处于相同状态的K线跟随。
- 计算处于“向下”状态的所有K线中,有多少比例的K线被另一根处于相同状态的K线跟随。
#Count the number of times price was above the moving average
up = market_data.loc[market_data["close"] > market_data["SMA_20"]].shape[0]

#Count the number of times price was below the moving average
down = market_data.loc[market_data["close"] < market_data["SMA_20"]].shape[0]

#Count the number of times price was above the moving average and remained above it
up_and_up = (market_data.loc[( (market_data["close"] > market_data["SMA_20"]) & (market_data["close"].shift(-look_ahead) > market_data["SMA_20"].shift(-look_ahead)) )].shape[0]) / up

#Count the number of times price was below the moving average and remained below it
down_and_down = (market_data.loc[( (market_data["close"] < market_data["SMA_20"]) & (market_data["close"].shift(-look_ahead) < market_data["SMA_20"].shift(-look_ahead)) )].shape[0]) / down
然后我们将数据组合到一个数据框架中。
transition_matrix = pd.DataFrame({
    "UP":[up_and_up,(1-down_and_down)],
    "DOWN":[(1-up_and_up),down_and_down]
},index=['UP','DOWN'])
让我们看看我们的转换矩阵。
转换矩阵
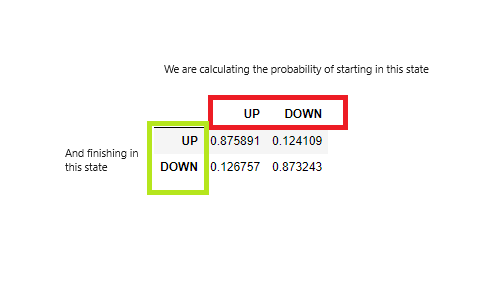
图5:我们的转换矩阵
让我们一起解读转移矩阵。我们的矩阵告诉我们,如果当前K线收盘价高于移动平均线,那么下一根K线也收盘价高于移动平均线的概率为88%,而下一根K线收盘价低于移动平均线的概率为12%。这是一个很好的迹象,表明在这个特定市场中,走势并不经常反转。因此,这个市场可能适合趋势跟踪策略。
现在我们已经构建了转移矩阵,我们可以继续构建算法的其余部分,该算法将使用这个转移矩阵来指导其决策,决定是否应该买入或卖出某一特定金融工具。
def get_prices():
    start = datetime(2024,6,1)
    end   = datetime.now()
    data  = pd.DataFrame(mt5.copy_rates_range("EURUSD",timeframe,start,end))
    #Add simple moving average technical indicator
    data.ta.sma(length=20,append=True)
    #Delete missing rows
    data.dropna(inplace=True)
    data['time'] = pd.to_datetime(data['time'],unit='s')
    data.set_index('time',inplace=True)
    return(data.iloc[-1,:])
接下来,我们定义一个函数获取当前市场状态。
def get_state(current_data):
    #Price is above the moving average, UP state
    if(current_data["close"]  > current_data["SMA_20"]):
        return(1)
    #Price is below the moving average, DOWN state
    elif(current_data["close"] < current_data["SMA_20"]):
        return(2)
最后,我们将定义一个函数,根据当前市场状态和转移概率来选择一个操作。
def get_action(current_state):
    if(current_state == 1):
        if(transition_matrix.iloc[0,0] > transition_matrix.iloc[0,1]):
            print("The market is above the moving average and has strong trends, buy")
            print("Opening a BUY position")
            mt5.Buy("EURUSD",volume)
        elif(transition_matrix.iloc[0,0] < transition_matrix.iloc[0,1]):
            print("The market is above the moving average and has strong mean reverting moves, sell")
            print("Opening a sell position")
            mt5.Sell("EURUSD",volume)
    elif(current_state == 2):
        if(transition_matrix.iloc[1,0] > transition_matrix.iloc[1,1]):
            print("The market is below the moving average and has strong mean reverting moves, buy")
            print("Opening a BUY position")
            mt5.Buy("EURUSD",volume)
        elif(transition_matrix.iloc[1,0] < transition_matrix.iloc[1,1]):
            print("The market is below the moving average and has strong trends, sell")
            print("Opening a sell position")
            mt5.Sell("EURUSD",volume)
现在我们可以看到我们的算法在运行。
while True:
    #Get data on the current state of our terminal and our portfolio
    positions = mt5.positions_total()
    #If we have no open positions then we can open one
    if(positions == 0):
        get_action(get_state(get_prices()))
    #If we have finished all checks then we can wait for one day before checking our positions again
    time.sleep(60)
市场低于移动平均线且有强烈趋势,卖出。
开设一个卖出头寸。
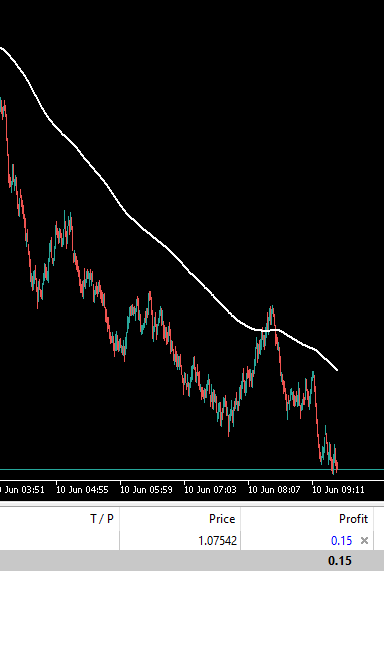
图 6:我们的交易算法选择的交易。
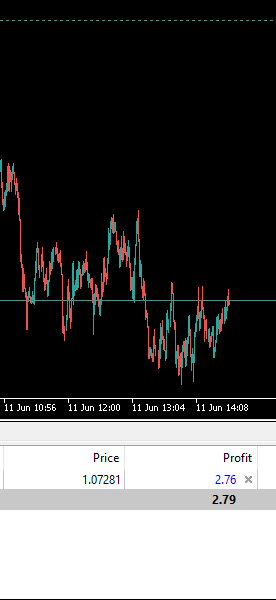
图 7:我们的交易算法在次日选择的交易。
关于转移矩阵,可以说的内容远不止这些。然而,这已经是对该主题的一个很好的入门介绍。在结束我们的讨论之前,重要的是我们要讨论哪些变量会影响我们的转移矩阵,以及如果需要的话,我们如何操纵转移矩阵。
| UP | DOWN | |
|---|---|---|
| UP | 0.926 | 0.074 |
| DOWN | 0.043 | 0.957 |
正如你可以观察到的,当我们选择欧元/美元(EURUSD)作为我们的交易品种时,连续两根K线收盘价高于移动平均线的概率是88%,但如今我们选择了这个新的交易品种“Boom 1000 Index”, 连续两根K线收盘价高于移动平均线 的概率已经上升到了93%。因此,所选择的交易品种对转移矩阵有着不可否认的影响。
技术指标参数回想一下,我们使用技术指标来帮助我们轻松定义相对于该指标的市场状态。因此,改变移动平均线的周期会对转移矩阵产生重大影响。为了简单说明这一点,我们将回到最初模拟欧元/美元(EURUSD)的条件,但这次唯一的区别是我们将使用2周期,而在我们最初的例子中我们使用的是20周期。其他所有变量都保持不变。
| UP | DOWN | |
|---|---|---|
| UP | 0.456 | 0.544 |
| DOWN | 0.547 | 0.453 |
注意,现在的转移概率正在趋于50/50,即向任何方向发展的机会均等。这隐含地告诉我们,随着移动平均线周期的增加,我们的转移概率会逐渐远离简单的50/50机会。
K线之间的间隔在我们的讨论中,我们只关注了两根连续K线之间的关系。然而,随着我们增加所关注的两根K线之间的间隔,我们的转移矩阵也会发生变化。同样,我们将回到最初用于模拟欧元/美元(EURUSD)的条件,但这次,我们将两根K线之间的间隔增加到100。因此,除了两根K线之间的间隔外,其他所有变量都将保持不变。
| UP | DOWN | |
|---|---|---|
| UP | 0.503 | 0.497 |
| DOWN | 0.507 | 0.493 |
推荐配置
设计马尔可夫链并没有绝对的“正确”或“错误”的方式,然而,为了使你的应用与我们的讨论保持一致,当你构建马尔可夫链时,至关重要的是要遵循下面概述的设计模式:transition_matrix = pd.DataFrame({
"UP":["UP AND UP","UP AND DOWN"],
"DOWN":["DOWN AND UP","DOWN AND DOWN"]
},index=['UP','DOWN']) 我们的转移矩阵旨在快速显示我们是应该跟随趋势还是逆势而为。
当主对角线包含最大概率时,趋势跟踪策略可能最为有效,这意味着市场倾向于形成趋势,并且倾向于保持在趋势中:
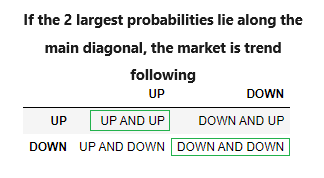
图8:一个趋势跟踪转换矩阵
相反,当非对角线元素包含最大概率时,均值回归策略可能最为有效,这意味着市场倾向于回归到平衡水平:
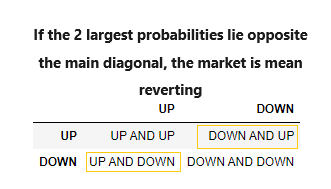
图9:一个均值回归转换矩阵
此外,如果最大概率出现在矩阵的最底行,这意味着市场处于熊市:
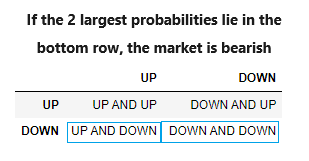
图 10:一个熊市的转移矩阵。
最后,如果最大概率出现在矩阵的最顶行,这意味着市场处于牛市:
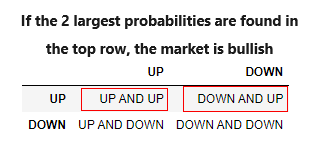
图 11:一个牛市的转移矩阵。
MQL5实现
接下来,我们将使用 MQL5 实现这一策略,以便我们能够使用真实市场数据对策略进行广泛测试。
首先,我们加载所需的库。
//+------------------------------------------------------------------+
//|                                          Transition Matrices.mq5 |
//|                                       Gamuchirai Zororo Ndawana. |
//|                                             https://www.mql5.com |
//+------------------------------------------------------------------+
#property copyright "Gamuchirai Zororo Ndawana."
#property link      "https://www.mql5.com"
#property version   "1.00"

//+------------------------------------------------------------------+
//|Overview                                                          |
//+------------------------------------------------------------------+
/*
This expert advisor will demonstrate how we can use transition matrices to build
self optimizing expert advisors. We will use the transition matrix to decide whether
we should employ trend following, or mean reverting trading strategies.

Gamuchirai Zororo Ndawana
Friday 19 July 2024, 10:09
Selebi Phikwe
Botswana
*/

//+------------------------------------------------------------------+
//| Libraries                                                        |
//+------------------------------------------------------------------+
#include <Trade/Trade.mqh>//Trade class
CTrade Trade;
接下来,我们定义最终用户可以编辑的输入参数。
//+------------------------------------------------------------------+
//| Inputs                                                            |
//+------------------------------------------------------------------+
input int fetch = 5; //How much historical data should we fetch?
input int look_ahead = 1; //Our forecast horizon

input int ma_period = 20; //The MA Period
input int rsi_period = 20; //The RSI Period
input int wpr_period = 20; //The Williams Percent Range Period

input int  lot_multiple = 20; //How big should the lot sizes be
input double sl_width = 0.4; //Stop loss size
继续,我们需要定义一些在应用程序中会用到的全局变量。
//+------------------------------------------------------------------+
//|Global variables                                                  |
//+------------------------------------------------------------------+
double minimum_volume;//Smallest lot size
double ask_price;//Ask
double bid_price;//Bid
int ma_handler,rsi_handler,wpr_handler;//The handlers for our technical indicators
vector ma_readings(fetch);//MA indicator values
vector rsi_readings(fetch);//RSI indicator values
vector wpr_readings(fetch);//WPR indicator values
vector price_readings(fetch);//The vector we will use to store our historical price values
matrix transition_matrix = matrix::Zeros(2,2);//The matrix to store our observations on price's transition behavior
bool transition_matrix_initialized = false;//This flag will instruct the application to initialize the transition matrix
double up_and_up = 0;//These variables will keep count of the price transitions
double up_and_down = 0;
double down_and_up = 0;
double down_and_down = 0;
double total_count = (double) fetch - look_ahead;//This variable will store the total number of observations used to calculate the transition matrix
double trading_volume;//This is our desired trading size
vector market_behavior = vector::Zeros(4);//Transition matrix interpretations
我们需要为我们的EA定义初始化函数。这个函数将确保用户输入了有效的参数,并设置我们的技术指标。
//+------------------------------------------------------------------+
//| Initialization Function                                          |
//+------------------------------------------------------------------+
int OnInit()
  {
//--- Initialize the technical indicator
   ma_handler = iMA(_Symbol,PERIOD_CURRENT,ma_period,0,MODE_EMA,PRICE_CLOSE);
   rsi_handler = iRSI(_Symbol,PERIOD_CURRENT,rsi_period,PRICE_CLOSE);
   wpr_handler = iWPR(_Symbol,PERIOD_CURRENT,wpr_period);
   minimum_volume = SymbolInfoDouble(_Symbol,SYMBOL_VOLUME_MIN);
   trading_volume = minimum_volume * lot_multiple;
//--- Look ahead cannot be greater than fetch
   if(look_ahead > fetch)
     {
      Comment("We cannot forecast further into the future than thr to total amount of  data fetched.\nEither fetch more data or forecast nearer to the present.");
      return(INIT_FAILED);
     }
//--- End of initialization
   return(INIT_SUCCEEDED);
  }
我们的程序还需要一个在反初始化时执行的程序。
//+------------------------------------------------------------------+
//| Expert de-initialization function                                |
//+------------------------------------------------------------------+
void OnDeinit(const int reason)
  {
//--- Remove technical indicators
   IndicatorRelease(rsi_handler);
   IndicatorRelease(wpr_handler);
   IndicatorRelease(ma_handler);
//--- Remove Expert Advisor
   ExpertRemove();
  }
我们还将编写一个函数来更新我们的技术指标并获取当前市场价格。
//+------------------------------------------------------------------+
//|This function will update our technical indicator values          |
//+------------------------------------------------------------------+
void update_technical_indicators(void)
  {
//--- Update bid and ask price
   ask_price = SymbolInfoDouble(_Symbol,SYMBOL_ASK);
   bid_price = SymbolInfoDouble(_Symbol,SYMBOL_BID);
//--- Update each indicator value, we only need the most recent reading
   rsi_readings.CopyIndicatorBuffer(rsi_handler,0,0,1);
   wpr_readings.CopyIndicatorBuffer(wpr_handler,0,0,1);
   ma_readings.CopyIndicatorBuffer(ma_handler,0,0,1);
  }
记住,我们对技术指标读数的解释将始终取决于通过转移矩阵衡量的市场行为。
//+------------------------------------------------------------------+
//|This function will find an entry opportunity based on our signals |                                                                  |
//+------------------------------------------------------------------+
void find_entry(void)
  {
//--- Store the index of our largest entry
   ulong max_arg = market_behavior.ArgMax();

//--- First we have to know the behavior of the market before we decide to buy or sell
   if(max_arg == 0)
     {
      //--- This means that the market is bullish and we should probably only take buy oppurtunities
      Comment("The observed transition matrix can only be generated by a bullish market");
      bullish_sentiment(0);
     }
   else
      if(max_arg == 1)
        {
         //--- This means that the market is bearish and we should probably only take sell oppurtunities
         Comment("The observed transition matrix can only be generated by a bearish market");
         bearish_sentiment(0);
        }
      else
         if(max_arg == 2)
           {
            //--- This means that the market trends and we should probably join either side of the trend
            Comment("The observed transition matrix can only be generated by a trending market");
            bearish_sentiment(0);
            bullish_sentiment(0);
           }
         else
            if(max_arg == 3)
              {
               //--- This means that the market is mean reverting and we should probably play against the trends on either side
               Comment("The observed transition matrix can only be generated by a mean reverting market");
               bearish_sentiment(-1);
               bullish_sentiment(-1);
              }
  }
我们需要一个函数来执行我们的多头订单。
//+----------------------------------------------------------------+
//|This function will look for oppurtunities to buy                |
//+----------------------------------------------------------------+
void bullish_sentiment(int f_flag)
  {
//--- This function analyses the market for bullish sentiment using our technical indicator
//--- It has only 1 parameter, a flag denoting whether we should interpret the indicators in a trend following fashion
//--- or a mean reverting fashion. For example 0 means interpret the indicators in a trend following fashion.
//--- Therefore if we call the function and pass 0, RSI readings above 50 will trigger buy orders.
//--- However if -1 was passed then RSI readings below 50 will trigger buy orders.
//--- First make sure we have no open positions
   if(PositionsTotal() > 0)
     {
      return;
     }

//--- Interpret the flag
   if(f_flag == 0)
     {
      //--- The flag is telling us to follow the trend
      if((rsi_readings[0] > 50) && (wpr_readings[0] > -50))
        {
         Trade.Buy(trading_volume,_Symbol,ask_price,(ask_price - sl_width),(ask_price + sl_width),"Transition Matrix Order");
        }
     }
   else
      if(f_flag == -1)
        {
         //--- The flag is telling us to bet against the trend
         if((rsi_readings[0] < 50) && (wpr_readings[0] < -50))
           {
            Trade.Buy(trading_volume,_Symbol,ask_price,(ask_price - sl_width),(ask_price + sl_width),"Transition Matrix Order");
           }
        }

  }
这个函数将为我们执行空头订单。回想一下,如果我们的市场表现出均值回归特性,那么我们将以“相反”的方式解释指标。
//+-------------------------------------------------------------+
//|This function will help us find oppurtunities to sell        |
//+-------------------------------------------------------------+
void bearish_sentiment(int f_flag)
  {
//--- This function analysises the market for bearish sentiment using our technical indicator
//--- It has only 1 parameter, a flag denoting whether we should interpret the indicators in a trend following fashion
//--- or a mean reverting fashion. For example 0 means interpret the indicators in a trend following fashion.
//--- Therefore if we call the function and pass 0, RSI readings below 50 will trigger sell orders.
//--- However if -1 was passed then RSI readings above 50 will trigger sell orders.
//--- First make sure we have no open positions
   if(PositionsTotal() > 0)
     {
      return;
     }
//--- Interpret the flag
   if(f_flag == 0)
     {
      //--- Now we know how to interpret our technical indicators
      if((rsi_readings[0] < 50) && (wpr_readings[0] < -50))
        {
         Trade.Sell(trading_volume,_Symbol,bid_price,(bid_price + sl_width),(bid_price - sl_width),"Transition Matrix Order");
        }
     }
   else
      if(f_flag == -1)
        {
         //--- Now we know how to interpret our technical indicators
         if((rsi_readings[0] > 50) && (wpr_readings[0] > -50))
           {
            Trade.Sell(trading_volume,_Symbol,bid_price,(bid_price + sl_width),(bid_price - sl_width),"Transition Matrix Order");
           }
        }
  }
我们还需要定义一个函数,以确保我们的转移矩阵按照上述程序准备和计算。
//+---------------------------------------------------------------+
//|This function will initialize our transition matrix            |
//+---------------------------------------------------------------+
void initialize_transition_matrix(void)
  {
//--- We need to update our historical price readings and our MA readings
   ma_readings.CopyIndicatorBuffer(ma_handler,0,1,fetch);
   price_readings.CopyRates(_Symbol,PERIOD_CURRENT,COPY_RATES_CLOSE,1,fetch);

//--- Now let us update our transition matrix
   for(int i = 0; i < fetch - look_ahead; i++)
     {
      //--- Did price go from being above the MA but end up beneath the MA?
      if((price_readings[i] > ma_readings[i]) && (price_readings[i + look_ahead] < ma_readings[i + look_ahead]))
        {
         up_and_down += 1;
        }
      //--- Did price go from being above the MA and remain above it?
      else
         if((price_readings[i] > ma_readings[i]) && (price_readings[i + look_ahead] > ma_readings[i + look_ahead]))
           {
            up_and_up += 1;
           }

         //--- Did price go from being below the MA but end up above it?
         else
            if((price_readings[i] < ma_readings[i]) && (price_readings[i + look_ahead] > ma_readings[i + look_ahead]))
              {
               down_and_up += 1;
              }

            //--- Did price go from being below the MA and remain below it?
            else
               if((price_readings[i] < ma_readings[i]) && (price_readings[i + look_ahead] < ma_readings[i + look_ahead]))
                 {
                  down_and_down += 1;
                 }
     }

//--- Let us see our counts so far
   Print("Up and up: ",up_and_up,"\nUp and down: ",up_and_down,"\nDown and up: ",down_and_up,"\nDown and down: ",down_and_down);
   double sum_of_counts = up_and_up + up_and_down + down_and_up + down_and_down;
   Print("Sum of counts: ",(sum_of_counts),"\nObservations made: ",total_count,"\nDifference:[the difference should always be 0] ",(total_count - sum_of_counts));
//--- Now we will calculate the transition matrix
//--- The matrix position (0,0) stores the probaility that after making a move up, the market will continue rising
//--- The matrix position (0,1) stores the probability that after making a move down, price will reverse and start rising
//--- The matrix position (1,0) stores the probability that after making a move up, price will reverse and start falling
//--- The matrix position (1,1) stores the probabilty that after making a move down, price will continue falling
   transition_matrix[0][0] = up_and_up / (up_and_up + up_and_down);
   transition_matrix[0][1] = down_and_up / (up_and_up + up_and_down);
   transition_matrix[1][0] = up_and_down / (down_and_up + down_and_down);
   transition_matrix[1][1] = down_and_down / (down_and_up + down_and_down);
//--- Show the transition matrix
   Print("Our transition Matrix");
   Print(transition_matrix);
//--- Now we need to make sense of the transition matrix
   analyse_transition_matrix();
//--- Now we need to update the flag
   transition_matrix_initialized = true;
  }
我们还需要一个辅助函数来解释我们的转移矩阵。
//+-------------------------------------------------------------+
//|This function will analyse our transition matrix             |
//+-------------------------------------------------------------+
void analyse_transition_matrix(void)
  {
//--- Check if the market is bullish
   if((transition_matrix[0][0] > transition_matrix[1][0])&&(transition_matrix[0][1] > transition_matrix[1][1]))
     {
      market_behavior[0] = 1;
     }
//--- Check if the market is bearish
   else
      if((transition_matrix[0][1] > transition_matrix[1][0])&&(transition_matrix[1][1] > transition_matrix[1][0]))
        {
         market_behavior[1] = 1;
        }
      //--- Check if the market trends
      else
         if(transition_matrix.Trace() > 1)
           {
            market_behavior[2] = 1;
           }
         //--- Check if the market is mean reverting
         else
            if(transition_matrix.Trace() < 1)
              {
               market_behavior[3] = 1;
              }
  }
//+------------------------------------------------------------------+
我们的OnTick处理器将确保我们在上面概述的所有函数在适当的时间被调用。
//+------------------------------------------------------------------+
//| Expert tick function                                             |
//+------------------------------------------------------------------+
void OnTick()
  {
//--- First we must check if our transition matrix has been initialized
   if(!transition_matrix_initialized)
     {
      initialize_transition_matrix();
     }
//--- Otherwise our transition matrix has been initialized
   else
     {
      //--- Update technical indicator values
      update_technical_indicators();
      //--- If we have no open positions we will use our tranistion matrix to help us interpret our technical indicators
      if(PositionsTotal() == 0)
        {
         find_entry();
        }
     }
  }
//+------------------------------------------------------------------+
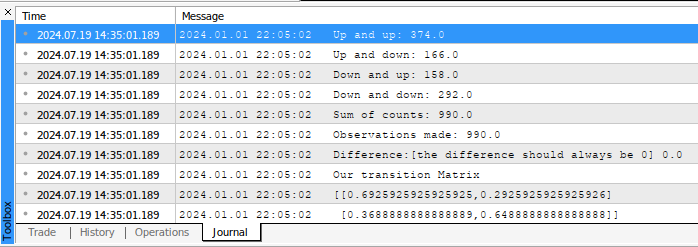
图12:在MQL5中计算的转移矩阵
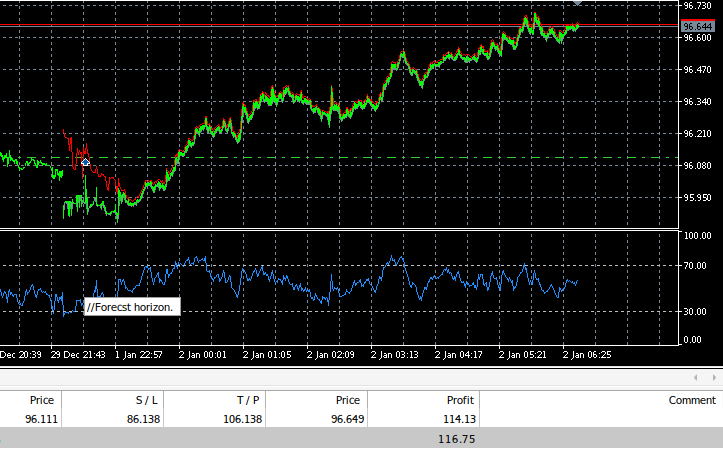
图13:用我们的EA交易AUDJPY
结论
本文探讨了马尔可夫链在算法交易中的应用,以适应不断变化的市场条件。从马尔可夫链的概念介绍开始,我们展示了它们在模拟类似市场动态的随机过程中的有用性。通过使用技术指标(如移动平均线)定义市场状态,我们展示了如何构建马尔可夫链来分析市场转换。这种方法使我们能够确定未来市场走势的概率,帮助我们决定是采用趋势跟踪策略还是均值回归策略。通过这种方法,我们的目标是创建具有增强决策能力的智能交易算法,从而最终提高在动态市场中的交易表现。
本文由MetaQuotes Ltd译自英文
原文地址: https://www.mql5.com/en/articles/15040
注意: MetaQuotes Ltd.将保留所有关于这些材料的权利。全部或部分复制或者转载这些材料将被禁止。
本文由网站的一位用户撰写,反映了他们的个人观点。MetaQuotes Ltd 不对所提供信息的准确性负责,也不对因使用所述解决方案、策略或建议而产生的任何后果负责。
 基于转移熵的时间序列因果分析
 在 MQL5 中创建交互式图形用户界面(第 2 部分):添加控制和响应
 基于套接字(Sockets)的Twitter情绪分析
 神经网络变得简单(第 92 部分):频域和时域中的自适应预测
正如你所知,做任何事情都有很多方法。我在这里概述的方法旨在帮助你快速获得可靠的结果。但是,任何事情都是有代价的,你所观察到的过渡矩阵在很大程度上受你所获取的数据量的影响,但当你获取的数据量越来越多时,过渡矩阵就会变得稳定并停止变化(它会收敛)。
,让我这么跟你说吧,过渡矩阵和 NN 方法解决的完全是不同的问题,它们回答的是不同的问题。过渡矩阵不能预测任何事情,它只是总结/告诉我们过去发生了什么,并不能告诉我们未来可能发生什么。
而 NN 则告诉我们未来可能会发生什么。在一个 EA 中可以同时使用这两种方法。