IQ Star Lines
- Göstergeler
- Sürüm: 1.3
- Güncellendi: 27 Temmuz 2026
- Etkinleştirmeler: 5

First time on MetaTrader, introducing IQ Star Lines - an original Vedic Astrology based indicator.
While most traders rely on lagging indicators that tell them what has already happened, IQ Star Lines operates on a completely different dimension: Time and Space based on Vedic Astrological Mathematics.
By calculating the details of planetary angles, lunar phases, Nakshatra (Vedic Astrology), and more, this indicator generates a Dynamic Star Pivot anchored directly to the day's true harmonic frequency. Surrounding this pivot are our proprietary Astro-Fib Fused Support & Resistance levels, which dynamically adapt to institutional market rhythms. Complete with a live Astro-Timing Console, IQ Star Lines alerts you to exact "Active Zones", specific time windows where planetary aspects trigger massive market volatility.
Setup & Guide:
Download MT5 Version here.
To learn how to use the Indicator: Indicator Manual & Guide - Read Here
Follow our MQL5 channel for daily market insights, chart, indicator updates and offers! Join here.
Disclaimer:
- Due to regulatory and compliance restrictions, our service, including personalized technical support and one-on-one troubleshooting, is unavailable in India, Pakistan, and Bangladesh. Products purchased from these regions are ineligible for these services after purchase.
- Our products are available only on mql5.com.
- We never contact anyone or sell our products privately.
- We do not provide any personal trading advice.
- We do not sell any of the Intraquotes products on Telegram or any other platform, or website.
- This product operates only on standard MetaTrader 4 / MetaTrader 5 platforms. Third-party or modified environments are not supported.
- Not compatible with offline charts or custom/synthetic symbols.
- Does not provide Data Window values or buffers for EA integration.
- Intended strictly for manual trading; automated or algorithmic usage is not supported.
1. Key Features of IQ Star Lines
- Cleaner Astro Levels
1 Dynamic Star Pivot + precise Star Support/Resistance levels.
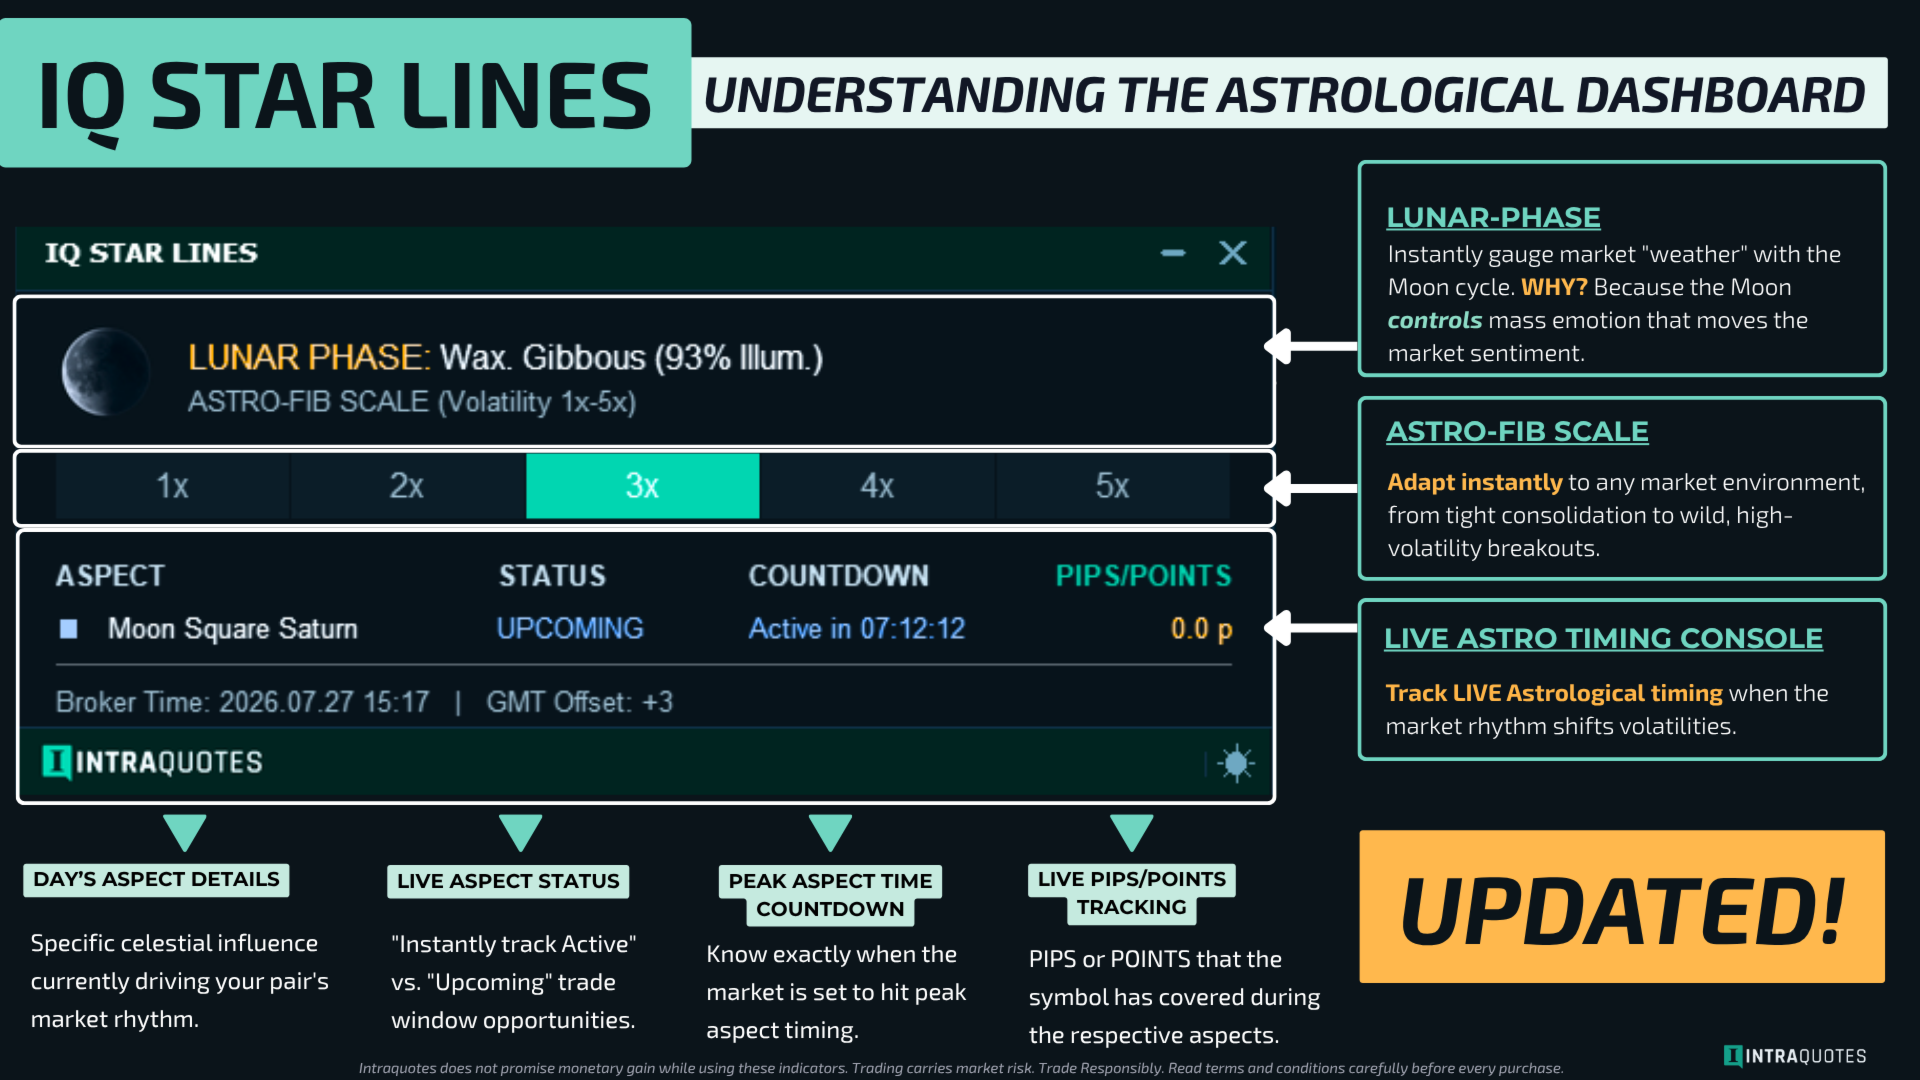
- Astro-Fib Scale (Volatility 1x-5x)
Instantly align the Star levels based on market volatility with 1-click!
- Live Pip/Point Tracker
The dashboard now live-tracks the exact pip/point movement generated during an aspect's Active Status!
- Perfect Price Levels Alignment
Astrological Star price levels now automatically adjust as per the planetary movement to match the market rhythm. This is NOT repainting, this is auto-adjustment based on planetary movements.
- Smart Alert for Active Aspect Timing
Get an alert notification the second a planetary event enters its prime trading window. No more chart-staring!
- Upgraded UI
Modern UI dashboard design for better and clearer understanding.
In astrology, it is a well-established fact that lunar transits have a powerful yet different influence on human behaviour (greed, fear, confidence, depression, aggression, passion, etc), just like it has an effect on tides in water bodies. This, in turn, dictates market sentiment in financial markets. When stars and planets emit subtle cosmic energies, they interact with human physical and emotional states. Vedic astrology involves in-depth micro-metric calculations, making it highly effective for intraday trading.
- Day Traders & Scalpers
Looking for hyper-accurate astrological intraday support and resistance levels. - Prop-Firm Traders
Needing a unique, non-correlated edge to avoid getting chopped out in standard retail zones. - Financial Astrology/Gann Enthusiasts
Who want complex planetary math simplified into clean, actionable trading lines without doing manual calculations. - Time-Poor Traders
Who want to be alerted exactly when the market is about to move, rather than staring at charts all day.
3. Why you shouldn't miss this indicator!
The Leading Edge
Predicts when volatility will happen using celestial mechanics, rather than reacting to price action.
Astro-Fib Fusion
Blends planetary harmonic angles with powerful Fibonacci scaling to capture precise market turning points.
Live Astro-Timing Console
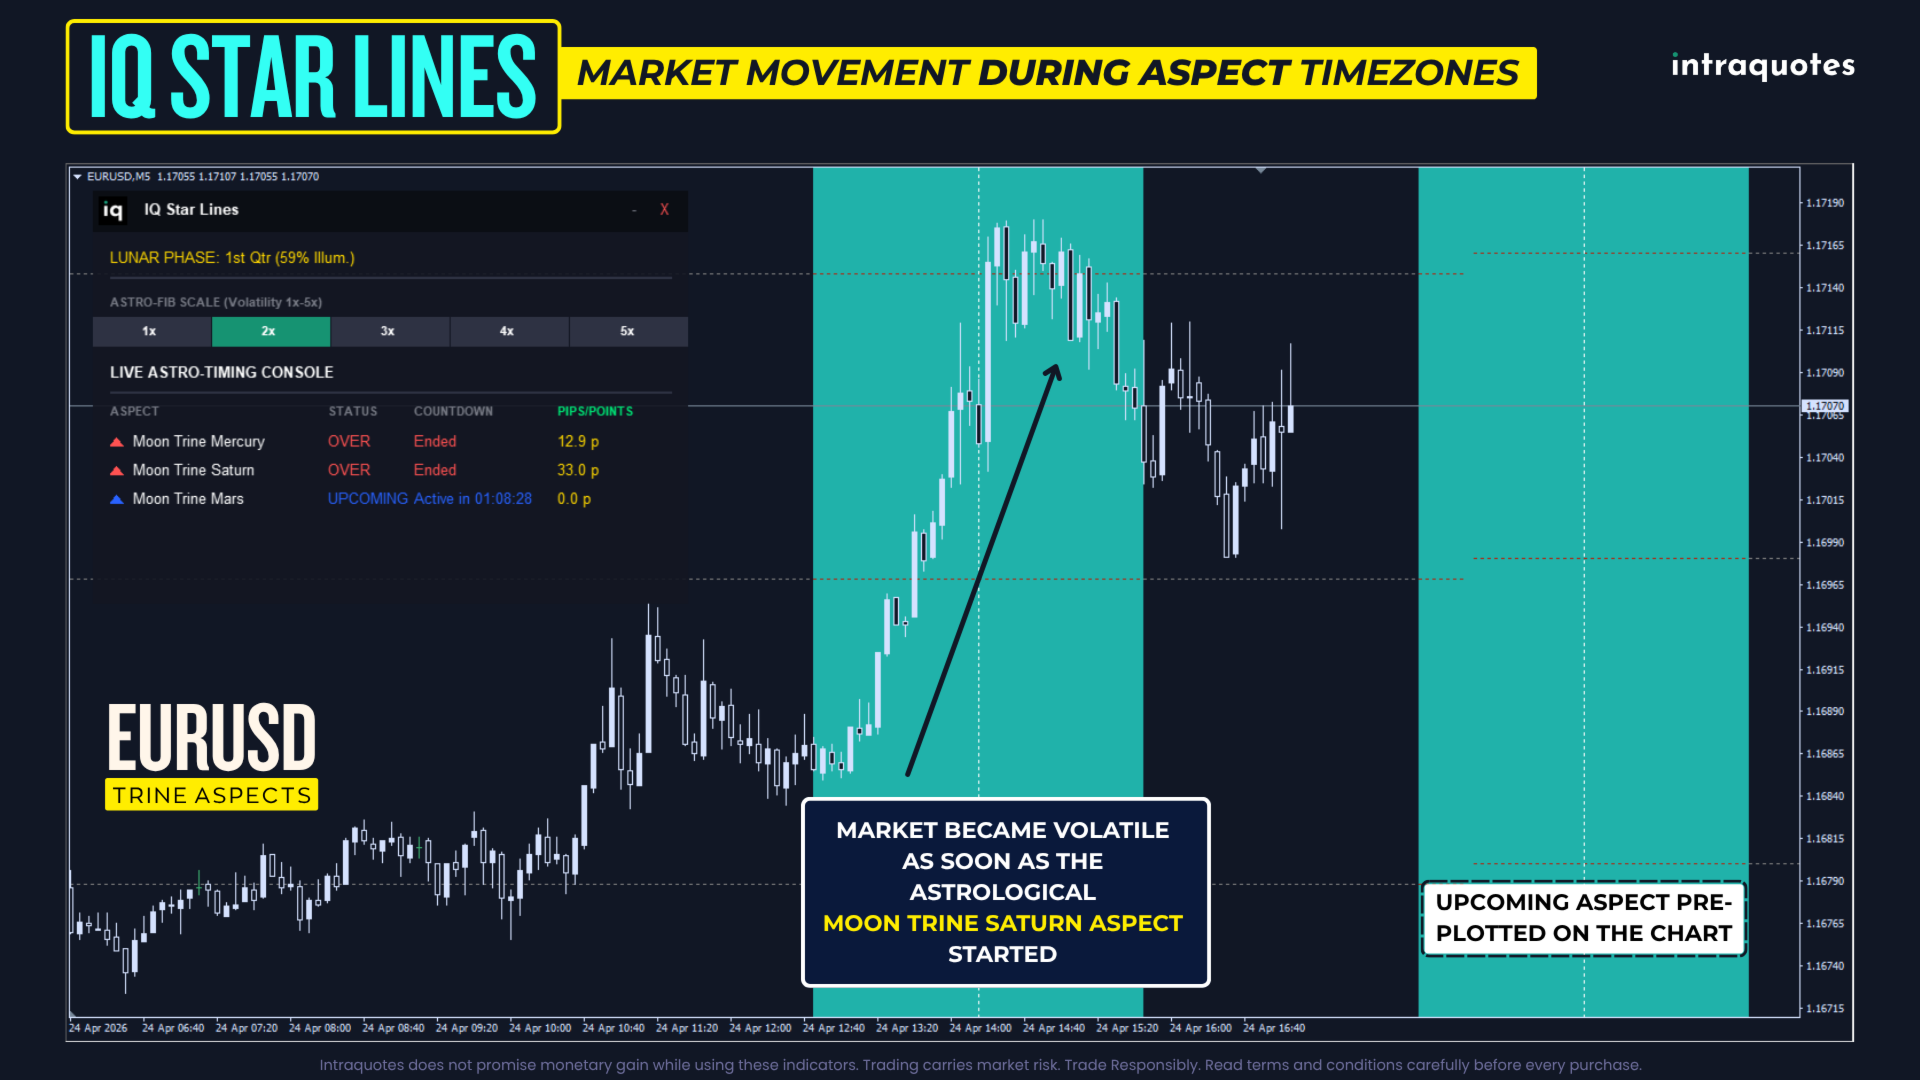
A sleek, on-chart dashboard that tracks upcoming planetary aspects, gives you a live countdown to the "Peak Time," and tracks the actual Pip/Point movement generated during the aspect.
Zero Chart Clutter
Replaces messy, confusing indicator grids with just one solid Astro-Pivot and dotted Astro-Fib Support & Resistance levels.
No Repainting
The math is absolute. Once the day's harmonic cycle begins, your levels are locked in, new updated levels appear only when there's a planetary movement, and that's not repainting.
- Star Price Levels: Star Lines act as support and resistance levels for trading, profit targets, and stop losses.
- Aspect Time: Indicates major astrological timings with potential trend changes or spikes in volatility. Stronger aspects with larger planets increase breakout or reversal chances.
Check the indicator manual for strategy guidance.
- Attach the "IQ Star Lines" indicator to your chart (M5 or M15 timeframes are highly recommended for intraday entries).
- Look at the Astro-Fib Scale on the dashboard and select your preferred volatility (1x to 5x) based on the day's expected movement.
- Keep an eye on the Live Astro-Timing Console. When an aspect switches to "ACTIVE," look out for market movement.
- Trade price reactions off the Star-Pivot and Star Support & Resistance lines.
6. Recommended Timeframe Usage
Use 1-minute and 5-minute charts for highest accuracy. Combine IQ Star Lines with a non-lagging trend indicator (such as Hydra Trend Rider) for best results.
7. Compatible Trading Styles- Trend following
- Breakout
- Continuation
- Trend reversal
8. User Input Settings & Supported Symbols
To keep things simple and professional, the complex math is hidden under the hood. The user settings are purely for your visual comfort and personalization:
- Enable Alerts
Turn this ON to receive pop-up alerts when an aspect enters the prime trading window. - Dashboard Position
Easily move the sleek UI dashboard to any corner of your screen using X & Y offsets. - Line Colors
Fully customize the color of your main Dynamic Star Pivot and your Star Support & Resistance lines. - Aspect Zone & Peak Colors (New!)
You can now fully customize the colors of the shaded background zones for Conjunction, Square, Trine, and Opposition aspects, as well as the dotted vertical "Peak Timeline" that marks the exact center of the astrological event.
Supported Symbols
| Major Pairs | Minor Pairs | Metals | Cryptocurrency |
|---|---|---|---|
| EURUSD, GBPUSD, AUDUSD, NZDUSD, USDJPY, USDCAD, USDCHF | AUDCAD, CADJPY, EURGBP, GBPJPY, AUDJPY, CADCHF, EURJPY, GBPAUD, AUDCHF, CHFJPY, EURAUD, GBPCAD, AUDNZD, NZDCHF, EURCAD, GBPCHF, NZDJPY, EURCHF, GBPNZD, NZDCAD, EURNZD | XAUUSD (Gold) XAGUSD (Silver) | BTCUSD (Bitcoin) |
Planetary aspects are angular relationships between planets, such as conjunction (0°), opposition (180°), trine (120°), and square (90°). These angles indicate how planets interact and influence each other’s energies, impacting intraday market behavior.
Note: IQ Star Lines always plot aspects timings aligned to the your broker timing so that you never miss a good astrological trade window.
10. Understanding the Astro-Fib Scale (Volatility 1x to 5x)
The market moves in different rhythms every day. Some days are slow and consolidating; others are wild breakout days. The IQ Star Lines dashboard features a 1-click Astro-Fib Scale built on pure Vedic Astrological and Fibonacci calculations.
- 1x (Low): Displays the Star levels for tight, slow-moving, consolidating markets.
- 2x (Base): The standard Astro-Fib scale. Perfect for 80% of normal trading days.
- 3x (High): Aligns the Star levels to catch larger intraday trends and minor news events.
- 4x (Extreme): Displays wider Star levels for heavy and volatile trending pairs.
- 5x (Max Breakout): The ultimate limit. Use this on notoriously volatile pairs (like GBPJPY or Gold) during major global news drops or heavy planetary alignments.
11. Smart Trading & Confluence
Not every planetary aspect guarantees a massive market move. Think of an "ACTIVE" aspect as a prime window of opportunity. As a smart trader, always read the room, if the market is completely flat or volume is dead during an Active zone, it is perfectly fine to stay on the sidelines!
IQ Star Lines shines brightest when used as a powerful layer of confluence. We highly recommend pairing it with your favorite trading system (like the AI-Powered Hydra Trend Rider) to confirm the trend direction before entering a trade using the Astro-Fib levels.
12. Aspect Alert Setup
You do not need to stare at the screen all day waiting for a setup.
- Open the indicator input settings.
- Set EnableAlerts to true.
- Exactly 90 minutes before a planetary event hits its peak, the dashboard countdown will change to "Peak in..." and your MetaTrader platform will instantly trigger a pop-up alert: "IQ Star Lines: Moon Conjunction Mars is in the ACTIVE ZONE!"
- This gives you plenty of advance notice to open your chart and watch how price reacts to your Astro-Pivot or Harmonic lines.
13. FAQ & Backtesting Notes
Q: Does this indicator repaint?
A: No, it updates in real time with new star levels as the planets shift their positions and form new angles with each other. The historical lines are locked in.
Q: What timeframe is best?
A: The indicator calculates daily harmonic cycles. You can view it on any timeframe, but M5 and M15 are the absolute best for sniping exact entries at the Support/Resistance levels.
Q: Do I need to know Astrology to use this?
A: Not at all! The indicator does the heavy lifting. If the dashboard says an aspect is ACTIVE and the price hits a Star line, you know it's a high-probability trade setup is forming. Just follow the Star lines and the dashboard status.
Q. Why does the indicator show only the moon aspect?
A: The IQ Star Lines indicator is designed to work only on intraday charts. The Moon aspect is used here to get the most accurate calculations for the Intraday Setup. Aspects with bigger planets are irrelevant as per the intent of the indicator.
Important Note for Visual Backtesting:
IQ Star Lines relies on precise historical price data to anchor its mathematical geometry. If you are running a visual backtest in the Strategy Tester and don't see the Star Pivot or Star lines immediately, don't worry! Your platform is simply catching up on downloading the required historical data for that pair. Just let the backtest run for a few simulated days, and the lines will seamlessly appear once the data is fully loaded into your environment.
How to Get Started- After purchasing, open MetaTrader Software, log in to your account, and open Toolbox - Market - Purchased.
- Install the indicator.
- Open Navigator - Market - Drag & drop the indicator onto the chart.
Discover how our powerful indicators help analyze charts, set targets, and execute profitable trades with daily market updates. Join our new channel.
Support
For assistance or technical issues, send us a direct message on MQL5.
Risk Disclosure:
Trading financial markets carries inherent risks and may not be suitable for every investor. This indicator is designed as a tool to assist in trading decisions but does not guarantee profits or prevent losses, which could exceed your initial investment. Past performance is not a reliable indicator of future outcomes. Users are encouraged to fully understand the risks and seek independent financial advice if needed. Any trading decisions made using this indicator are at the user's discretion and responsibility.
Related topics: Financial astrology, forex, gold, XAUUSD, silver, XAGUSD, forex, WD Gann, Astrological analysis, forex major, forex minor, Vedic, cryptocurrency, trade levels, planetary lines, market trend, scalping, intraday trading, intraday support and resistance levels.